Business analytics: how to abandon Excel without abandoning it

Surely each of you is familiar with the situation when the organization began to conduct internal analytics in Excel, because its capabilities were more than enough. But as a company grows, tasks become more complex, data volumes grow, and Excel begins to groan first, and then turns into a “celestial slug”, due to which daily mass of paid working time is wasted.
Our today's story is about how a federal-level company with a large document flow transitioned from the registry in the form of bulky Excel files to a normal, imputed BI tool. Well, well - about our vision of how the company should go (the client has not yet made a final decision).
Issue issue
So that the essence of the problem was clearer: now in the company, preparation and consolidation of data through Excel takes about 80% of the working time of employees, and 79% is waiting for the program’s reaction. That is, a person performed some manipulations, wrote a formula or a value, pressed the Enter key and goes to smoke, drink coffee or eat lunch: some consolidation operations and data updates take from 40 minutes to 2 hours.
The main problem is the data consolidation mechanism laid down in ancient times - a bunch of complex cross-sectional formulas in which the devil’s leg breaks. Once this mechanism came up with some kind of Excel guru, but he clearly did not expect that such a volume of data would be processed. Previously, everything worked without brakes, and the files with the prescribed formulas were simply copied from project to project. And when problems began a few years later, no one knew exactly how consolidation worked. But it was not possible to find a specialist who would be able to remake it, which is not surprising: developers usually do not learn the formula language of Excel and do not use it.
The complexity and duration of calculations in Excel led to the fact that as data volumes increased, it was necessary to gradually hire more and more employees to the department, since the existing employees could no longer cope with the processing of documents.
This situation was not immediately and not the other day. And as a result, the customer decided: it's time to migrate. The main requirement was that the new system had as little impact on the process as possible. That is, the customer, of course, is not happy that Excel slows down, but he doesn’t want to change his usual operations because of the new tool. The whole technological process can be divided into two main stages:
- preparation of data from different sources, mainly from paper documents,
- entering into the registry in the form of Excel-files and consolidation.
The technological process at the customer is as follows: The
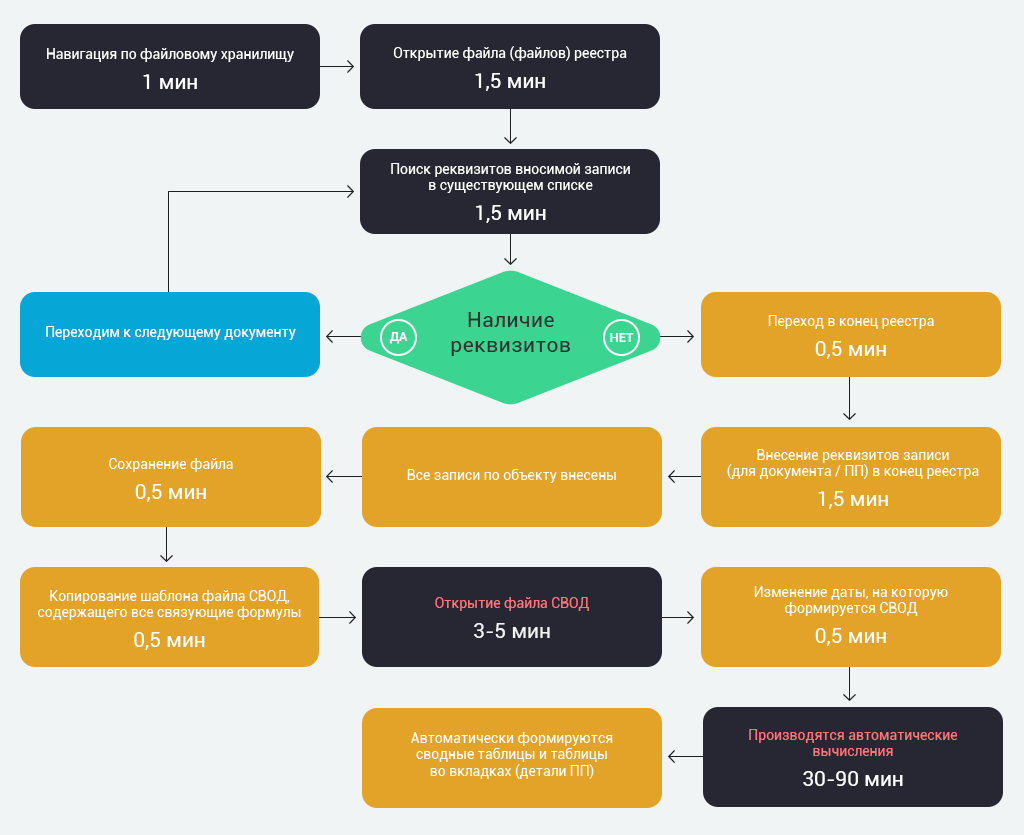
second nuance: when entering data into the registry, employees check if this document has not been entered before. To do this, perform a search on a set of details. We proposed to automate this procedure and identify duplicates already at the input stage. That is, a new document arrives, they begin to drive it without any filters. If the system finds a duplicate by any parameters (for example, by purpose and date of payment), this record is highlighted in red so that the user can find out if there is an error in the data entered or already entered. Thus, control of duplication of records and correctness of input by means of Excel is implemented.
We decided not to create a zoo from different vendors. The Microsoft solution was better in this case, not because this company developed both Excel and Power BI. And not even because they are well integrated with each other. Just Power BI allows you to use as a data source a whole folder into which a user can put different files at his own discretion (including text files). And process them literally with one click. Well, add other sources of information, if necessary (1C, automated accounting systems of other departments, etc.).
Power BI and Power Query literally hundreds of times faster work and allow you to bypass the limit on the amount of data with which Excel operates. At first it was 64 thousand lines, now the bill goes to millions. So if you have rested against Excel, then the next logical step can be to switch to either Power Pivot or Power BI: they use the same approaches and mechanisms. If you used some formulas in the M language (in Power Query) or DAX in Power Pivot for data processing, then all this will work almost unchanged in Power BI.
Power BI, as a single integrated product, allows you to combine all those technologies that for years were "hung" on Excel, like toys for the Christmas tree. Suppose that it is impossible to enter data into it (well, almost), you cannot consider A + B, as it is done in Excel, but you can use it as a processor for large amounts of data. For example, if you need to make some calculations over a huge number of columns or rows. Excel can handle it too, but in hours, and Power BI in seconds.
There are two or three competing products that, hypothetically, can perform the same calculations just as quickly, but they will not integrate so well with Excel and, equally important, you will need to deploy additional IT infrastructure.
In addition, the financial component cannot be discarded: Microsoft provides Power Pivot Desktop for free if you want to use this mechanism only to integrate your own Excel files and will prepare reports or analyze data alone or as part of a small group.
In this case, the files created by Power BI can be freely moved between computers, like Excel reports. As a result, users get into the hands of not just some calculated, fixed data, Power BI provides ample opportunities for constructing various interactive, instantly recalculated graphs and charts.
After the introduction of Power BI, according to the most pessimistic estimates, the duration of the calculation phase decreased 200–300 times (!). Given that the department currently employs 12 people who spend a lot of time processing documents, we can safely reduce the staff by a factor of 4. And this is already a noticeable savings on the payroll and taxes.
But saving time and money is not the only advantage of this solution. Previously, the company never analyzed the entire volume of data - only for each business area or project separately. Excel simply could not cope with such a load. And now not only cross-project analytics will be possible. With the further expansion of this line to, for example, Power BI Pro, Power BI RS or even Power BI Premium, it will be possible to prepare interactive reports for various categories of users, manage access levels to confidential data and provide access via web or mobile devices.
That is, practically without changing the working process, to provide all decision makers in the company with information, as they say, at their finger tips.
Юрий Колмаков, эксперт Департамента систем консолидации и визуализации данных, «Инфосистемы Джет» (McCow)