Load testing in Skyforge, or Bots - server techs. Part 2
Hello again, habrauser!
This is the second article on testing the Skyforge server . Just in case, I remind you that Skyforge is an MMORPG whose server is designed for hundreds of thousands of players and is written in Java.
Unlike the first part , which deals with the role of bots, this article talks about stress testing and metrics.

Readers of Habr know that stress testing is a collection of indicators of software performance in order to verify compliance.
Our requirements for such tests are quite simple: the load on the server in "combat" conditions should be within normal limits, and the user experience should not suffer. Therefore, when organizing load testing, it is first of all necessary to determine which conditions are considered “combat”. For example, for us this means the following: 5,000 players frolic on two servers of game mechanics, one database server and one server with different support services. Secondly, you need to determine what load is considered normal. We believe that a server can handle the load if it spends less than 20 milliseconds in processing per server tick.
We have a service-oriented architecture - this means that the topology of the services during the test should coincide with the topology in “combat” conditions. The volume of content should also be close to the volume that will be on the "combat". In general, load testing is a production in miniature, where instead of real users there are bots.
All tests, including using bots, on our project are launched in a continuous integration system. At the beginning of the test, the build agent updates and starts the server, starts the bots and waits for the specified time, after which it stops the server, analyzes the results and proceeds to the next test.
Due to the fact that we are limited in resources (we have only one bot site), we need to somehow synchronize their use. Therefore, all tests using bots are run on a dedicated build agent.
The main load test, during which all content is checked, goes at night for 8 hours. Why is this duration chosen? It was experimentally noticed that the most serious errors occur at the turn of 4.5-6 hours, and in order to find them, we simply have to conduct such lengthy tests. It is at this interval that a FullGC pause occurs ( more about this phenomenon ), the fight against which is also the goal of the tests. Our plans are to implement ongoing tests lasting 56 hours over the weekend. But for now, unfortunately, these are only plans.
And now I will allow myself to give some advice on the organization of load testing, passing along talking about how it works with us. Yes, I understand that to someone these tips will seem to be the notes of the notorious Captain, but to someone they can still be useful.
The most important stage of load testing is the selection and preparation of servers for tests. Since we do not have battle servers, we chose the ones closest to those that would be at the time of the release of the game. Otherwise, you should use servers similar to the "battle".
Servers must be configured exactly as they will be used in "combat" mode. By the way, we are considering using Thread Affinity technology., which allows you to assign individual processor cores to specific threads, for example, to threads of game mechanics. And if this technology "shoots", it will mean that this setting should be enabled during stress testing. Otherwise, the behavior of the server under load in the test environment and in reality will be significantly different.
You also need to remember that modern servers have “green environment” or “power saving” operating modes. I recommend disabling them immediately, setting the processors to full performance, because the servers will have no time to rest, but fixing non-existent performance problems during the test in eco mode is a bad idea.
It is important that you have full access to your site, so that you can log in at any time and see what happens there, what processes are running, etc. There should not be an army of evil admins that control each sneeze between you and the server. This is necessary for two reasons. Firstly, by setting up your stand yourself and being responsible for its condition, you better understand the problems that may arise. Secondly, you will have complete information about what is happening with your test site. This is very useful when analyzing anomalies in the data obtained.
Full access also means that you are there alone. If you conduct load testing, you need to make sure that the server does not have your colleague doing the same, and also find out if the backup database is happening. You need to be 100% sure that you are there alone.
The easiest and most intuitive way to analyze load data is to visualize it. We use the Highcharts library to build charts , which confidently replaced jqPlot . Let's look at some examples.
I see a similar schedule every morning. It allows you to track the load. The server load is a value equal to the ratio of time in milliseconds spent in processing data for 1 “tick” of the server to 20 milliseconds. If on the graph the indicator is more than one (more than the norm), then everything is bad, if less - everything is good.
This is a general graph of memory usage. It allows you to approximately evaluate the work of the "garbage collector."
This is probably one of the most important graphs for Java servers. It is unlikely that players will not notice a pause during the complete garbage collection. On it along the Y axis the duration of one or another phase of the garbage collector is marked.
Safepoint is the point in the Java Virtual Machine where it stops every time you need to collect a stack trace or garbage collect. Read more about safepoints here . This graph shows how many milliseconds a server spends at these points in 1 minute.
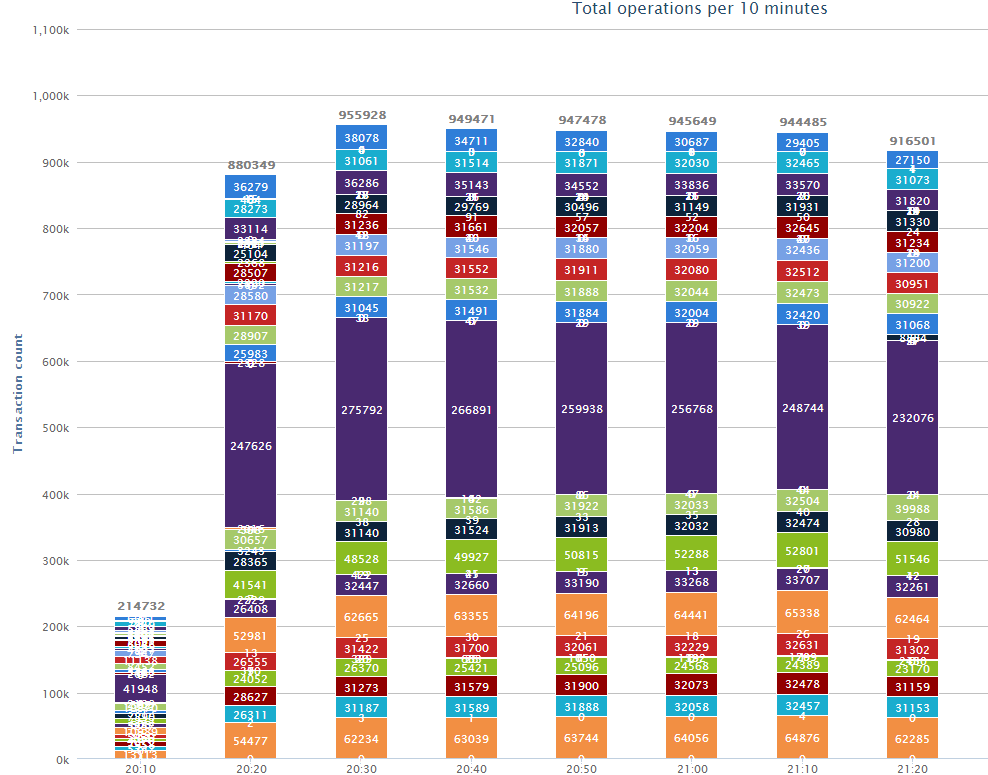
And here are the wonderful “scarves” that were commissioned by Randll , whose report on databases you could read earlier. These “scarves” allow us to evaluate which database-operations and in what quantity we are running.
In addition, several dozens of statistics are also logged that can tell you about both high-level indicators (the number of mobs in a battle with one player) and low-level (the number of transmitted packets). Most of these statistics were created during investigations regarding the increase in workload.
For the same purposes using Yourkit'a APIWe did an automatic removal of the memory dump and load profile at the end of the test. Now they are analyzed only in manual mode, but it is planned to automate this process as well.
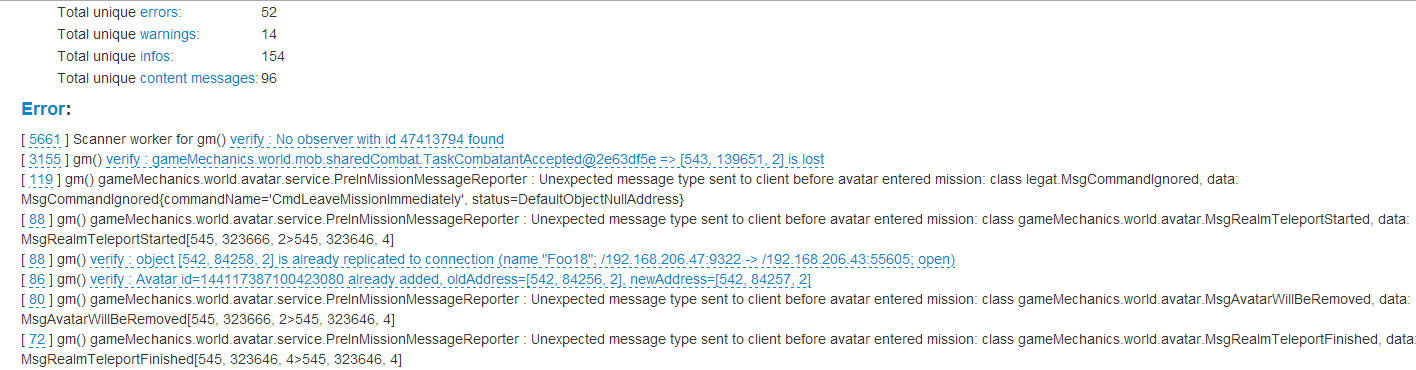
At the end of the test, the so-called error analyzer is launched. We take all the errors - and up to 100 gigabytes of them sometimes runs overnight - and put them on the shelves. We compare which errors are repeated most often and which are rare, and break them down into groups. Sort by type - error, warning or informational message - and find out if this is a content error. We pass content errors to QA content specialists, and we examine the errors in the server code ourselves. The report indicates how many times and at what time intervals the error was repeated. The number indirectly characterizes the difficulty of repeating this error, its cost for the server (do not forget that when collecting every call stack on the server the kitten dies) and priority in the bug tracker.
The time of occurrence makes it possible to estimate the distribution of errors by test time. It is one thing if errors are spread evenly, and quite another if they begin and end at a certain time interval.
In the future, we plan to develop this system so that we can associate errors with tasks in JIRA and find a revision in which the error was noticed for the first time.
Load night tests have very expensive iterations. The cost of each test is a day. Of course, we make every effort to make the test pass every night, but in reality it passes successfully less often, and iterations become even more expensive. Any breakdown in any node of the infrastructure can disrupt the test.
Regular exercise testing using all kinds of statistics is the best way for developers to have a healthy sleep. Now I can’t imagine how you can live without this kind of testing, because thanks to him, every morning I see where we can have acomplete “emergency” . It helps us move in the right direction. Thanks for attention!
Other materials can be viewed on the Skyforge developers website and in our Vkontakte community .
Thanks for the help in creating the report and writing the article to the whole Skyforge server team.
This is the second article on testing the Skyforge server . Just in case, I remind you that Skyforge is an MMORPG whose server is designed for hundreds of thousands of players and is written in Java.
Unlike the first part , which deals with the role of bots, this article talks about stress testing and metrics.
Stress Testing
Readers of Habr know that stress testing is a collection of indicators of software performance in order to verify compliance.
Our requirements for such tests are quite simple: the load on the server in "combat" conditions should be within normal limits, and the user experience should not suffer. Therefore, when organizing load testing, it is first of all necessary to determine which conditions are considered “combat”. For example, for us this means the following: 5,000 players frolic on two servers of game mechanics, one database server and one server with different support services. Secondly, you need to determine what load is considered normal. We believe that a server can handle the load if it spends less than 20 milliseconds in processing per server tick.
We have a service-oriented architecture - this means that the topology of the services during the test should coincide with the topology in “combat” conditions. The volume of content should also be close to the volume that will be on the "combat". In general, load testing is a production in miniature, where instead of real users there are bots.
Testing Organization
All tests, including using bots, on our project are launched in a continuous integration system. At the beginning of the test, the build agent updates and starts the server, starts the bots and waits for the specified time, after which it stops the server, analyzes the results and proceeds to the next test.
Due to the fact that we are limited in resources (we have only one bot site), we need to somehow synchronize their use. Therefore, all tests using bots are run on a dedicated build agent.
Night Bot Test
The main load test, during which all content is checked, goes at night for 8 hours. Why is this duration chosen? It was experimentally noticed that the most serious errors occur at the turn of 4.5-6 hours, and in order to find them, we simply have to conduct such lengthy tests. It is at this interval that a FullGC pause occurs ( more about this phenomenon ), the fight against which is also the goal of the tests. Our plans are to implement ongoing tests lasting 56 hours over the weekend. But for now, unfortunately, these are only plans.
Server
And now I will allow myself to give some advice on the organization of load testing, passing along talking about how it works with us. Yes, I understand that to someone these tips will seem to be the notes of the notorious Captain, but to someone they can still be useful.
The most important stage of load testing is the selection and preparation of servers for tests. Since we do not have battle servers, we chose the ones closest to those that would be at the time of the release of the game. Otherwise, you should use servers similar to the "battle".
Servers must be configured exactly as they will be used in "combat" mode. By the way, we are considering using Thread Affinity technology., which allows you to assign individual processor cores to specific threads, for example, to threads of game mechanics. And if this technology "shoots", it will mean that this setting should be enabled during stress testing. Otherwise, the behavior of the server under load in the test environment and in reality will be significantly different.
You also need to remember that modern servers have “green environment” or “power saving” operating modes. I recommend disabling them immediately, setting the processors to full performance, because the servers will have no time to rest, but fixing non-existent performance problems during the test in eco mode is a bad idea.
It is important that you have full access to your site, so that you can log in at any time and see what happens there, what processes are running, etc. There should not be an army of evil admins that control each sneeze between you and the server. This is necessary for two reasons. Firstly, by setting up your stand yourself and being responsible for its condition, you better understand the problems that may arise. Secondly, you will have complete information about what is happening with your test site. This is very useful when analyzing anomalies in the data obtained.
Full access also means that you are there alone. If you conduct load testing, you need to make sure that the server does not have your colleague doing the same, and also find out if the backup database is happening. You need to be 100% sure that you are there alone.
Recorded statistics
The easiest and most intuitive way to analyze load data is to visualize it. We use the Highcharts library to build charts , which confidently replaced jqPlot . Let's look at some examples.
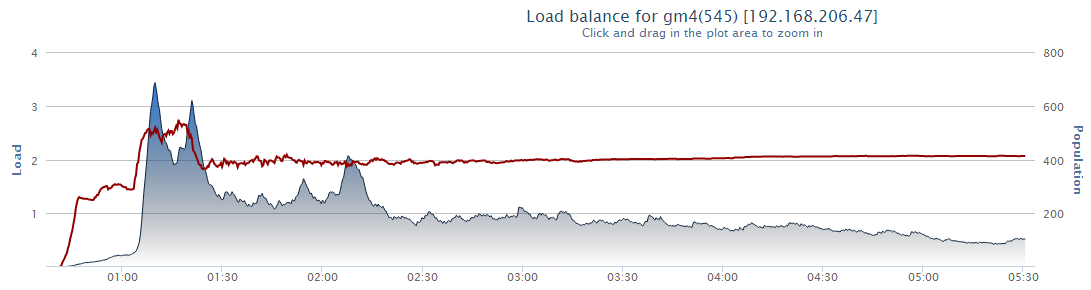
Load graph
I see a similar schedule every morning. It allows you to track the load. The server load is a value equal to the ratio of time in milliseconds spent in processing data for 1 “tick” of the server to 20 milliseconds. If on the graph the indicator is more than one (more than the norm), then everything is bad, if less - everything is good.
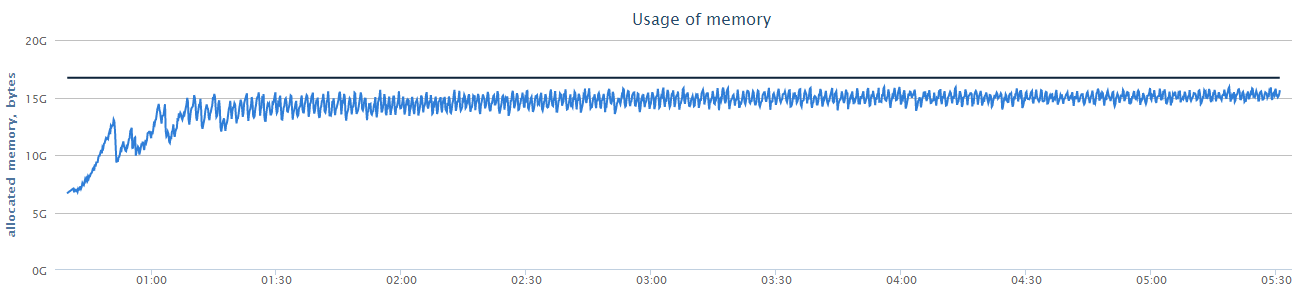
Memory usage graph
This is a general graph of memory usage. It allows you to approximately evaluate the work of the "garbage collector."
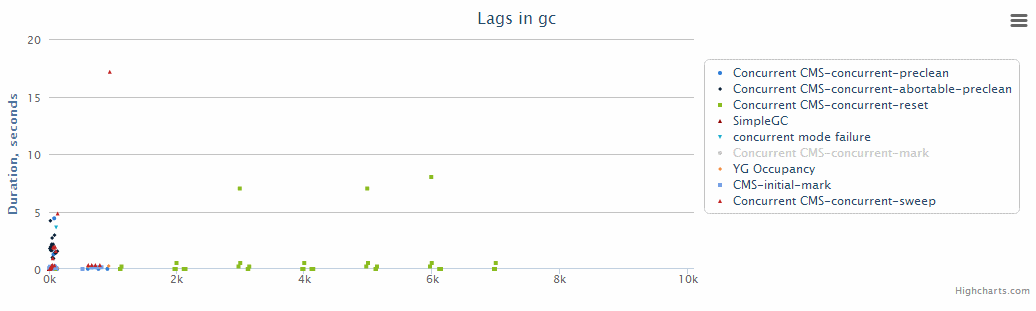
GC Schedule
This is probably one of the most important graphs for Java servers. It is unlikely that players will not notice a pause during the complete garbage collection. On it along the Y axis the duration of one or another phase of the garbage collector is marked.
The keys we use to collect GC performance data
-verbose: gc
-XX: + PrintGCTimeStamps
-XX: + PrintGCDetails
-XX: + PrintGCDateStamps
-XX: + PrintTenuringDistribution
-XX: + PrintGCApplicationStoppedTime
-XX: + PrintPromotionFailure
-XX: + PrintClassHistogramBeforeFullGC
-XX: + PrintClassHistogramAfterFullGC
-XX: + PrintGCApplicationConcurrentTime
-XX: + PrintGCTimeStamps
-XX: + PrintGCDetails
-XX: + PrintGCDateStamps
-XX: + PrintTenuringDistribution
-XX: + PrintGCApplicationStoppedTime
-XX: + PrintPromotionFailure
-XX: + PrintClassHistogramBeforeFullGC
-XX: + PrintClassHistogramAfterFullGC
-XX: + PrintGCApplicationConcurrentTime
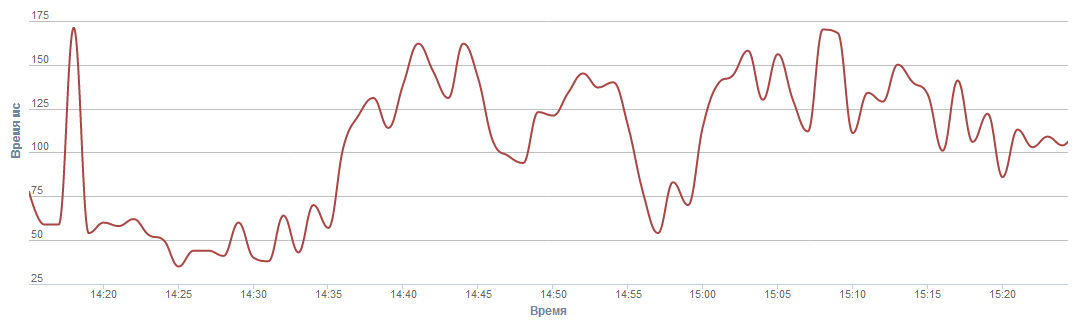
Stops schedule at Safepoint
Safepoint is the point in the Java Virtual Machine where it stops every time you need to collect a stack trace or garbage collect. Read more about safepoints here . This graph shows how many milliseconds a server spends at these points in 1 minute.
Datase base graph
And here are the wonderful “scarves” that were commissioned by Randll , whose report on databases you could read earlier. These “scarves” allow us to evaluate which database-operations and in what quantity we are running.
In addition, several dozens of statistics are also logged that can tell you about both high-level indicators (the number of mobs in a battle with one player) and low-level (the number of transmitted packets). Most of these statistics were created during investigations regarding the increase in workload.
For the same purposes using Yourkit'a APIWe did an automatic removal of the memory dump and load profile at the end of the test. Now they are analyzed only in manual mode, but it is planned to automate this process as well.
Cherry
At the end of the test, the so-called error analyzer is launched. We take all the errors - and up to 100 gigabytes of them sometimes runs overnight - and put them on the shelves. We compare which errors are repeated most often and which are rare, and break them down into groups. Sort by type - error, warning or informational message - and find out if this is a content error. We pass content errors to QA content specialists, and we examine the errors in the server code ourselves. The report indicates how many times and at what time intervals the error was repeated. The number indirectly characterizes the difficulty of repeating this error, its cost for the server (do not forget that when collecting every call stack on the server the kitten dies) and priority in the bug tracker.
The time of occurrence makes it possible to estimate the distribution of errors by test time. It is one thing if errors are spread evenly, and quite another if they begin and end at a certain time interval.
In the future, we plan to develop this system so that we can associate errors with tasks in JIRA and find a revision in which the error was noticed for the first time.
Problems
Load night tests have very expensive iterations. The cost of each test is a day. Of course, we make every effort to make the test pass every night, but in reality it passes successfully less often, and iterations become even more expensive. Any breakdown in any node of the infrastructure can disrupt the test.
Conclusion
Regular exercise testing using all kinds of statistics is the best way for developers to have a healthy sleep. Now I can’t imagine how you can live without this kind of testing, because thanks to him, every morning I see where we can have a
Other materials can be viewed on the Skyforge developers website and in our Vkontakte community .
Thanks for the help in creating the report and writing the article to the whole Skyforge server team.