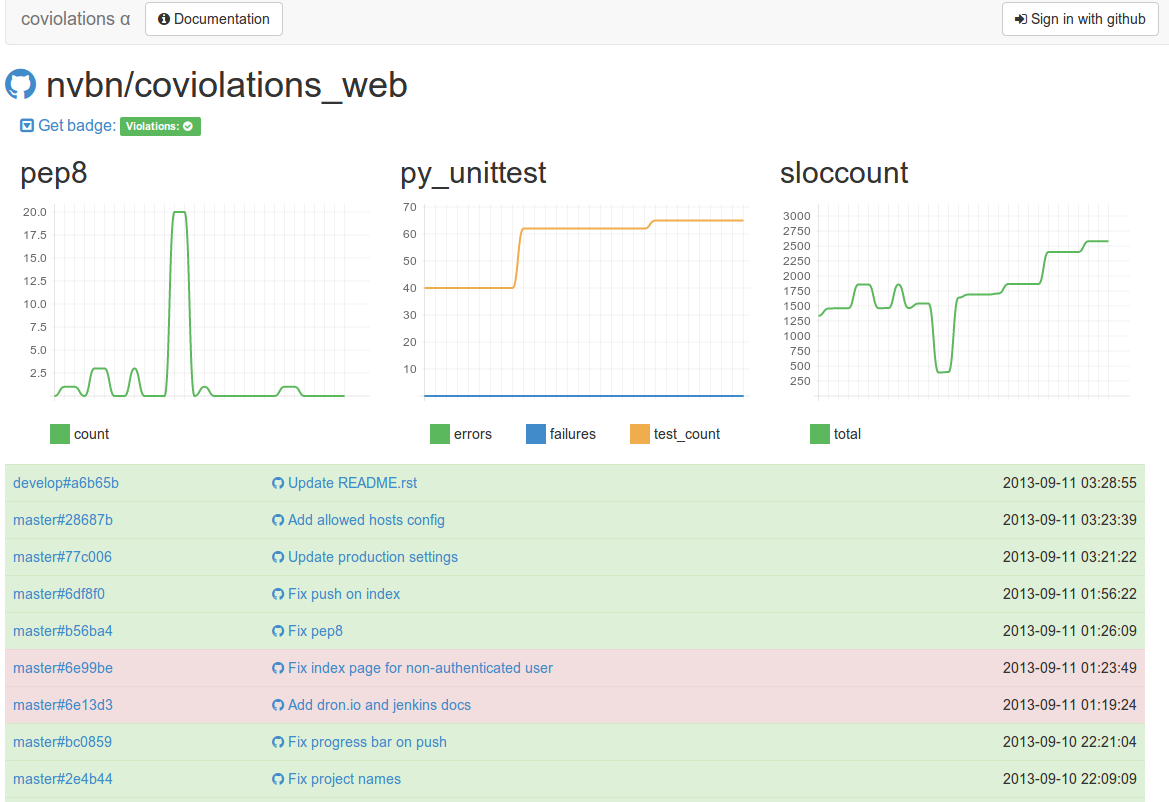
Reports and graphs for travis-ci and drone.io
In large projects, I’ve gotten used to ci buns for quite some time: running tests, reports and automatic deploy. When developing small projects, this is not enough. Travis-ci (well, or drone.io) covers 1 and 3, but there is no visualization of the result.
And immediately came up with a simple solution:
- run analyzers on the ci side;
- send them to yourself;
- parsing the result and beautifully display.
And all this resulted in a small application - coviolations.io ( server and application sources ), now it
- works with public and private github repositories;
- works with travis-ci, drone.io and optionally with jenkins;
- Can parse the result of pep8, sloccount, python unittest, pip-review and testem;
- able to draw a status die
 ;
; - Can comment on pool requests for public projects using travis-ci;
- Does not know how to work with organization repositories.
How to connect to the project?
To connect to the project, you need to add a file
.covio.yml, for example:violations:
pep8: pep8 . --exclude='*migrations*'
sloccount: sloccount .
pip_review: pip-review
py_unittest: cat python_tests.txt
testem: cat testem.out
Where on the left is the name of the analyzer, and on the right is the command to get its output.
Include a project in project management and add a challenge
covio. For
.travis.ymlit will be:after_script:
- pip install coviolations_app
- covio
And for droner.io and jenkins:
pip install coviolations_app
COVIO_TOKEN="token" covio
token can be obtained on the project page.There is no parser of the necessary analyzer?
If there is no parser needed, it is easy to make. The parser itself is just a function in python:
from tasks.const import STATUS_SUCCESS, STATUS_FAILED
from .base import library
@library.register('название анализоатора')
def parse_violation(data):
    # data['raw'] - необработанный вывод анализатора
    data['preview'] = data['raw'][:10] # краткий обработанный результат
    data['prepared'] = data['raw'] + '!' # полный обработанный результат
    data['status'] = STATUS_SUCCESS # или STATUS_FAILED, если всё плохо
    data['plot'] = { # значения для отображения на графики
        'lines_count': len(data['raw'].split('\n')),
        'random_value': 5,
    }
    return data
Available parsers lie in violations .
What's inside?
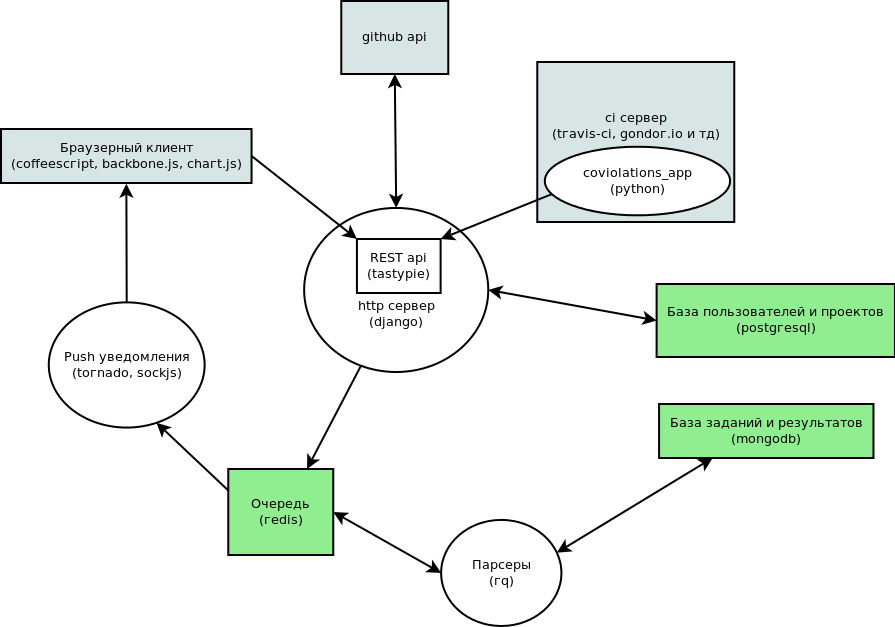
The server part is written in django , the api is implemented through tastypie . Processing the results of analyzers takes place in a pack of workers made with rq . All server-side communication happens through redis . Data is stored in mongodb and postgresql . The browser client is written in coffeescript with backbone.js . Charts are drawn using chart.js . The client communicates with the server via rest api and sockjs .
How to deploy locally?
In order to deploy the local version, just clone the project, install fabric and bower:
git clone https://github.com/nvbn/coviolations_web.git
pip install fabric
npm install bower
Copy the settings file from
coviolations_web/settings/dist.pyto coviolations_web/settings/local.pyand fill it out. In local_nvbn.py are my local settings, in local_production.py - settings from production. And deploy everything with:
fab install
To verify, you can run tests with:
./manage.py test violations projects tasks services app push
To start, you need to execute (each command in a separate console):
./manage.py runserver
./manage.py runpush
./manage.py rqworker
To send results from
covioto a locally deployed instance, add to .covio.yml:endpoint: http://localhost:8000/api/v1/tasks/
Plans
Now it is planned to add support for organization repositories, check pull requests with automatic commenting on them, and many, many parsers. I also want to make annotations to the code from the results of the analyzers, but this is most likely unrealistic.