USE, RED, PgBouncer, its settings and monitoring
We started to update the monitoring for PgBouncer in our service and decided to do a little bit of combing. To make everything fit, we pulled the most famous monitoring performance methodologies: Brendan Gregg’s USE (Utilization, Saturation, Errors) and Tom Wilkie’s RED (Requests, Errors, Durations).
Under the cut, there is a story with graphs about how pgbouncer works, what configuration handles it has, and how to choose the right metrics for monitoring it using USE / RED.
First, about the methods themselves
Although these methods are quite well-known ( they were already on Habré, though not very detailed ), but not that they are widespread in practice.
USE
For each resource, follow the disposal, saturation and errors.
Brendan Gregg
Here, a resource is any individual physical component - CPU, disk, bus, etc. But not only - the performance of some software resources can also be considered by this method, in particular, virtual resources, such as containers / cgroups with limits, are also conveniently considered.
U - Recycling : either the percentage of time (from the observation interval) when the resource was occupied by useful work. Like, for example, CPU utilization or disk utilization, 90% means that 90% of the time was occupied with something useful) or, for resources such as memory, this is the percentage of memory used.
In any case, 100% recycling means that the resource can not be used more than now. And either the work will be stuck waiting for release / sent to the queue, or there will be errors. These two scenarios are covered by the corresponding two remaining USE metrics:
S - Saturation , it's saturation: a measure of the amount of "delayed" / queued work.
E - Errors : just count the number of failures. Errors / failures affect performance, but may not be immediately noticeable due to rerai of fired operations or fault tolerance mechanisms with backup devices, etc.
RED
Tom Wilkie (now working at Grafana Labs) was frustrated by the USE methodology, or rather, by its poor applicability in some cases and inconsistencies in practice. How, for example, to measure the saturation of memory? Or how to measure the errors of the system bus in practice?
Linux, it turns out, really sucks error counters.
T. Wilkie
In short, to monitor performance and the behavior of microservices, he proposed another, suitable method: measure, again, three indicators:
R - Rate : the number of requests per second.
E - Errors : how many requests returned an error.
D - Duration : time taken to process the request. It is also latency, "latency" (© Sveta Smirnova :), response time, etc.
In general, USE is more suitable for monitoring resources, and RED - services and their workload / payload.
Pgbouncer
being a service, it also has all sorts of internal limits and resources. The same can be said about Postgres, which clients access via this PgBouncer. Therefore, for full monitoring in such a situation, both methods are needed.
To figure out how to attach these methods to a bouncer, you need to understand the details of its device. It is not enough to monitor it as a black-box - “is the pgbouncer process alive” or “is the port open”, since in case of problems, it will not give an understanding of what it was and how it broke down and what to do.
What does it do, what PgBouncer looks like from the client’s point of view:
- client connects
- [client makes a request - gets an answer] x how many times he needs
Here I am a pictorial diagram of the corresponding client states from the point of view of PgBoucer:
In the login process, authorization can occur both locally (files, certificates, and even PAM and hba from new versions) or remotely - i.e. in the database itself to which the connection is attempted. Thus, the login state has an additional substate. Let's call it Executingto indicate what is being done auth_queryin the database at this time :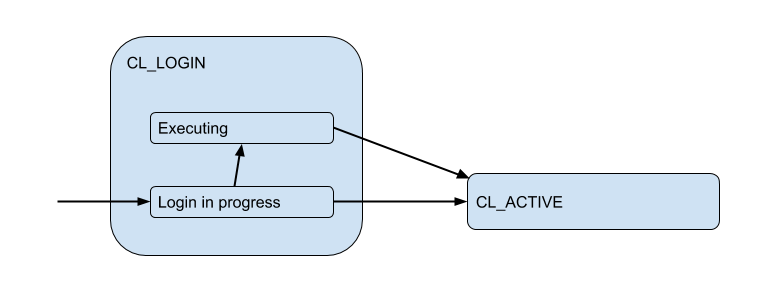
But these client connections are actually matched with backend / upstream base connections, which PgBouncer opens within the pool and holds a limited amount. And they give the client such a connection only for a while - for the duration of the session, transaction or request, depending on the type of pooling (determined by the setting pool_mode). The most commonly used transaction pooling (we will mainly discuss further) - when the connection is issued to the client for one transaction, and the rest of the time the client is not connected to the server after the fact. Thus, the client’s “active” state doesn’t tell us much, and we’ll break it down into the substates: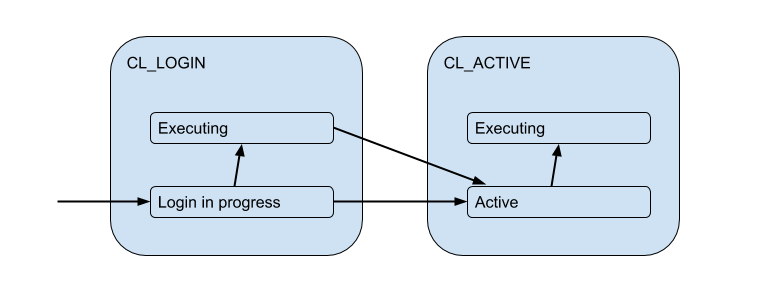
Each such client enters its own pool of connections, which will be issued for use by these connections to Postgres. This is the main task of PgBouncer to limit the number of connections to Postgres.
Due to the limited server connections, a situation may arise when the client needs to fulfill the request right now, but there is no free connection now. Then the client is queued and his connection goes to the state CL_WAITING. Thus, the state diagram must be supplemented: 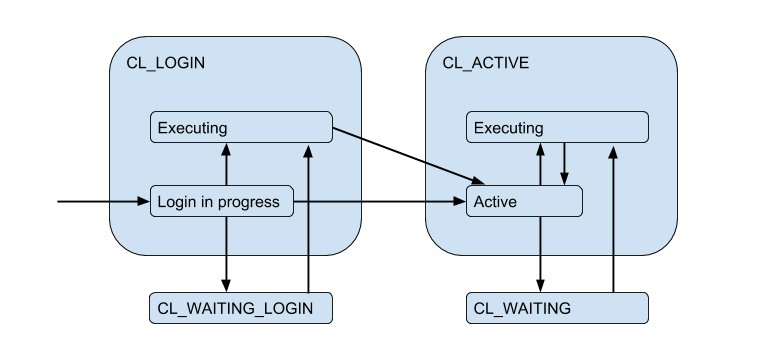
Since this can occur in the case when the client only logs in and needs to complete a request for authorization, a state also occurs CL_WAITING_LOGIN.
If you now look from the back side - from the server connections side, then they, respectively, are in such states: when authorization occurs immediately after the connection - SV_LOGINissued and (possibly) used by the client - SV_ACTIVEor freely - SV_IDLE.
USE for PgBouncer
Thus, we come to the (naive version) Utilization of a specific pool:
Pool utiliz = использованные клиентами соединения / размер пулаPgBouncer has a special pgbouncer service database in which there is a command SHOW POOLSthat shows the current states of the connections of each pool: 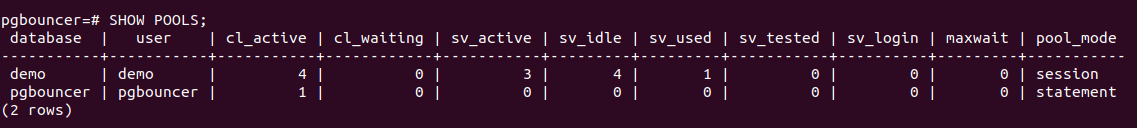
There are 4 client connections open and all of them cl_active. Of the 5 server connections - 4 sv_activeand one in the new state sv_used.
Так вот sv_used означает не "соединение используется", как вы могли подумать, а "соединение было когда-то использовано и давно не использовалось". Дело в том что PgBouncer по умолчанию использует серверные соединения в режиме LIFO — т.е. сначала используются только что освобожденные соединения, потом недавно использованные и т.д. постепенно переходя к давно использованным соединениям. Соответственно серверные соединения со дна такого стека могут "протухнуть". И их перед использованием надо бы проверить на живость, что делается с помощью server_check_query, пока они проверяются состояние будет sv_tested.
Документация гласит, что LIFO включено по умолчанию, т.к. тогда "малое количество коннекшенов получает наибольшую нагрузку. И это дает наилучшую производительность в случае, когда за pgbouncer находится один сервер обслуживающий базу данных", т.е. как бы в самом типичном случае. Я полагаю, что потенциальный буст перформанса происходит из-за экономии на переключении исполнения между несколькими backend процессами посгреса. Но достоверно это выяснить не получилось, т.к. эта деталь имплементации существует уже > 12 лет и выходит за пределы commit history на гитхабе и глубины моего интереса =)
Так вот, мне показалось странным и не соответствующим текущим реалиям, что дефолтовое значение настройки server_check_delay, которая определяет что сервер слишком давно не использовался и его надо бы проверить прежде чем отдавать клиенту, — 30 секунд. Это при том, что по дефолту одновременно включен tcp_keepalive с настройками по-умолчанию — начать проверять соединение keep alive пробами через 2 часа после его idle'инга.
Получается, что в ситуации burst'а / всплеска клиентских соединений, которые хотят что-то выполнять на сервере, вносится дополнительная задержка на server_check_query, который хоть и "SELECT 1; все равно может занимать ~100 микросекунд, а если вместо него поставить просто server_check_query = ';' то можно ~30 микросекунд сэкономить =)
Но и предположение, что выполнять работу всего в нескольких коннекшенах = на нескольких "основных" бекенд процессах постгреса будет эффективнее, мне кажется сомнительным. Постгрес воркер процесс кэширует (мета)информацию про каждую таблицу, к которой было обращение в этом соединении. Если у вас большое количество таблиц, то этот relcache может сильно вырасти и занять много памяти, вплоть до своппинга страниц процесса 0_о. Для обхода этого подойдет настройка server_lifetime (по умолчанию — 1 час), по которой серверное соединение будет закрыто для ротации. Но с другой стороны есть настройка server_round_robin, которая переключит режим использования соединений с LIFO на FIFO, размазав клиентские запросы по серверным соединениям более равномерно.
Naively removing metrics from SHOW POOLS(by some prometheus exporter) we can plot these states:
But to get to recycling, you need to answer a few questions:
- What is the size of the pool?
- How to count how many compounds are used? In jokes or in time, on average or in peak?
Pool size
It's all complicated, as in life. In total, there are already five limit settings in the pbbaunser!
pool_sizecan be set for each base. A separate pool is created for each DB / user pair, i.e. from any additional user, you can create morepool_sizePostgres backends / workers. Because ifpool_sizenot specified, it is folded indefault_pool_size, which is defaulted to 20, then it turns out that each user with connection rights to the database (and working through pgbouncer) can potentially create 20 Postgres processes, which are not many. But if you have many different user bases or the bases themselves, and the pools are not registered with a fixed user, i.e. will be created on the fly (and thenautodb_idle_timeoutdeleted), then it can be dangerous =)Perhaps it is worth leaving
default_pool_sizesmall, on the safe side.max_db_connections- just needed in order to limit the total number of connections to one database, because otherwise, badly behaving, clients can create a lot of backends / postgres processes. And by default here - unlimited ¯_ (ツ) _ / ¯It may be worth changing the default
max_db_connections, for example, you can focus onmax_connectionsyour Postgres (by default 100). But if you have a lot of PgBouncer's ...reserve_pool_size- actually, ifpool_sizeall is used, then PgBouncer can open several more connections to the base. I understand this is done to cope with the surge load. We will come back to this.max_user_connections- It is, on the contrary, the limit of connections from one user to all databases, i.e. true if you have several bases and they go under the same user.max_client_conn- how many client connections at all will PgBouncer accept in total. The default, as is customary, has a very strange value - 100. That is, It is assumed that if suddenly more than 100 clients are breaking, they should just give up almostreseteverything silently at the TCP level and that's it (well, in the logs, you have to admit, there will be "no more connections allowed (max_client_conn)").Perhaps worth doing
max_client_conn >> SUM ( pool_size'ов ), for example, 10 times more.
In addition to the SHOW POOLSservice pseudo-base, pgbouncer also provides a command SHOW DATABASESthat shows the limits actually applied to a specific pool:
Server connections
Once again - how to measure how many compounds are used?
In jokes on average / in peak / in time?
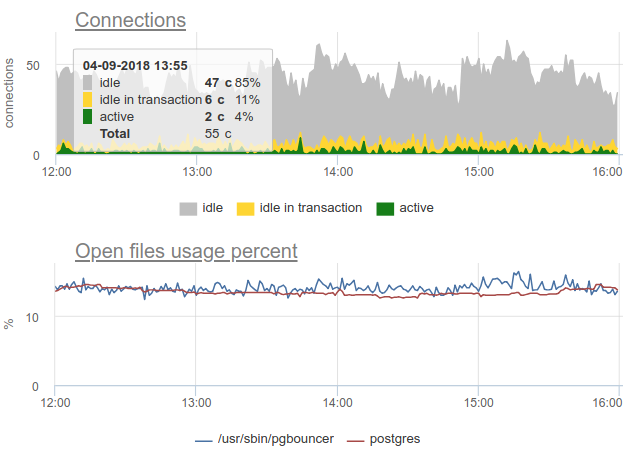
In practice, it’s quite problematic to monitor the use of pools with a bouncer by common tools, since pgbouncer itself provides only a momentary picture, and how often do not do a survey, there is still the possibility of a wrong picture due to sampling. Here is a real example when, depending on when the exporter was working out - at the beginning of a minute or at the end - the picture of both open and used compounds changes fundamentally:
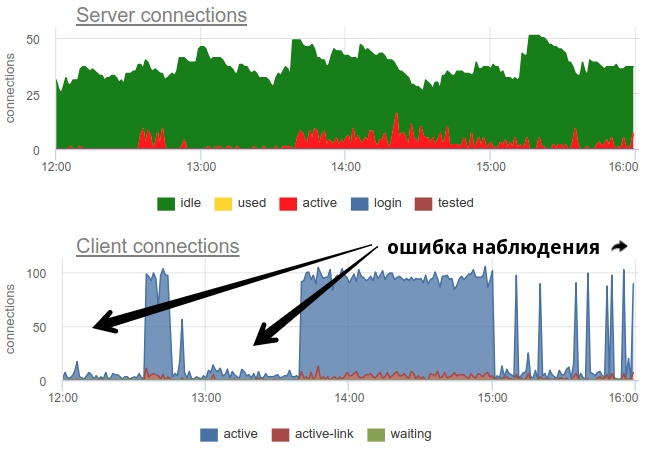
Here all the changes in the load / use of the connections are just a fiction, an artifact of the statistics collector restarts. Here you can look at the graphs of connections in Postgres during this time and on the file descriptors of the bouncer and PG - no changes:
Let's return to the issue of recycling. We in our service decided to use the combined approach - we sample SHOW POOLSonce a second, and once a minute we render both the average and maximum number of connections in each stage:
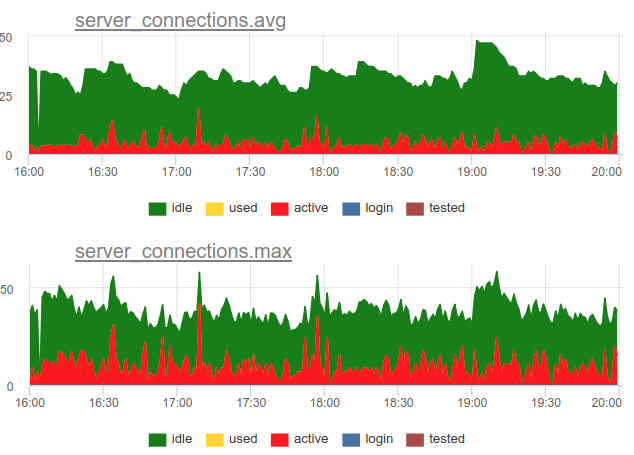
And if we divide the number of these active state connections by the size of the pool, we get the average and peak utilization of this pool and we can alert if it is close to 100%.
In addition, PgBouncer has a team SHOW STATSthat will show usage statistics for each proxied database: 
We are most interested in the column here total_query_time- the time spent by all connections in the process of executing queries in postgres. And from version 1.8 there is also a metric total_xact_time- time spent in transactions. On the basis of these metrics, we can build the utilization of server connection time; this indicator is not subject to sampling problems, in contrast to those calculated from the state connections, because these total_..._timecounters are cumulative and do not miss anything:

Compare 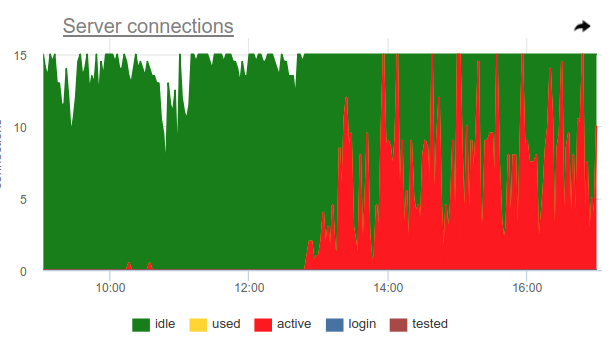
It can be seen that sampling does not show all moments of high ~ 100% utilization, and query_time shows.
Saturation and PgBouncer
Why do we need to follow Saturation, because by high utilization it is already clear that everything is bad?
The problem is that no matter how measured the recycling, even the accumulated counters cannot show the local 100% use of the resource if it occurs only at very short intervals. For example, you have any crowns or other synchronous processes that can simultaneously begin to make requests to the base on command. If these requests are short, then recycling, measured on the scale of a minute or even a second, may be low, but at the same time these requests were forced to wait for the queue to be executed. It looks like the situation is not 100% CPU usage and high Load average - it seems that CPU time is still there, but nevertheless many processes are waiting in the queue for execution.
How can you track such a situation - well, again, we can simply count the number of clients in the state of cl_waitingagreement SHOW POOLS. In a normal situation, such - zero, and more than zero means the overflow of this pool:
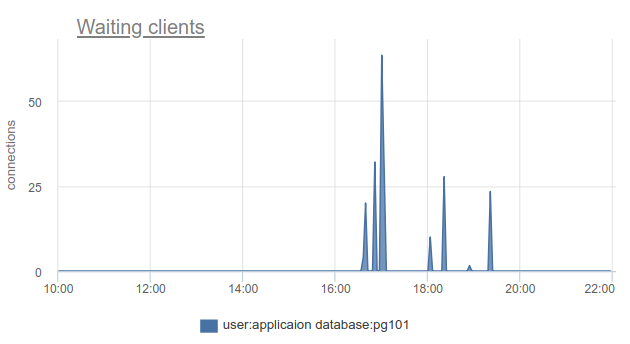
There remains a problem with the fact that SHOW POOLSyou can only sample, and in a situation with synchronous crowns or something like that, we can simply skip and not see such waiting customers.
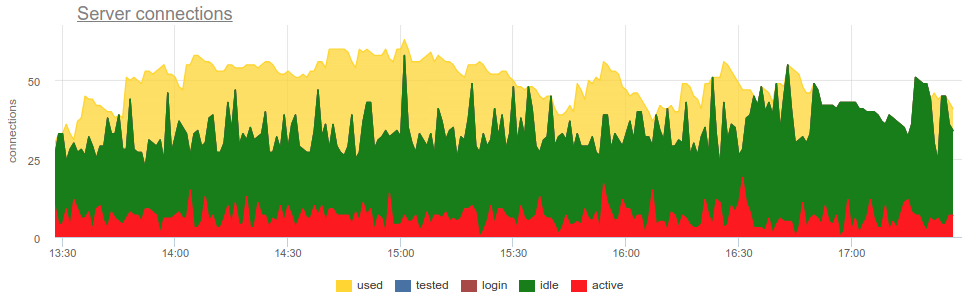
You can use this trick, pgbouncer can detect 100% use of the pool itself and open a backup pool. Two settings are responsible for this: reserve_pool_size- for its size, as I said, and reserve_pool_timeout- how many seconds a client should be waitingbefore using the backup pool. Thus, if we see on the server connection graph that the number of connections open to Postgres is greater than pool_size, then there was pool saturation, like this: 
Clearly, something like crones makes many requests once per hour and completely occupies the pool. And even despite the fact that we do not see the moment when the activeconnections exceed the pool_sizelimit, anyway, the pgbouncer was forced to open additional connections.
Also on this graph is clearly visible the work settings server_idle_timeout- after how much cease to keep and close connections that are not used. By default, this is 10 minutes, which we see on the chart - after the peaks at activeexactly 5:00, at 6:00, etc. (according to cron 0 * * * *), connections hang idle+ used10 more minutes and close.
If you live on the cutting edge of progress and have updated PgBouncer over the past 9 months, you can find it in the SHOW STATScolumn total_wait_timethat best shows the saturation, since cumulatively considers the time spent by customers in the waitingstate. For example, here - the state waitingappeared at 16:30: 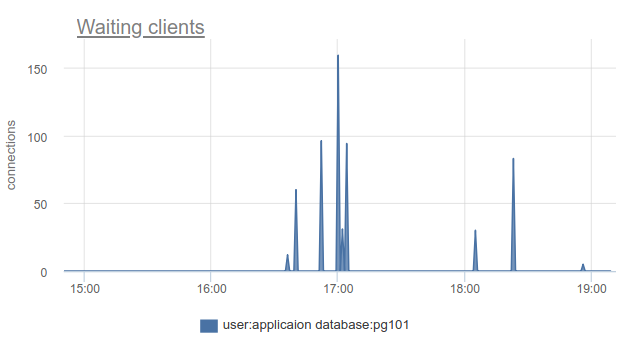
A wait_time, which is comparable and clearly influencing average query time, can be seen from 15:15 and almost to 19:
However, monitoring client connection states is still very useful, because allows you to find out not only the fact that all connections are spent on such a database and customers have to wait, but also due to the fact that it is SHOW POOLSdivided into separate pools by users, but SHOW STATSnot, it allows you to find out exactly which customers used all connections up to a given database - on the column of the sv_activecorresponding pool. Or by metric
sum_by(user, database, metric(name="pgbouncer.clients.count", state="active-link")):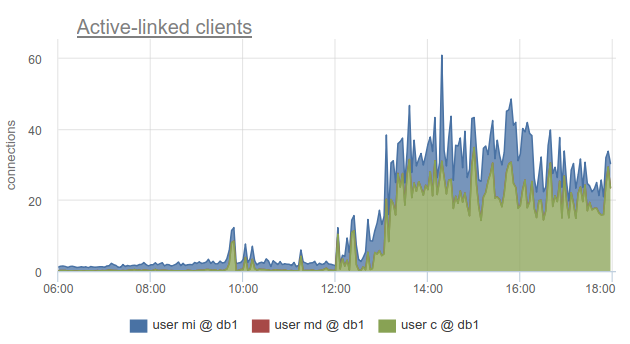
We went even further into okmeter and added a breakdown of the connections used to the IP addresses of the clients who opened and used them. This allows you to understand exactly which application instances behave differently: 
Here we see the IPs of specific kubernetes pods that you need to deal with.
Errors
There is nothing particularly tricky here: pgbouncer writes logs in which it reports errors if the limit of client connections is reached, the timeout for connecting to the server, etc. So far we have not gotten to the pgbouncer logs :(
RED for PgBouncer
While USE is more focused on performance, in the sense of bottlenecks, RED, in my opinion, is more about the characteristics of incoming and outgoing traffic in general, and not about bottlenecks. That is, RED answers the question - does everything work fine, and if not, then USE will help you understand the problem.
Requests
It would seem that everything is quite simple for a SQL database and for a proxy / connection puller to such a database - clients execute SQL statements, which are Requests. From SHOW STATSwe take total_requestsand build a graph of its time derivative
rate(metric(name="pgbouncer.total_requests", database: "*"))
But in fact there are different modes of pulling, and the most common - transactions. The unit of operation of this mode is a transaction, not a request. In line with this, starting with version 1.8, Pgbouner has already provided two other statistics - total_query_count, instead of total_requests, and total_xact_count- the number of past transactions.
Now workload can be characterized not only in terms of the number of completed requests / transactions, but you can, for example, look at the average number of requests per transaction into different databases, dividing one into another
rate(metric(name="total_requests", database="*")) / rate(metric(name="total_xact", database="*"))
Here we see obvious changes in the load profile, which may be the reason for the change in performance. And if they were looking only at the rate of transactions or requests, they could not see it.
RED Errors
It is clear that RED and USE overlap in error monitoring, but it seems to me that errors in USE are mostly about request processing errors due to 100% utilization, i.e. when the service refuses to take more work. And errors for RED would be better to measure errors precisely from the point of view of the client, client requests. That is, not only in a situation when the pool in PgBouncer is full or another limit has been triggered, but also when request timeouts have been triggered, such as "canceling statement due to statement timeout", cancel'y and rollbacks and transactions by the client itself, t. e. higher-level, closer to the business logic types of errors.
Durations
Here again we will help SHOW STATSwith cumulative counters total_xact_time, total_query_timeand total_wait_time, dividing that by the number of requests and transactions, respectively, we obtain the average request time, average transaction time, average waiting time per transaction. I already showed the schedule about the first and third:
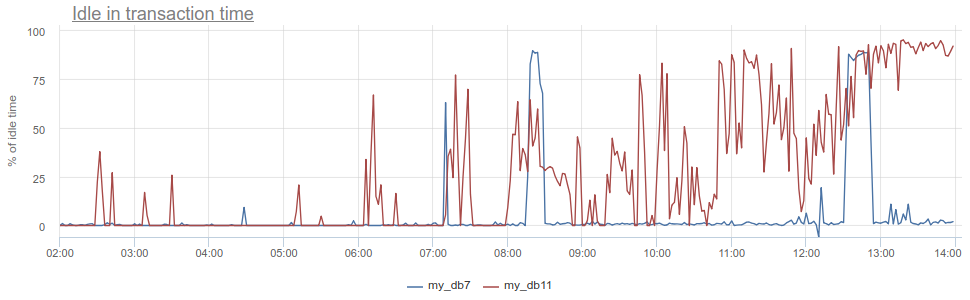
What is there more to get? The well-known anti-pattern in working with the database and Postgres in particular, when an application opens a transaction, makes a request, then starts (long) to process its results or worse, goes to some other service / base and makes there requests. All this time, the transaction "hangs" in the post-open state, the service then returns and makes some more requests, updates in the database and only then closes the transaction. For postgres it is especially unpleasant, because pg workers are expensive. So, we can monitor when such an application resides idle in transactionin the very postgres itself - according to the column statein pg_stat_activity, but there all the same described problems with sampling, since pg_stat_activitygives only the current picture. In PgBouncer, we can deduct time spent by customers in queriestotal_query_timefrom the time spent in transactions total_xact_time- this will be the time of such idling. If the result is still divided by total_xact_time, then it will turn out to be normalized: the value 1 corresponds to the situation when customers are 100% of the time idle in transaction. And with such a normalization it makes it possible to easily understand how bad everything is:
In addition, returning to Duration, the metric total_xact_time - total_query_timecan be divided by the number of transactions to see how much the average idle application is per transaction.
In my opinion, USE / RED methods are most useful for structuring which metrics you are shooting and why. Since we are monitoring full-time and we have to do monitoring for a variety of infrastructure components, these methods help us remove the right metrics, make the right schedules and triggers for our clients.
Good monitoring cannot be done right away, this is an iterative process. We in okmeter.io just continuous monitoring (a lot of things, but tomorrow will be better and more detailed :)