Twitter Zipkin
- Transfer
 Zipkin is a distributed tracing system that helps us collect the runtime data of all disparate services on Twitter. It manages the collection and retrieval of data through the services of Collector and Query. We designed Zipkin on the model of Google Dapper . Subscribe to
 @ZipkinProjectand stay tuned.And why this distributed trace?
Collecting traces helps developers gain deeper knowledge about how specific queries are executed in a distributed system. Let's say we have problems with user requests, for example, a timeout is exceeded. We can view traces of requests that have fallen off and show them in the web interface. We can quickly find the service guilty of an unexpected increase in response time. If the service has been annotated in detail, we can also find in which place of the service the problem occurred.
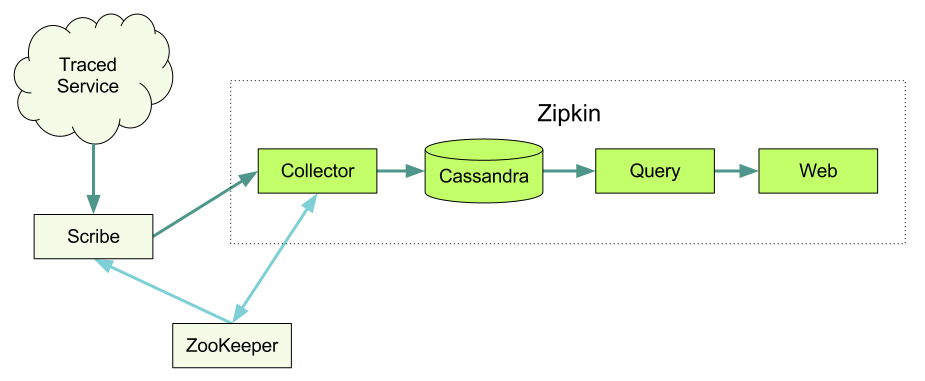
Architecture
These components make up a complete trace system.
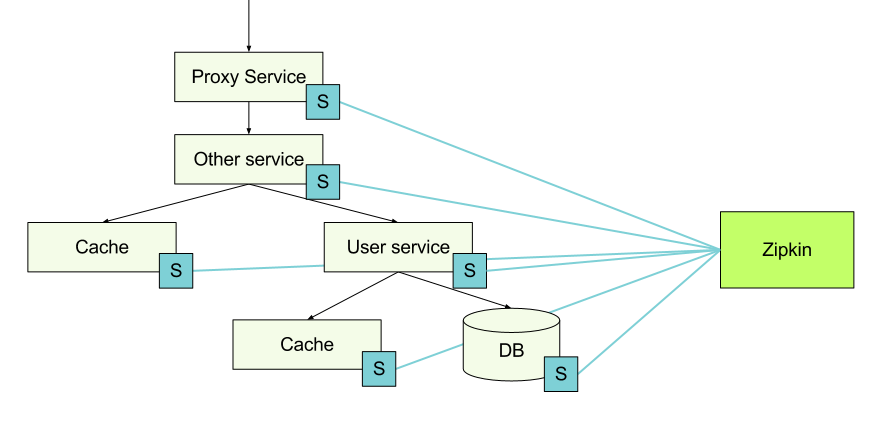
Tool libraries
Trace information is collected on each node using tool libraries that direct them to the node with Zipkin. When a host makes a request to another service, it passes some trace identifiers along with the request, so you can later link this data together.
Finagle
Finagle is an asynchronous network stack for the JVM that you can use to create asynchronous clients and remote procedure call (RPC) servers in Java, Scala, or any other language that uses the JVM.
Finagle is heavily used inside Twitter, which is why it has become an obvious starting point for trace support. So far we have a client / server that supports Thrift and HTTP, as well as a client that supports only Memcache and Redis.
To set up your Finagle server in Scala, simply follow these steps. Adding a trace is just adding a finagle-zipkin dependency and calling
tracerin ServerBuilder.ServerBuilder()
.codec(ThriftServerFramedCodec())
.bindTo(serverAddr)
.name("servicename")
.tracer(ZipkinTracer.mk())
.build(new SomeService.FinagledService(queryService, new TBinaryProtocol.Factory()))
Tracing setup for clients is similar. After you set the Zipkin tracer as shown above, a small selection of your requests will be routed automatically. We will record when the request began, when it ended, as well as the services and hosts involved in the request.
In case you want to record additional information, you can add a custom note to the code.
Trace.record("starting that extremely expensive computation");
In the example above, a line note will be attached to the point in time when it was executed. You can also add a note by key value. It looks like this:
Trace.recordBinary("http.response.code", "500");
Ruby thrift
This is the gem we use to trace requests. In order to embed the tracer and generate trace request identifiers, you can use this gem in RackHandler. See the zipkin-web example where we track tracers.
To track calls from Ruby code, we rely on the Ruby Thrift Twitter client . See below an example of how to use the client.
client = ThriftClient.new(SomeService::Client, "127.0.0.1:1234")
client_id = FinagleThrift::ClientId.new(:name => "service_example.sample_environment")
FinagleThrift.enable_tracing!(client, client_id), "service_name")
Querulous
Querulous is a Scala library for interacting with databases. Includes tracking of timings of request and execution of SQL.
Cassie
Cassie is a Finagle-based client library for Cassandra. The configuration of the tracer in Cassie is almost the same as in Finagle, but in the case of Cassie KeyspaceBuilder is used.
cluster.keyspace(keyspace).tracer(ZipkinTracer.mk());
Transport
We use Scribe to transfer all traces from various services to Zipkin and Hadoop. Scribe was developed on Facebook, and it consists of a daemon that can be run on every server on your system. It scans the message log and sends them to the correct service receiver, depending on the category.
Zipkin Collector Demon
As soon as the trace data arrives at the Collector daemon, we check its correctness, save and build the index for the search.
Storage
We use Cassandra to store data. It is scalable, flexible, and heavily used on Twitter. We tried to make this component modular, so it should not be difficult to replace it with something else.
Request daemon
After the data is recorded and indexed, we need a convenient way to retrieve it. Query daemon comes to the rescue here, giving users the ability to find and retrieve traces using the simple Thrift API. See an example of a Thrift file .
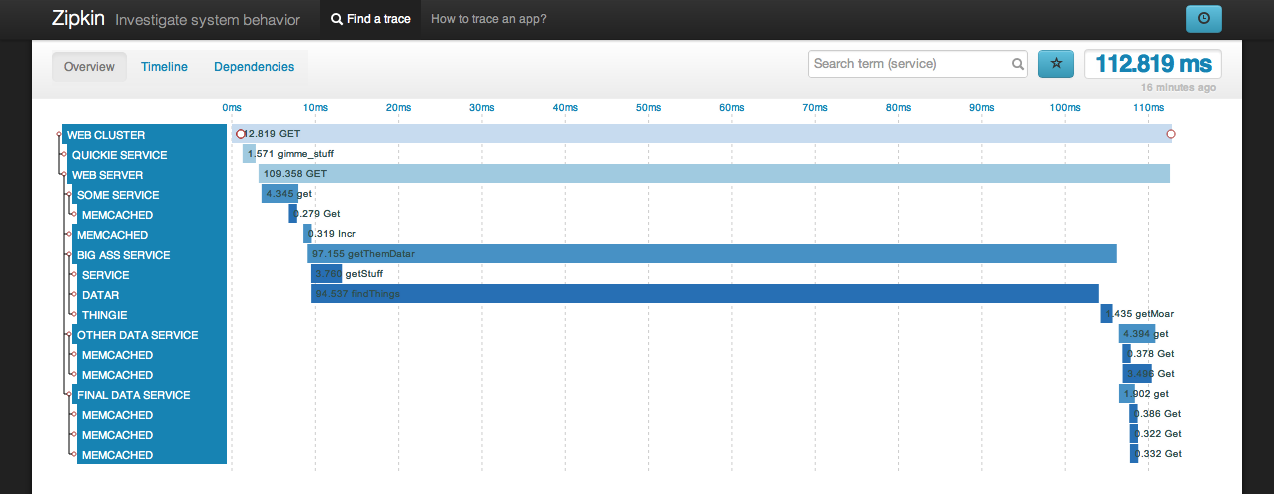
User interface
Most of our users access data through the UI developed by us. This is a Rails application that uses D3 to visualize trace data. Please note that the user interface does not have a built-in authorization function.
Modules

Installation
To get up to speed quickly, see the Ubuntu Quickstart and Mac Quickstart tutorials . They will help you run Zipkin on a single computer so that you can experiment with it.
A little bit about customization.
Cassandra
Zipkin is most often used in conjunction with Cassandra. There is also a plugin for Redis and we would like to see support for other databases.
- Visit the Cassandra website for instructions on how to start a cluster.
- Use a Zipkin adapted circuit. You can create it with the following command:
$ cassandra-cli -host localhost -port 9160 -f zipkin-cassandra/src/schema/cassandra-schema.txt
Zookeeper
Zipkin can use ZooKeeper for coordination. This is where we store reference values and register the servers themselves.
Visit the ZooKeeper website for installation instructions.
Scribe
Scribe is a logging framework that we use on Twitter as a transport of trace data. There are several other ways to pass trace data to Zipkin; in particular, if you just want to try Zipkin, you can skip this step completely and direct ZipkinTracer directly to Collector.
To use Scribe with Zipkin, you need to create a network attached storage that is specified in the Collector daemon. Setting up storage in Zipkin might look something like this:
  category=zipkin
  type=network
  remote_host=123.123.123.123
  remote_port=9410
  use_conn_pool=yes
  default_max_msg_before_reconnect=50000
  allowable_delta_before_reconnect=12500
  must_succeed=no
If you do not want to hardcode the IP address of your collector, then there are several options. One is to use an internal DNS record for collectors, so you will have one place where you have to change addresses when adding or removing collectors. In addition, you can use a modified version of Scribe, which picks up the addresses of collectors through ZooKeeper. When the collector starts, it registers itself with ZooKeeper, and when it finishes work, it is automatically deleted. Modified Scribe receives notifications when changes occur with collectors. To activate this mode, change
remote_hostthe configuration to zk://zookeeper-hostname:2181/scribe/zipkinor similar.Zipkin Servers
We developed Zipkin with Scala 2.9.1, SBT 0.11.2 and JDK7.
The Ubuntu Quickstart and Mac Quickstart manuals explain how to install and run Collector and Query services.
Zipkin ui
UI is a regular Rails 3 application.
- Update your ZooKeeper server configuration. It is used to search for Query daemons.
- Deploy the appropriate application server under Rails. For testing, the built-in is also suitable:
$ bundle install && bundle exec rails server
The Gem Zipkin-tracer adds tracing to a Rails application through the Rack Handler. Add to config.ru:
  use ZipkinTracer::RackHandler
  run
If the Rails application itself serves static assets, then the trace of these requests will be saved.
Running a task in Hadoop
It is possible to configure Scribe to store data in Hadoop. If you do this, you can create various reports from data that are not easy to process on the fly in Zipkin itself.
We use a library called Scalding to build tasks for Hadoop from Scala.
- To run a task in Hadoop, you first need to build a jar.
$ sbt 'project zipkin-hadoop' compile assembly - In scald.rb, change the name of the node to which you want to copy the jar and run the task.
- Update the jar version in scald.rb, if necessary.
- Now you can run the task using our scald.rb script.
$ ./scald.rb --hdfs com.twitter.zipkin.hadoop.[classname] --date yyyy-mm-ddThh:mm yyyy-mm-ddThh:mm --output [dir]
How to prepare libraries
We have instructed several libraries and protocols ourselves, but still hope to get some help in expanding their number. Before we get started, we need to know a few things about how trace data is structured.
- Annotation - includes some value, time stamp and node address;
- Span - a set of Annotation that match a specific RPC;
- Trace is a set of Span that share a single root Span.
The above is used when sending trace data to Zipkin. Some details are described here .
Another important part of the trace is the lightweight header, which we use to transfer information between services. The header consists of:
- Trace Id - identifies the trace;
- Span Id - identifiers of individual requests;
- Optional Parent Span Id - added if this request was made as part of another;
- Sampled (boolean field) - tells us whether to keep trace data or not.
Now that we know a little about data types, let's take a step-by-step look at how instrumentation works. In the example below I will describe how HTTP tracing works in Finagle. For other libraries and protocols, the actions, of course, may differ, but the general principle remains.
Server side
- Check for trace headers in the incoming request. If so, we accept the identifiers associated with this request. If not, then we generate a Trace id, Span id and decide whether to save the data or not. See HttpServerTracingFilter for an example.
- Если текущий запрос участвует в выборке, то мы собираем информацию, такую как имя службы, имя хоста, имя Span (http get/put к примеру) и непосредственно нашу заметку. Мы создаем заметки «server received», когда мы получили запрос и «server send» когда мы завершили обработку и собираемся отправить результат. Опять же вы можете увидеть пример в HttpServerTracingFilter.
- Созданные данные трассировки передаются объекту tracer, который был указан в ServerBuilder. Это может быть, например, ConsoleTracer, но в нашем случае используется ZipkinTracer. Когда ZipkinTracer получает данные трассировки, то группирует их по Span Id.
- Как только ZipkinTracer получает событие «end of span», такое как заметка «server received» или тайм-аут, он направляет к Scribe агрегированные данные в виде Thrift-структуры. Если такого события не происходит, данные все равно будут переданы. Мы открыты для добавления других способов доставки данных, для нас имеет смысл Thrift и Scribe, но возможно JSON и Http будет работать лучше для некоторых случаев.
На стороне клиента
- Перед выполнением запроса, выясните, являемся ли мы уже частью трассировки. Может быть, этот клиент используется в пределах сервера и Trace Id уже назначен. Мы повторно использовать этот Trace id, но создаем новый Span Id для нового запроса. Мы также устанавливаем Parent Span Id предыдущего Span, если таковой имеется. Некоторые примеры здесь и здесь.
- Similar to the server-side option, we have an HttpClientTracingFilter that adds trace headers to the outgoing Http request.
- We must also create appropriate notes, such as “client send” before the request and “client receive” after receiving a response from the server.
- Similar to the server version, the data is transmitted by ZipkinTracer, which sends them to Zipkin.