From loaded MPP, the DBMS is a vigorous Data Lake with analytical tools: sharing the creation details
All organizations that have at least some relation to the data, sooner or later face the issue of storing relational and unstructured databases. It is not easy to find at the same time a convenient, effective and inexpensive approach to this problem. And also to make sure that data scientists with machine learning models can successfully work on data. We did it - and even though we had to tinker, the final profit turned out to be even more than expected. We will tell about all the details below.

Over time, an incredible amount of corporate data accumulates in any bank. A comparable amount is stored only in Internet companies and telecom. It happened because of the high requirements of regulatory authorities. These data do not lie idle - the heads of financial institutions have long figured out how to extract profit from this.
It all started with management and financial reporting. Based on this data, they learned how to make business decisions. It was often necessary to obtain data from several bank information systems, for which we created consolidated databases and reporting systems. From this gradually formed what is now called the data warehouse. Soon, on the basis of this repository, our other systems also started working:
All these tasks are solved by analytical applications that use machine learning models. The more information models can take from storage, the more accurate they will work. Their need for data is growing exponentially.
Approximately we came to this situation two or three years ago. At that time we had a repository based on MPP Teradata DBMS using ELT-tool SAS Data Integration Studio. We have been building this storage facility since 2011 together with Glowbyte Consulting. More than 15 major banking systems have been integrated into it and, at the same time, have accumulated a sufficient amount of data for the implementation and development of analytical applications. By the way, just at this time, the volume of data in the main layers of the store began to grow nonlinearly due to a multitude of different tasks, and the advanced client analytics became one of the main directions of the bank’s development. Yes, and our data scientists were eager to support it. In general, to build the Data Research Platform, the stars are formed as it should.
Here it is necessary to clarify: industrial software and servers are expensive even for a large bank. Not every organization can afford to store a large amount of data in the top MPP database. You always have to make a choice between price and speed, reliability and volume.
To make the most of the available opportunities, we decided to do this:
At about that time, the Hadoop ecosystem became not only fashionable, but also sufficiently reliable, convenient for enterprise-use. It was necessary to choose a distribution kit. You could build your own or use open Apache Hadoop. But among enterprise-solutions based on Hadoop, ready distributions from other vendors, Cloudera and Hortonworks, have recommended themselves more. Therefore, we also decided to use a ready-made distribution.
Since our main task was to store structured big data, we were interested in the Hadoop stack solutions that were as close as possible to the classic SQL DBMS. The leaders here are Impala and Hive. Cloudera develops and integrates Impala, Hortonworks - Hive solutions.
For an in-depth study, we organized load testing for both DBMSs, taking into account the load profile for us. I must say that the data processing engines in Impala and Hive are significantly different - Hive generally represents several different options. However, the choice fell on Impala - and, accordingly, the distribution kit from Cloudera.
The next most important tool in the Hadoop stack is Sqoop for us. It allows you to transfer data between relational databases (we were, of course, interested in Teradata) and HDFS in the Hadoop cluster in various formats, including Parquet. In tests, Sqoop showed high flexibility and performance, so we decided to use it - instead of developing our own data capture tools via ODBC / JDBC and saving to HDFS.
To train the Data Science models and related tasks that are more convenient to perform directly on the Hadoop cluster, we used Apache Spark . In its field, it has become a standard solution - and for good reason:
As a hardware platform, we purchased an Oracle Big Data Appliance server. We started with six nodes in the production loop with a 2x24-core CPU and 256 GB of memory on each. The current configuration contains 18 of the same nodes with expanded memory up to 512 GB.
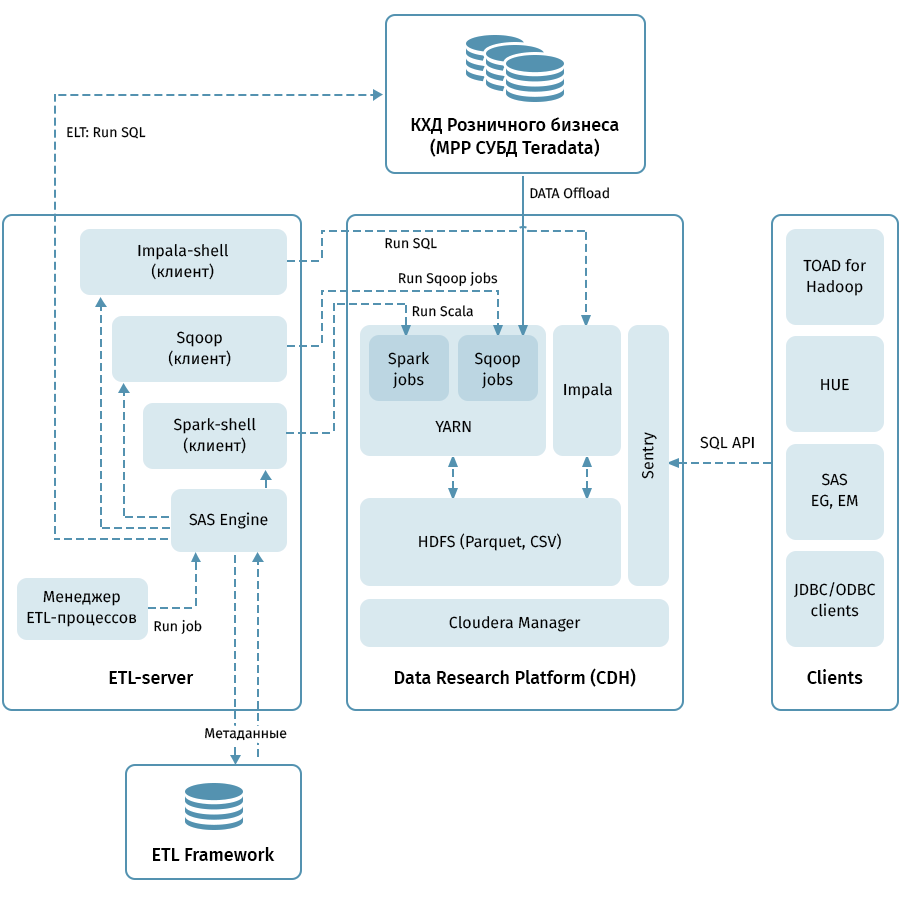
The diagram shows the high-level architecture of the Data Research Platform and related systems. The central link is the Hadoop cluster based on the Cloudera distribution (CDH). It is used for both to get Sqoop and to store QCD data in HDFS - in parquet format that allows the use of compression codecs, for example, Snappy. The cluster also processes data: Impala is used for ELT-like transformations, Spark is used for Data Science tasks. Sentry is used to separate data access.
Impala has interfaces for almost all modern enterprise analytics. In addition, arbitrary tools that support ODBC / JDBC interfaces can be connected as clients. To work with SQL, we consider Hue and TOAD for Hadoop as our main clients.
The ETL subsystem consisting of SAS tools (Metadata Server, Data Integration Studio) and the ETL framework written on the basis of SAS and shell scripts using the database for storing the metadata of ETL processes are used to control all the flows indicated by the arrows in the diagram. . Guided by the rules specified in the metadata, the ETL subsystem runs data processing processes on both QCD and the Data Research Platform. As a result, we have an end-to-end system for monitoring and managing data flows regardless of the environment used (Teradata, Impala, Spark, etc., if there is a need for that).
Unloading QCD seems to be easy. At the input and output of relational DBMS, take and pour data through Sqoop. Judging by the description above, everything went very smoothly with us, but, of course, it was not without adventures, and this is perhaps the most interesting part of the whole project.

With our volume to pour all the data entirely every day could not hope. Accordingly, it was necessary to learn how to allocate a reliable increment from each storage object, which is not always easy when the data for historical business dates can change in the table. To solve this problem, we systematized objects depending on the methods of loading and maintaining history. Then, for each type, the correct predicate for Sqoop and the method of loading into the receiver were determined. Finally, they wrote instructions for developers of new objects.
Sqoop is a very high-quality tool, but it does not work absolutely reliably in all cases and combinations of systems. The Teradata connector did not work optimally on our volumes. We took advantage of the openness of the Sqoop code and made changes to the connector libraries. The stability of the connection when moving data has increased.
For some reason, when Sqoop is addressed to Teradata, predicates are not quite correctly converted into WHERE conditions. Because of this, Sqoop sometimes tries to pull out a huge table and filter it later. We did not manage to patch the connector here, but we found another way out: we forcibly create a temporary table with a predicate for each paged object and ask Sqoop to overflow it.
All MPP, and Teradata in particular, have a peculiarity related to the parallel storage of data and the execution of instructions. If this feature is not taken into account, then it may turn out that one logical node of the cluster will take over all the work, due to which the execution of the query will become much slower, since it is 100-200 times. Of course, we could not allow this, so we wrote a special engine that uses ETL-metadata of the QCD tables and selects the optimal degree of parallelization of the Sqoop tasks.
Historicity in the repository is a delicate matter, especially if you use SCD2, while UPDATE and DELETE are not supported in Impala. Of course, we want the historical tables in the Data Research Platform to look exactly the same as in Teradata. This can be achieved by combining the incremental acquisition via Sqoop, the allocation of updatable business keys and the deletion of partitions in Impala. To prevent this fanciful logic from being written to every developer, we packed it into a special library (on our ETL slang “loader”).
Finally - a question with data types. Impala treats type conversion fairly freely, so we encountered some difficulties only in the TIMESTAMP and CHAR / VARCHAR types. For date-time, we decided to store data in Impala in text (STRING) format YYYY-MM-DD HH: MM: SS. This approach, as it turned out, quite allows you to use date and time transformation functions. For string data of a given length, it turned out that storing in the STRING format in Impala is not inferior to them, so we also used it.
Usually, to organize Data Lake, data sources are copied in semi-structured formats into a special stage area in Hadoop, after which the Hive or Impala tools set the de-serialization scheme for this data for use in SQL queries. We went the same way. It is important to note that not everything and not always makes sense to drag into the data warehouse, since the development of processes for copying files and installing a scheme is much cheaper than loading business attributes into the QCD model using ETL processes. When it is still not clear to what extent, for how long, and how often the source data is needed, Data Lake in the described approach is a simple and cheap solution. Now we regularly load into Data Lake primarily sources that generate user events: application analysis data,
We have not forgotten about another goal of the whole project - to enable analysts to use all this wealth. Here are the basic principles that guided us here:
And on what stopped:
Data Lake currently contains about 100 TB of data from retail storage plus about 50 TB from a number of OLTP sources. The lake is updated daily in incremental mode. In the future, we are going to increase user convenience, bring ELT-load to Impala, increase the number of sources loaded into Data Lake, and expand the possibilities for advanced analytics.
In conclusion, I would like to give some general advice to colleagues who are just starting their way in creating large repositories:
By the way, you can read about how our analysts used machine learning and bank data to work with credit risks in a separate post .
Over time, an incredible amount of corporate data accumulates in any bank. A comparable amount is stored only in Internet companies and telecom. It happened because of the high requirements of regulatory authorities. These data do not lie idle - the heads of financial institutions have long figured out how to extract profit from this.
It all started with management and financial reporting. Based on this data, they learned how to make business decisions. It was often necessary to obtain data from several bank information systems, for which we created consolidated databases and reporting systems. From this gradually formed what is now called the data warehouse. Soon, on the basis of this repository, our other systems also started working:
- analytical CRM, which allows to offer the client more convenient products for him;
- credit lines that help to quickly and accurately make a decision on granting a loan;
- loyalty systems that calculate cashback or bonus points according to mechanics of varying complexity.
All these tasks are solved by analytical applications that use machine learning models. The more information models can take from storage, the more accurate they will work. Their need for data is growing exponentially.
Approximately we came to this situation two or three years ago. At that time we had a repository based on MPP Teradata DBMS using ELT-tool SAS Data Integration Studio. We have been building this storage facility since 2011 together with Glowbyte Consulting. More than 15 major banking systems have been integrated into it and, at the same time, have accumulated a sufficient amount of data for the implementation and development of analytical applications. By the way, just at this time, the volume of data in the main layers of the store began to grow nonlinearly due to a multitude of different tasks, and the advanced client analytics became one of the main directions of the bank’s development. Yes, and our data scientists were eager to support it. In general, to build the Data Research Platform, the stars are formed as it should.
Planning a solution
Here it is necessary to clarify: industrial software and servers are expensive even for a large bank. Not every organization can afford to store a large amount of data in the top MPP database. You always have to make a choice between price and speed, reliability and volume.
To make the most of the available opportunities, we decided to do this:
- ELT-load and the most demanded part of the historical data of HD leave on the Teradata DBMS;
- The full history of shipping to Hadoop, which allows you to store information much cheaper.
At about that time, the Hadoop ecosystem became not only fashionable, but also sufficiently reliable, convenient for enterprise-use. It was necessary to choose a distribution kit. You could build your own or use open Apache Hadoop. But among enterprise-solutions based on Hadoop, ready distributions from other vendors, Cloudera and Hortonworks, have recommended themselves more. Therefore, we also decided to use a ready-made distribution.
Since our main task was to store structured big data, we were interested in the Hadoop stack solutions that were as close as possible to the classic SQL DBMS. The leaders here are Impala and Hive. Cloudera develops and integrates Impala, Hortonworks - Hive solutions.
For an in-depth study, we organized load testing for both DBMSs, taking into account the load profile for us. I must say that the data processing engines in Impala and Hive are significantly different - Hive generally represents several different options. However, the choice fell on Impala - and, accordingly, the distribution kit from Cloudera.
What did Impala like?
- High speed of analytic queries due to an alternative approach to MapReduce. Intermediate results of calculations are not discarded in HDFS, which significantly speeds up data processing.
- Efficient work with collated data storage in Parquet . For analytical tasks, so-called wide tables with many columns are often used. All columns are rarely used - the ability to raise from HDFS only the ones needed for operation saves RAM and significantly speeds up the request.
- Elegant solution with runtime filters including bloom filtering. Both Hive and Impala are significantly limited in the use of indexes common to classic DBMSs due to the nature of the HDFS file system. Therefore, to optimize the execution of a SQL query, the DBMS engine should effectively use the available partitioning even when it is not explicitly specified in the query conditions. In addition, he needs to try to predict what the minimum amount of data from HDFS needs to be raised to ensure that all rows are processed. In Impala, it works very well.
- Impala uses the LLVM compiler on a virtual machine with RISC-like instructions to generate the optimal execution code for the SQL query.
- ODBC and JDBC interfaces are supported. This allows almost out of the box to integrate Impala data with analytical tools and applications.
- It is possible to use Kudu to bypass some of the limitations of HDFS, and, in particular, to write UPDATE and DELETE constructs in SQL queries.
Sqoop and the rest of the architecture
The next most important tool in the Hadoop stack is Sqoop for us. It allows you to transfer data between relational databases (we were, of course, interested in Teradata) and HDFS in the Hadoop cluster in various formats, including Parquet. In tests, Sqoop showed high flexibility and performance, so we decided to use it - instead of developing our own data capture tools via ODBC / JDBC and saving to HDFS.
To train the Data Science models and related tasks that are more convenient to perform directly on the Hadoop cluster, we used Apache Spark . In its field, it has become a standard solution - and for good reason:
- Spark ML machine learning libraries;
- support for four programming languages (Scala, Java, Python, R);
- integration with analytical tools;
- in-memory data processing gives excellent performance.
As a hardware platform, we purchased an Oracle Big Data Appliance server. We started with six nodes in the production loop with a 2x24-core CPU and 256 GB of memory on each. The current configuration contains 18 of the same nodes with expanded memory up to 512 GB.
The diagram shows the high-level architecture of the Data Research Platform and related systems. The central link is the Hadoop cluster based on the Cloudera distribution (CDH). It is used for both to get Sqoop and to store QCD data in HDFS - in parquet format that allows the use of compression codecs, for example, Snappy. The cluster also processes data: Impala is used for ELT-like transformations, Spark is used for Data Science tasks. Sentry is used to separate data access.
Impala has interfaces for almost all modern enterprise analytics. In addition, arbitrary tools that support ODBC / JDBC interfaces can be connected as clients. To work with SQL, we consider Hue and TOAD for Hadoop as our main clients.
The ETL subsystem consisting of SAS tools (Metadata Server, Data Integration Studio) and the ETL framework written on the basis of SAS and shell scripts using the database for storing the metadata of ETL processes are used to control all the flows indicated by the arrows in the diagram. . Guided by the rules specified in the metadata, the ETL subsystem runs data processing processes on both QCD and the Data Research Platform. As a result, we have an end-to-end system for monitoring and managing data flows regardless of the environment used (Teradata, Impala, Spark, etc., if there is a need for that).
Through the rake to the stars
Unloading QCD seems to be easy. At the input and output of relational DBMS, take and pour data through Sqoop. Judging by the description above, everything went very smoothly with us, but, of course, it was not without adventures, and this is perhaps the most interesting part of the whole project.
With our volume to pour all the data entirely every day could not hope. Accordingly, it was necessary to learn how to allocate a reliable increment from each storage object, which is not always easy when the data for historical business dates can change in the table. To solve this problem, we systematized objects depending on the methods of loading and maintaining history. Then, for each type, the correct predicate for Sqoop and the method of loading into the receiver were determined. Finally, they wrote instructions for developers of new objects.
Sqoop is a very high-quality tool, but it does not work absolutely reliably in all cases and combinations of systems. The Teradata connector did not work optimally on our volumes. We took advantage of the openness of the Sqoop code and made changes to the connector libraries. The stability of the connection when moving data has increased.
For some reason, when Sqoop is addressed to Teradata, predicates are not quite correctly converted into WHERE conditions. Because of this, Sqoop sometimes tries to pull out a huge table and filter it later. We did not manage to patch the connector here, but we found another way out: we forcibly create a temporary table with a predicate for each paged object and ask Sqoop to overflow it.
All MPP, and Teradata in particular, have a peculiarity related to the parallel storage of data and the execution of instructions. If this feature is not taken into account, then it may turn out that one logical node of the cluster will take over all the work, due to which the execution of the query will become much slower, since it is 100-200 times. Of course, we could not allow this, so we wrote a special engine that uses ETL-metadata of the QCD tables and selects the optimal degree of parallelization of the Sqoop tasks.
Historicity in the repository is a delicate matter, especially if you use SCD2, while UPDATE and DELETE are not supported in Impala. Of course, we want the historical tables in the Data Research Platform to look exactly the same as in Teradata. This can be achieved by combining the incremental acquisition via Sqoop, the allocation of updatable business keys and the deletion of partitions in Impala. To prevent this fanciful logic from being written to every developer, we packed it into a special library (on our ETL slang “loader”).
Finally - a question with data types. Impala treats type conversion fairly freely, so we encountered some difficulties only in the TIMESTAMP and CHAR / VARCHAR types. For date-time, we decided to store data in Impala in text (STRING) format YYYY-MM-DD HH: MM: SS. This approach, as it turned out, quite allows you to use date and time transformation functions. For string data of a given length, it turned out that storing in the STRING format in Impala is not inferior to them, so we also used it.
Usually, to organize Data Lake, data sources are copied in semi-structured formats into a special stage area in Hadoop, after which the Hive or Impala tools set the de-serialization scheme for this data for use in SQL queries. We went the same way. It is important to note that not everything and not always makes sense to drag into the data warehouse, since the development of processes for copying files and installing a scheme is much cheaper than loading business attributes into the QCD model using ETL processes. When it is still not clear to what extent, for how long, and how often the source data is needed, Data Lake in the described approach is a simple and cheap solution. Now we regularly load into Data Lake primarily sources that generate user events: application analysis data,
Analyst Toolkit
We have not forgotten about another goal of the whole project - to enable analysts to use all this wealth. Here are the basic principles that guided us here:
- Convenience of the tool in use and support
- Applicability in Data Science tasks
- Maximum use of Hadoop cluster computing resources, not application servers or researcher’s computers
And on what stopped:
- Python + Anaconda. IPython / Jupyter is used as a medium.
- R + Shiny. The researcher works in the desktop or web version of R Studio, Shiny is used to develop web applications that are designed to use algorithms developed in R.
- Spark. The interfaces for Python (pyspark) and R, configured in the development environments mentioned in the previous paragraphs, are used to work with data. Both interfaces allow you to use the Spark ML library, which makes it possible to train ML models on a Hadoop / Spark cluster.
- Data in Impala is accessible through Hue, Spark and from development environments using standard ODBC interface and special libraries like implyr
Data Lake currently contains about 100 TB of data from retail storage plus about 50 TB from a number of OLTP sources. The lake is updated daily in incremental mode. In the future, we are going to increase user convenience, bring ELT-load to Impala, increase the number of sources loaded into Data Lake, and expand the possibilities for advanced analytics.
In conclusion, I would like to give some general advice to colleagues who are just starting their way in creating large repositories:
- Use best practices. If we didn’t have an ETL subsystem, metadata, versioned storage, and a clear architecture, we would not have mastered this task. Best practices pay for themselves, although not immediately.
- Remember the amount of data. Big data can create technical difficulties in completely unexpected places.
- Watch out for new technologies. New solutions appear often, not all of them are useful, but real pearls are sometimes found.
- Experiment more. Do not trust only the marketing descriptions of solutions - try it yourself.
By the way, you can read about how our analysts used machine learning and bank data to work with credit risks in a separate post .