Optimizing MySQL Queries with Neor Profile SQL
Any programmer creating loaded projects with thousands of users has ever wondered how he can improve SQL queries and save many hundreds of dollars. The analysis process usually begins with profiling and debugging the application code. Next, the process of optimizing SQL queries takes place, for this you can use the built-in tools of the MySQL server. For example, logging MySQL to a file. But sooner or later you begin to understand that this is not convenient.
In a special free Neor Profile SQL profiler, optimization operations are a simple process for setting up your application and collecting SQL queries from it. The tool works on all widely used systems (Windows, Mac OS X and Linux). Supports MySQL and MariaDB.
Neor Profile SQL works as a kind of proxy and, therefore, you need a computer where you can open ports or on the network, depending on the requirements. Your application only needs to change the standard MySQL 3306 port to the installed one, usually 4040. The rest is self-explanatory, the interface is easy to use.
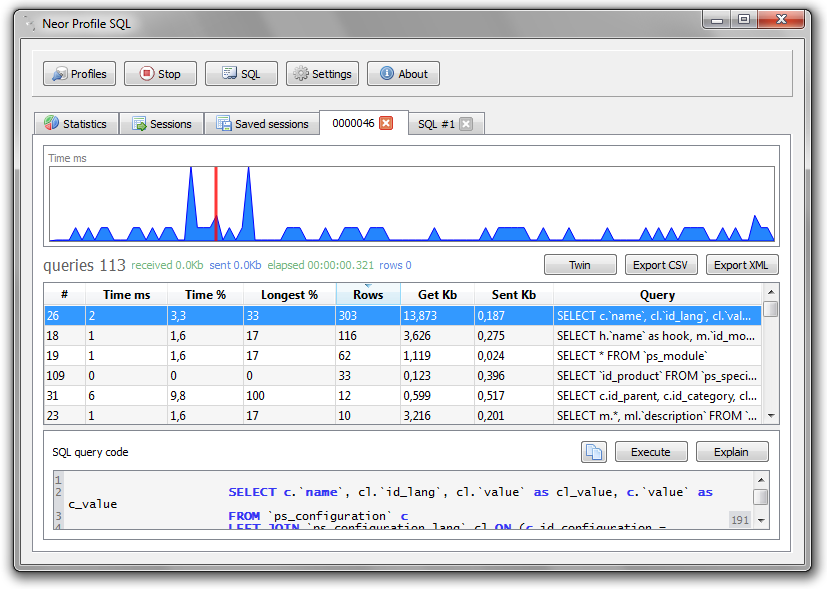
In addition, the main functionality of the product should be added:
- Counting of all queries with details on time, code and size
- General statistics of rows received and sent to the DBMS
- Search for slow queries
- Saving a session for subsequent comparison of results
- Built-in Explain command for any query
- The program is free
In a special free Neor Profile SQL profiler, optimization operations are a simple process for setting up your application and collecting SQL queries from it. The tool works on all widely used systems (Windows, Mac OS X and Linux). Supports MySQL and MariaDB.
Neor Profile SQL works as a kind of proxy and, therefore, you need a computer where you can open ports or on the network, depending on the requirements. Your application only needs to change the standard MySQL 3306 port to the installed one, usually 4040. The rest is self-explanatory, the interface is easy to use.
In addition, the main functionality of the product should be added:
- Counting of all queries with details on time, code and size
- General statistics of rows received and sent to the DBMS
- Search for slow queries
- Saving a session for subsequent comparison of results
- Built-in Explain command for any query
- The program is free