Funnel-based attribution for SaaS B2B businesses - as we considered the value of all marketing efforts
I want to share how we solved the problem with evaluating the effectiveness of marketing and eventually developed our own attribution model.
Attribution is how conversions and the value of these conversions are distributed between different traffic sources. For example, Google Analytics uses the default attribution model for the last indirect click by default. That is, 100% of the value will be assigned to the last channel in the chain of interactions that was before the direct transition. The disadvantage of this model is that we don’t know how big the role of other channels is - if we refuse them, then with what probability will the purchase still happen?
Our company is a typical representative of SaaS for B2B. That is, trial, monthly subscription, several tariffs. In such businesses, the funnel, which the user follows, is non-linear, with many steps that cannot be traced on the site. For example, demo, personal letters, calls, meetings, conferences. Part of the tasks on this list closes the sales department, some - marketing or customer support and it is important to evaluate the contribution of each of them. We have identified five main areas of responsibility:
It was necessary to understand how much profit each department brings, what it is worth to allocate more time and money, and what to refuse. For this you need to evaluate the effectiveness of the effort. By efforts we call absolutely all actions aimed at generating income: the placement of contextual advertising, webinars, meetings with clients, etc.
B2C projects have an obvious answer to this question. If the business is transactional, then the income from each transaction is attributed. If non-transactional - the number of conversions.
Deciding what to attribute, we considered several options:
This option was refused, because it is not suitable for a subscription service, which is important to consider not only the first payment, but all subsequent ones. In addition, efforts to attract customers (first payments) and to retain customers (recurring payments) are areas of responsibility of different teams that we want to evaluate separately.
These options are better, but LTV becomes reliably known only after the client has stopped using the service. And the predicted LTV is an unstable and not quite accurate indicator, it strongly depends on the size of the company and on what tariff plan the customer chooses. Therefore, we stopped at the third option.
We take the predicted LTV and subtract from it the values of payments already received. For example, if the projected LTV of a client is $ 1000, he pays us $ 100 per month every month and has already paid 3 times, then the value of the first payment will be $ 700, that is $ 1000 - (3x $ 100). After 6 months, for the same client, $ 400 will be attributed to the first payment, i.e. $ 1000 - (6x $ 100).
An important test for any attribution model: the total attributed income must be equal to the income that the business actually received .
For example, associated conversions or the simultaneous use of attribution models for the first and last clicks suffer from the following disadvantage: the same income is attributed several times. Therefore, before the assessment, it was important for us to combine absolutely all the efforts of the business and to attribute real income to them.
It would be wrong to make separate models that distribute income between sales, then between marketing and so on. Because the head of the sales department can distribute income from attracted transactions among his employees, and the head of marketing - according to his. As a result, all the greats, only attributed again more than earned.
It was necessary to classify efforts within areas of responsibility, and for each of the zones to highlight all the events in the life of the client. The result was about forty events in five categories - these are examples of some of them:
Marketing : SMM, content marketing, webinars, paid advertising, email marketing, PR
Events : buying tickets, visiting the conference site
Sales: demo, personal letters, calls, meetings, chats
Product : Trial, Freemium, our other products
Customer support : personal letters, answers to customer requests, chats, meetings
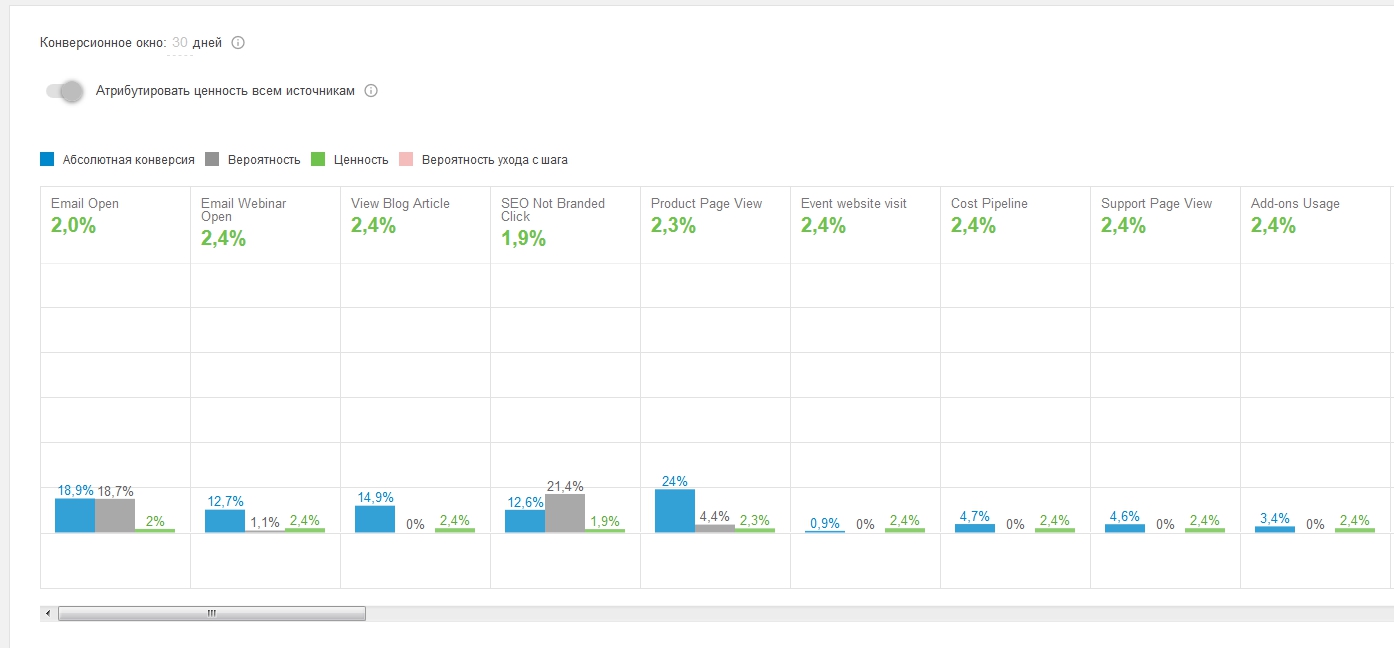
This is a fragment of a funnel in our attribution model:
Technically, the most difficult stage is to merge data, because the events that we have identified are collected not only in Google Analytics, but in a variety of systems: SalesForce, Intercom, Gmail, Calendar, conference sites.
We solved this question in the following way:
As for the logic of value distribution, we used our funnel-based attribution model. She fits well on the event chains. In short, we collect all possible options for passing the funnel. Then we consider the probabilities of all possible transitions between events (funnel steps) and distribute the value according to the principle: the harder it is to go, the more valuable is the effort that the user has made through it.
As a result, we formulated the answers to the question “How do the efforts made affect the current result?” In the form of several tables and dashboards.
To calculate ROI of all directions, except for value, we needed expenses. In expenses, we recorded salaries and additional expenses. For example, marketing is paid advertising, and the product has a technical infrastructure.
We also realized that it is necessary to take into account the projected income and expenses. The fact is that in B2B the sales cycle is very long - in many cases months pass from the moment of the first touch to conversion. Therefore, if you look at the value of the efforts of the past few months, it may seem that everything is bad. This impression is false, since a large proportion of these efforts contributed to conversions that have not yet happened.
Here are the reports that we got in the end. All numbers in the screenshots are given for example and are not real.
1. Revenues and expenses by area of responsibility and by months:
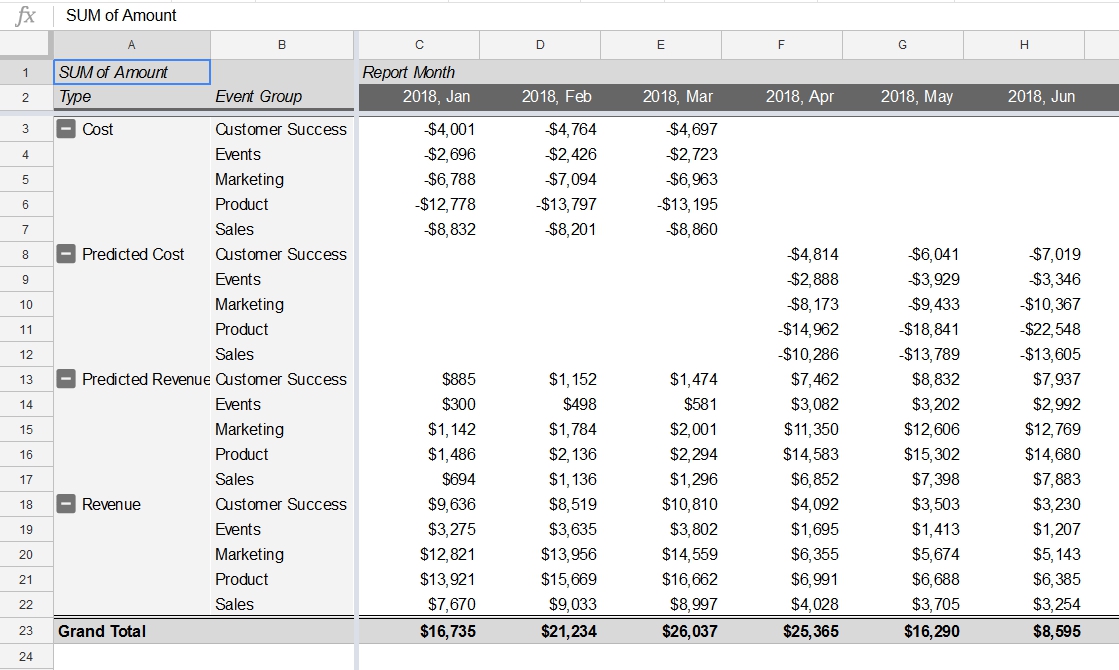
This summary table shows how expenses, planned expenses, income and projected income are distributed by area of responsibility and months. It is important for us to take into account the projected income, since the sales cycle is long - without this, the contribution of efforts aimed at attracting users to the top of the funnel would always be greatly underestimated.
This table helps to compare the projected income and the factual. The higher the funnel effort, the more projected income it brings.
2. ROI by area of responsibility:
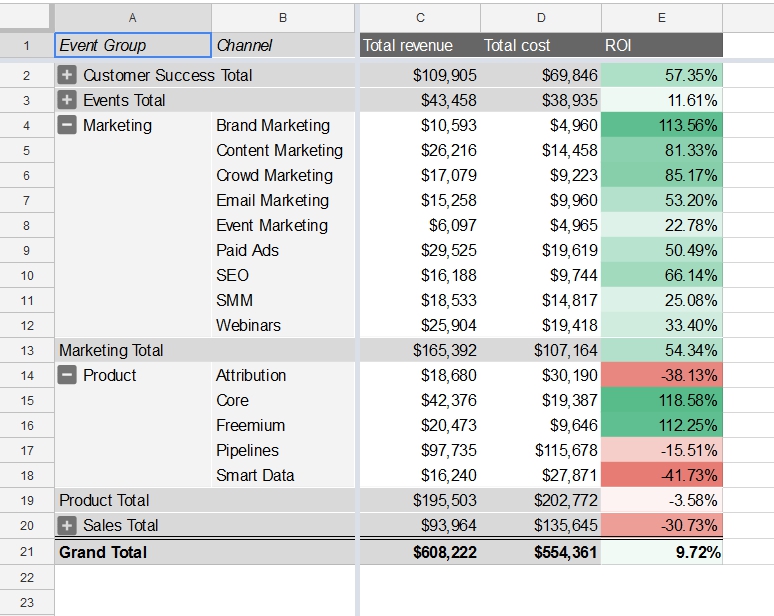
In another pivot table, built on the same data, we see, in addition to the total income and expenses, the ROI of each department. ROI shows the profitability of each direction given their tab across the entire sales funnel. In our example, the ROI of the sales force was negative. Given this, you can revise investments in this department.
These reports help to see how much we earn, putting some effort in marketing, sales, etc. This allows you to simulate the results depending on the budget. At the same time there are some limitations, for example, we can not spend less on the product.
3. Actual and predicted value of the effort:
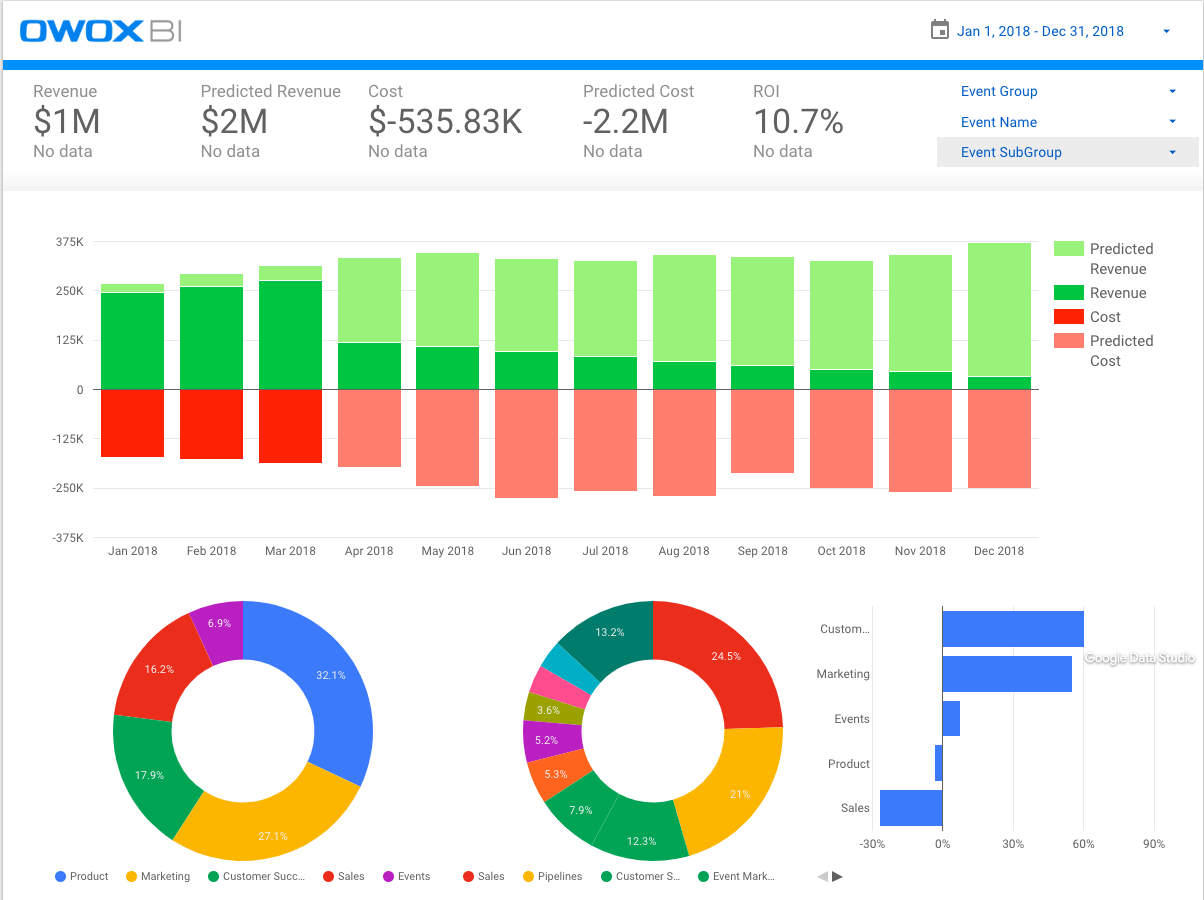
This dashboard collects information from the previous tables. All key metrics are visible from it: income, projected income, expenses, planned expenses and ROI. The graph above shows the same metrics (except for ROI) by month. The pie charts show the distribution of income by area of responsibility. The bar graph makes it clear how ROI is distributed across areas of responsibility.
Please note that in each of the following months, the share of the projected income (light green in the upper graph) is larger, but over time, the data are refined and the larger share will be taken by the actual income.
Attribution is how conversions and the value of these conversions are distributed between different traffic sources. For example, Google Analytics uses the default attribution model for the last indirect click by default. That is, 100% of the value will be assigned to the last channel in the chain of interactions that was before the direct transition. The disadvantage of this model is that we don’t know how big the role of other channels is - if we refuse them, then with what probability will the purchase still happen?
Our company is a typical representative of SaaS for B2B. That is, trial, monthly subscription, several tariffs. In such businesses, the funnel, which the user follows, is non-linear, with many steps that cannot be traced on the site. For example, demo, personal letters, calls, meetings, conferences. Part of the tasks on this list closes the sales department, some - marketing or customer support and it is important to evaluate the contribution of each of them. We have identified five main areas of responsibility:
- Marketing
- activity
- Sales
- Customer support (Customer success and Support)
- Product development
It was necessary to understand how much profit each department brings, what it is worth to allocate more time and money, and what to refuse. For this you need to evaluate the effectiveness of the effort. By efforts we call absolutely all actions aimed at generating income: the placement of contextual advertising, webinars, meetings with clients, etc.
What to attribute?
B2C projects have an obvious answer to this question. If the business is transactional, then the income from each transaction is attributed. If non-transactional - the number of conversions.
Deciding what to attribute, we considered several options:
First payment
This option was refused, because it is not suitable for a subscription service, which is important to consider not only the first payment, but all subsequent ones. In addition, efforts to attract customers (first payments) and to retain customers (recurring payments) are areas of responsibility of different teams that we want to evaluate separately.
LTV or projected LTV
These options are better, but LTV becomes reliably known only after the client has stopped using the service. And the predicted LTV is an unstable and not quite accurate indicator, it strongly depends on the size of the company and on what tariff plan the customer chooses. Therefore, we stopped at the third option.
Predicted LTV minus payments received over time
We take the predicted LTV and subtract from it the values of payments already received. For example, if the projected LTV of a client is $ 1000, he pays us $ 100 per month every month and has already paid 3 times, then the value of the first payment will be $ 700, that is $ 1000 - (3x $ 100). After 6 months, for the same client, $ 400 will be attributed to the first payment, i.e. $ 1000 - (6x $ 100).
What and how to attribute?
An important test for any attribution model: the total attributed income must be equal to the income that the business actually received .
For example, associated conversions or the simultaneous use of attribution models for the first and last clicks suffer from the following disadvantage: the same income is attributed several times. Therefore, before the assessment, it was important for us to combine absolutely all the efforts of the business and to attribute real income to them.
It would be wrong to make separate models that distribute income between sales, then between marketing and so on. Because the head of the sales department can distribute income from attracted transactions among his employees, and the head of marketing - according to his. As a result, all the greats, only attributed again more than earned.
It was necessary to classify efforts within areas of responsibility, and for each of the zones to highlight all the events in the life of the client. The result was about forty events in five categories - these are examples of some of them:
Marketing : SMM, content marketing, webinars, paid advertising, email marketing, PR
Events : buying tickets, visiting the conference site
Sales: demo, personal letters, calls, meetings, chats
Product : Trial, Freemium, our other products
Customer support : personal letters, answers to customer requests, chats, meetings
This is a fragment of a funnel in our attribution model:
Technically, the most difficult stage is to merge data, because the events that we have identified are collected not only in Google Analytics, but in a variety of systems: SalesForce, Intercom, Gmail, Calendar, conference sites.
We solved this question in the following way:
- We have already collected data from all of these systems into a single Google BigQuery repository.
- We have an intersite cookie with which we can track the intersection of the audience between different sites — product pages, marketing pages, conference sites — even if there was no direct transition from one site to another.
- It is possible to analyze events at the project level (Account based vs User based). In addition to the User ID, we track the Project ID and collect successive chains of events within the project. Because in the B2B business it often happens that one user starts moving along the funnel, then another connects, and then the third one comes and pays.
As for the logic of value distribution, we used our funnel-based attribution model. She fits well on the event chains. In short, we collect all possible options for passing the funnel. Then we consider the probabilities of all possible transitions between events (funnel steps) and distribute the value according to the principle: the harder it is to go, the more valuable is the effort that the user has made through it.
What is the result
As a result, we formulated the answers to the question “How do the efforts made affect the current result?” In the form of several tables and dashboards.
To calculate ROI of all directions, except for value, we needed expenses. In expenses, we recorded salaries and additional expenses. For example, marketing is paid advertising, and the product has a technical infrastructure.
We also realized that it is necessary to take into account the projected income and expenses. The fact is that in B2B the sales cycle is very long - in many cases months pass from the moment of the first touch to conversion. Therefore, if you look at the value of the efforts of the past few months, it may seem that everything is bad. This impression is false, since a large proportion of these efforts contributed to conversions that have not yet happened.
Here are the reports that we got in the end. All numbers in the screenshots are given for example and are not real.
1. Revenues and expenses by area of responsibility and by months:
This summary table shows how expenses, planned expenses, income and projected income are distributed by area of responsibility and months. It is important for us to take into account the projected income, since the sales cycle is long - without this, the contribution of efforts aimed at attracting users to the top of the funnel would always be greatly underestimated.
This table helps to compare the projected income and the factual. The higher the funnel effort, the more projected income it brings.
2. ROI by area of responsibility:
In another pivot table, built on the same data, we see, in addition to the total income and expenses, the ROI of each department. ROI shows the profitability of each direction given their tab across the entire sales funnel. In our example, the ROI of the sales force was negative. Given this, you can revise investments in this department.
These reports help to see how much we earn, putting some effort in marketing, sales, etc. This allows you to simulate the results depending on the budget. At the same time there are some limitations, for example, we can not spend less on the product.
3. Actual and predicted value of the effort:
This dashboard collects information from the previous tables. All key metrics are visible from it: income, projected income, expenses, planned expenses and ROI. The graph above shows the same metrics (except for ROI) by month. The pie charts show the distribution of income by area of responsibility. The bar graph makes it clear how ROI is distributed across areas of responsibility.
Please note that in each of the following months, the share of the projected income (light green in the upper graph) is larger, but over time, the data are refined and the larger share will be taken by the actual income.
Summary
- We received one attribution model, which assesses the effectiveness of all business efforts: marketing, sales, product, events, and customer success. This is important because if we evaluate each direction separately (only marketing or only sales), then the income is attributed more than we actually get. In this case, one model allows you to see both the high-level picture and the details for each department.
- We have been convinced that only measurable can be evaluated. For example, in the first versions of our model, some sales force efforts that were not tracked were underestimated. As a result, we digitized most of the actions of this department: all letters to customers, meetings and convened.
- We concluded that due to the long sales cycle and monthly payment, it is important for us to take into account the projected income. Because the current actions will lead to the result only after a while. We spend a lot of effort on the conversion of the first payment, but then the clients stay with us for a long time.
- After evaluating the effectiveness of departments, it is important to take into account the capacity of the channels in order to understand where to continue to invest money and time, and where it is not worth it. If one of the directions turns out to be profitable, you need to ask yourself how much it scales, that is, how much the capacity of this channel has been exhausted. In our case, just as in the classic assessment of marketing efforts, there is a point after which an increase in the expenditure on a channel will cease to give additional income and will only lead to an increase in the cost of this channel.