How to measure success. Monitoring strategies and their relationship to business issues
Before answering the question “How to measure success?”, You need to understand what “success” means for you. For Dev and Ops, the definition of success is different. For Dev, a successful project is fully tested. For operation - monitoring. Testing and monitoring are needed, but tests never give 100% coverage of a problem, and the 200 response from HTTP is not enough to be sure that the system works well. Leon Fayer at RHS ++ defended the point that DevOps do not pay for the fact that all the monitoring metrics are in the green zone. Pay to ensure users are happy . If unhappy - the business loses money, and no one cares that everything is green.
Under a cat there are many examples from practice which prove this point of view. Let us analyze why business is understood, how to monitor success from a business point of view, and why it is necessary for simple developers.

About the speaker: Leon Fayer was born in a once-friendly republic, but grew up in the United States. I started programming very many years ago, and during that time I worked as a programmer, as a manager - who just did not work. He participated in startups - some were more successful, and some were not.
For many years, Leon has been working at OmniTI. This company specializes in developing scalable systems, so Leon has a unique opportunity to design and build systems for the most visited sites in the world - Wikipedia, National Geographic, White House, MTV, etc.

Before answering the question “How to measure success?”, You need to understand what “success” means for you. For each person the answer will be different.
If you are reading this article, most likely you are related to DevOps. Are you more dev than ops? Or, conversely, more Ops than Dev? For Dev and Ops, the definition of success is a little different: for Dev, this is, of course, testing.
Testing
For me, as a programmer, successful testing means that everything is in order, everything is fine, everything works - you can run in production. The problem is that I am also a cynic, and not a fan of testing as such. Not because it is difficult, and not because it is long - but because testing does not give what I want.

Understand me correctly, testing is a mandatory process , it should be included in any project, but it is clearly not enough to guarantee success .
There are many different test options:
- performance tests;
- user tests;
- automatic testing ...

How many testing methods do you use - 1, 2, 3, 5? And what, you do not wake up at night alerts? Does everything work in production?
The problem is that testing gives the illusion of success . It is predetermined: we know that the train should leave point A and go to point B, we are testing for this. There are options that we think through. If the train will fall off the wheel or run out of firewood, it will not be a surprise. But we are not testing, for example, train robbery. We can not test it, because we do not know that this option is possible.
There are a couple of problems, because of which testing is simply not enough. The first of these, of course, is a data problem . The fact that the task works locally, but for some reason does not work in production is a standard problem.
No matter how hard we try. No matter how many replications we do live —development and production will never be equal. Whether there will be another line in the database, whether there will be another extra query — there will always be something in production that we did not count on.
Wolfe + 585 - the longest surname in the world:
by Hubert Blaine
Wolfeschlegelsteinhausenbergerdorffwelchevoralternwaren-gewissenhaftschaferswessenschafewarenwohlgepflegeundsorgfaltigkeitbeschutzen-vorangreifendurchihrraubgierigfeindewelchevoralternzwolfhunderttausendjahres-vorandieerscheinenvonderersteerdemenschderraumschiffgenachtmittungsteinund-siebeniridiumelektrischmotorsgebrauchlichtalsseinursprungvonkraftgestartsein-langefahrthinzwischensternartigraumaufdersuchennachbarschaftdersternwelchege-habtbewohnbarplanetenkreisedrehensichundwohinderneuerassevonverstandig-menschlichkeitkonntefortpflanzenundsicherfreuenanlebenslanglichfreudeundruhe-mitnichteinfurchtvorangreifenvorandererintelligentgeschopfsvonhinzwischensternartigraum,
Sr. The
Few systems will survive if someone enters such a name into the form. I know at least 5 different points in which the whole system can fly.
Therefore, the second problem is a problem with users .

These are such interesting people who will break everything, everything. If there were no users, everything would be much easier, to be honest.
Even if your UI has one button, they will still find a method to break what we are doing.
The best example is World of Warcraft .

For those who do not know, this is an online game played by 10 million people. At one time there were quite legendary bugs. A corrupted blood bug is an ideal example of how users spoil everything.
As in any toy, new content, new ideas, new bosses constantly appeared in World of Warcraft. One of the new bosses put a curse on one of the 40 players in the group. The curse principle was like a time bomb - it slowly took the lives of everyone around. That is, it was necessary to run aside - there was a whole mechanic. And everything was fine, until at some point one of the players decided to teleport to the city during the battle ...

In the city there were thousands of people of all levels, the smallest too. Moreover, there were still non-player characters who were also infected with a curse. During the day the servers are empty. It was impossible to go anywhere else where there were other players. It became a plague in the literal sense of the word. I had to do a round restart of all servers in order to remove the curse and change the mechanics. And all because of one tester - I do not even know what to call it.
The third major problem is the problem with external dependency . We all came across this: The API you depend on suddenly stops working; or you stop controlling the API.
But there is still a bigger problem with this. External dependence can be not only direct, but also indirect. We all now use OpenSource. Each OpenSource product depends on some libraries that are also OpenSource and that someone else supports. When something breaks, it breaks not only in this small module, but also in everything that depends on it.
Probably the most ideal example of this was recently, about a year ago - this is the left - pad . This is the npm module on node.js, which puts spaces before the string (at the beginning of the line). We will not discuss why this module was made. But it turns out that it was included in a lot of popular modules. At some point, the author decided that he had enough, removed this module from npm, and flew 70% of the code written in node.js.
If you think this is an isolated case, you are mistaken.
There is also an is-odd module, which is still in npm. This module defines an even number or not.
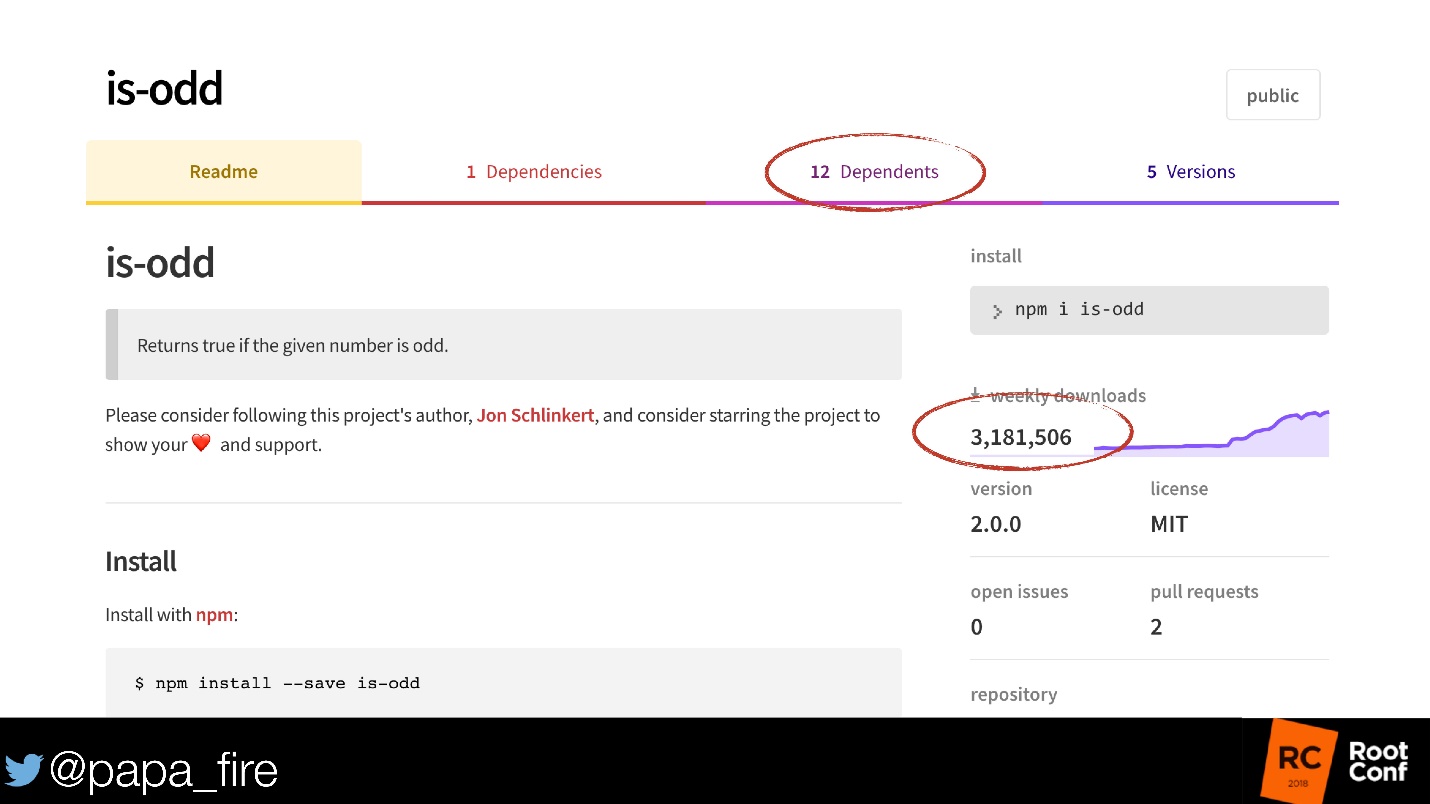
We will not discuss the fact that 3 million people do not know how to check even / odd. But there are 12 more modules that use it! And it is not known how many of these modules still use modules. If it seems to you that there is nothing to break in it - there are 5 versions!
Returning to our sheep - there are still many options:
- Short - sighted - we do not know what will happen in the future. Y2K is the perfect example. No one just thought that in 2000 everything written in Cobol would fly.
- The number of test options .
There is a good example again with World of Warcraft - they have many good examples on this topic.
Half a year after the game was released, appeals began to come in support that some players could not enter the same cave. It turned out that only one version of race and gender could not enter this cave - they were female tauren.
Why did it take 6 months to find this mistake - after all, millions of people are playing? Because tauren is a fictional race, a mixture of man and bull. A tauren woman is a talking cow. Nobody wanted to play a cow, so for 6 months no one reached the maximum level to go into the cave and find this bug. Accordingly, no one has tested it.
- Change in source data. We really do not know what will happen tomorrow.
In any case, there are few tests. But tests do not give 100% coverage. Therefore, testing does not guarantee success. This gradually brings us to the second part - Ops. Success for operation is monitoring .
Monitoring
There are many reasons why monitoring is needed:
- perfect code does not exist;
- systems become more complex;
- growing external dependence;
- anticipation -> response;
- ...
Monitoring is needed because everything changes. This is the main reason. And it is in production that everything changes constantly there, and we need to detect it.
What should monitor cover? - Everything! This is a short answer, but it must cover everything.

This is all a bit abstract. In fact, we all have a checklist that we monitor:
- infrastructure;
- Database;
- applications;
- integration points;
- request processing time;
- load;
- ...
There may be a million things. Many people collect hundreds, thousands and tens of thousands of metrics on their systems.
We will collect a lot of metrics for this:
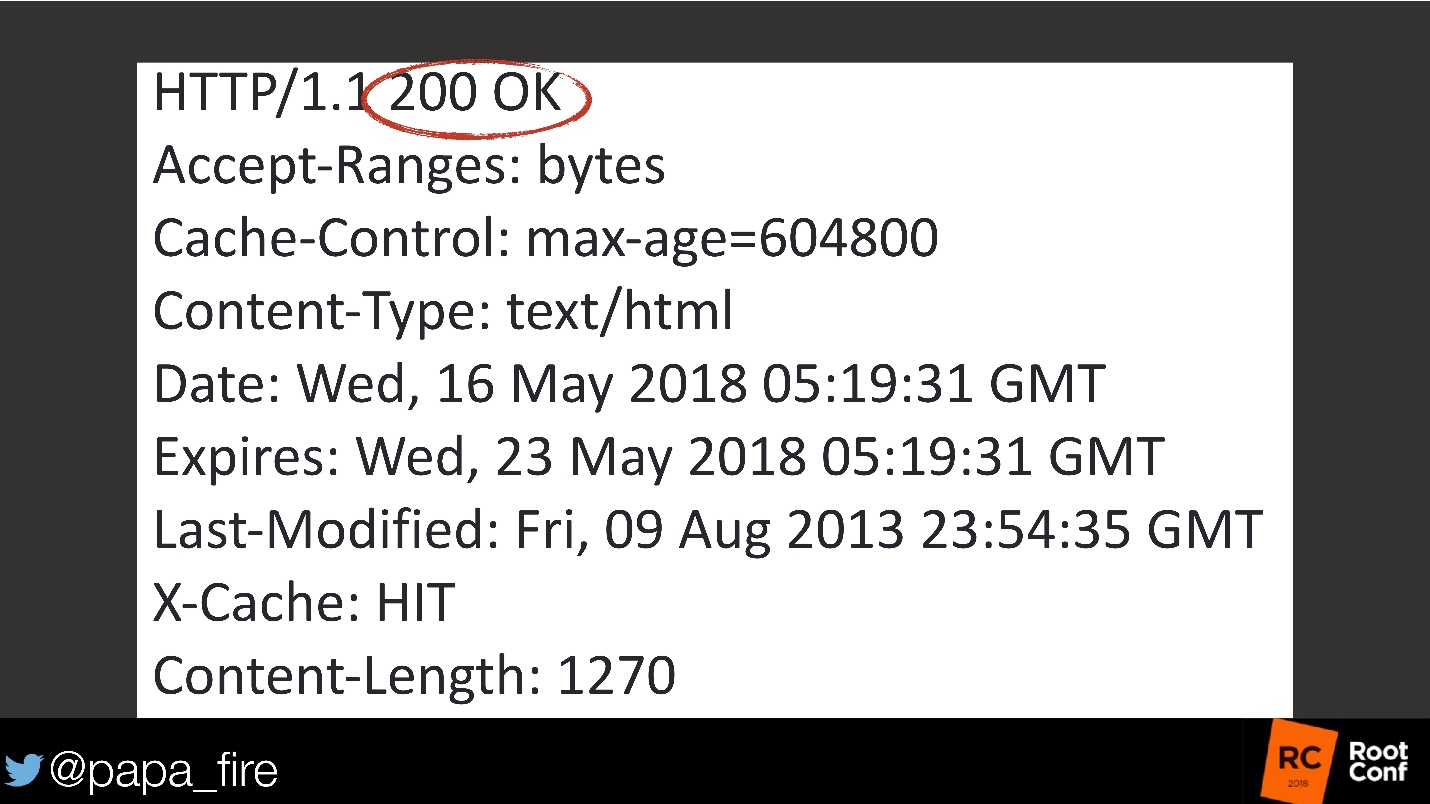
Of course, I am exaggerating, but all we need from the point of view of Ops is for HTTP to return 200 . This means that everything is fine with the site. Once the site is working, it means the databases are working, the applications are working - everything is in order. From the point of view of Ops, success is exactly that: all the graphics are in the green zone, everything works correctly - everything is fine!
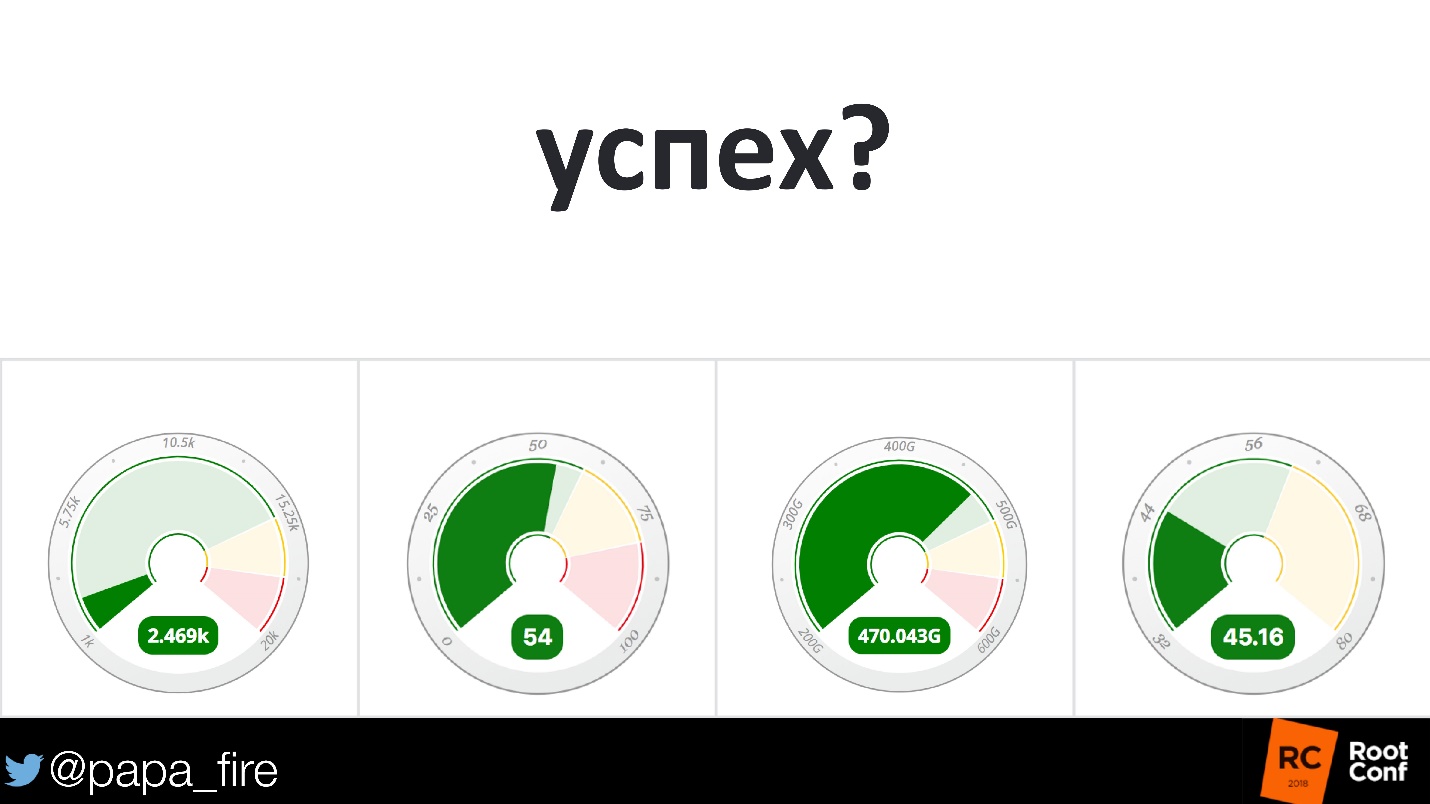
Everyone knows what Twitter is. They handle 500 million tweets per day — a crazy figure.

But they are also known for their mistakes. Errors are legendary in their complexity or ease - which side to look at.
They had a mistake: the site worked, the client could write a tweet, press a button, they said thanks, sent a tweet - and that’s it! He did not appear anywhere and simply disappeared, and monitoring showed that everything was in order. The site returns a 200 request - the API is running. And no tweets!
I have a favorite quote from a single customer. Within an hour I was fixing problems on three screens, and he was screaming why nothing was working. When I tried to explain what problems I was fixing, the person who typed with two fingers and did not understand how to use a computer said to me:
"As long as I continue to make money, I have *** that the servers are on fire."
In some ways, this is very correct, and the example of Twitter confirms this: all metrics showed that everything was in order from the point of view of developers, but from the point of view of the work of business, it was not at all in order.
To be honest, we are all to blame. Of course, the companies that produce monitoring products are mainly to blame. But we, too, because traditionally we collect system metrics. We are used to working with small systems - one, maybe two servers. If they work, then everything is in order.
Now we have slightly more than two servers, or even 10 servers, and simply measuring the health of a system or the health of a program is not enough. We have to track the work of something else.

Returning to the quote - I'm not paid to keep everything green. I get paid to make my users or my managers happy - someone must be happy with the result . If all users are dissatisfied, nobody cares that everything is green.
Business monitoring
We said that monitoring is needed because everything is changing. But when everything changes, changes affect the business: something is broken - the money has stopped coming, something has been fixed - the money has started to go again - a direct correlation. Or do not affect - but if we do not monitor the business, we do not know.
As a living example, the cache reading schedule is familiar to everyone.
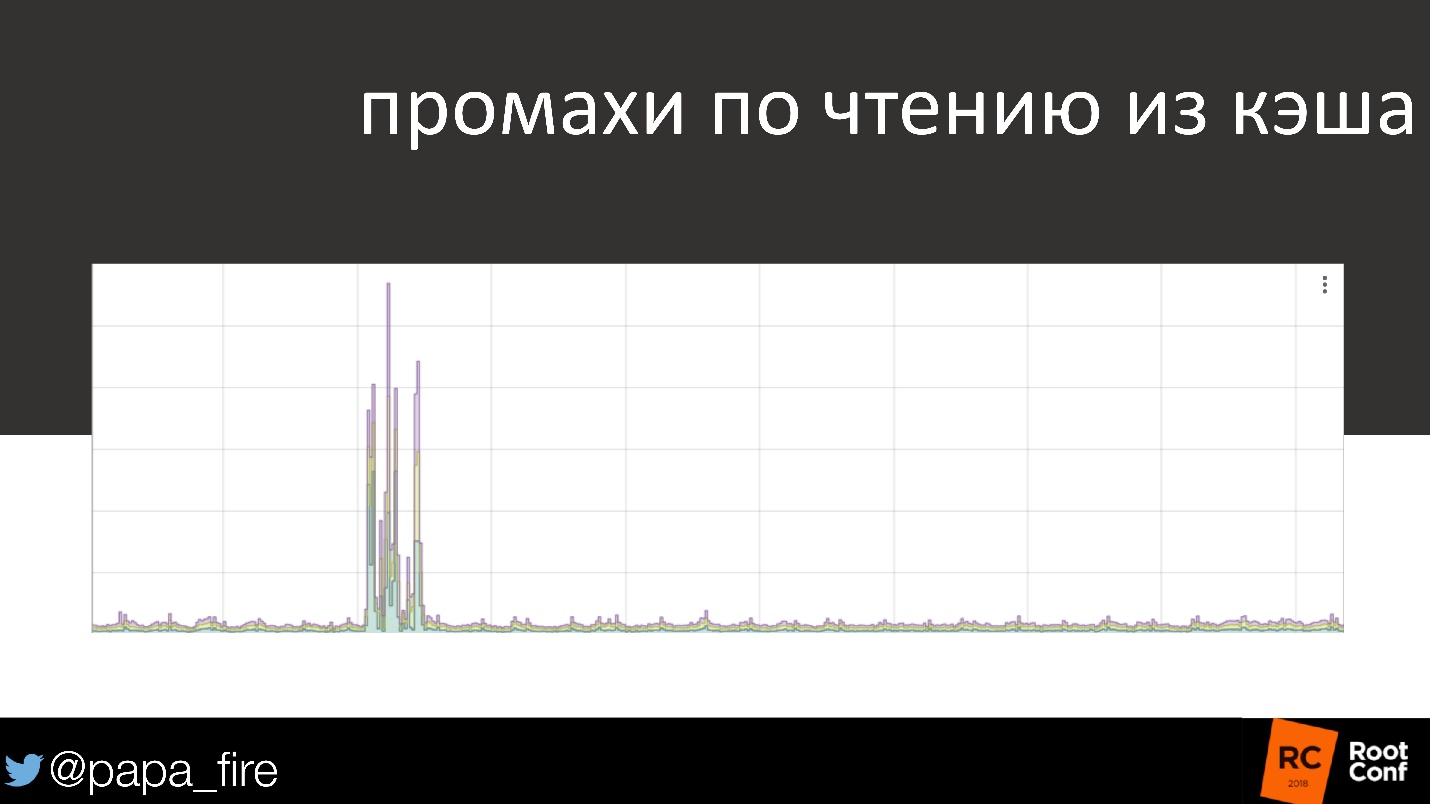
90% of the time everything is in order, almost all requests go to the cache. And suddenly something happened - and very serious. This is a problem that should wake up at 3 am someone who will solve it. But, if the download speed for users does not change, is this really a problem?
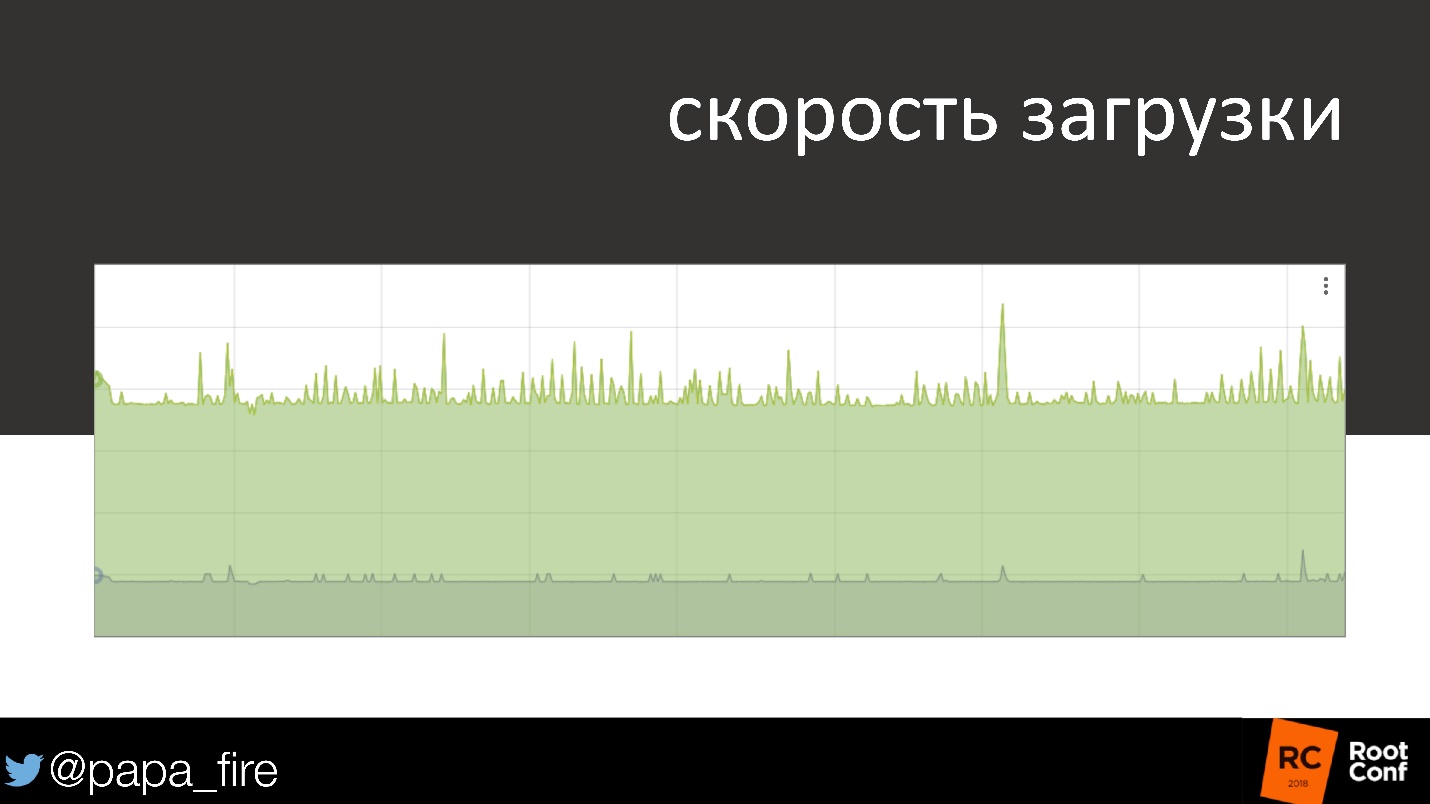
In English there is a term Observability - observability. These are: monitoring, logging, alerting. Therefore, the term monitoring is a bit. We want to monitor everything - collect system metrics on each node, if necessary. But we want to monitor exactly the business, because it worries everyone. This is an indicator of success.
To do this, we must:
1. Understand the problem - what exactly we need to monitor.
2. Determine the baseline - that is, is it enough that the user's download speed has not changed so that no one wakes up in the middle of the night when reading from the cache stopped working.
3. Correlate data is one of the most important factors. If marketing collects data on income, and you collect data on servers and cannot compare these two observations, then they have very little meaning.
I usually give a lot of examples. As far as absurd they would not look, they are all from my life, and I spent a lot of nerves on them.
Example: I had a client with 100 million users. It was an internet marketing company that sent a lot of e-mail and used A / B testing. For them, we collected 6 thousand metrics.
Everything, as always, began with a call. The phone rings - it means something has happened.
- We have problems. Something is not working.
- OK, what exactly is not working? What is it expressed in?
- We began to receive less income.
- and?
- Something does not work in the system.
- Not understood. If less income - talk to your sales department. Why are you calling me?
- No, I'm sure this something in the system does not work!
- Ok, let's see.
Thank God, we had a revenue metric, so we could look. The graph really shows that at some point their income fell by 15%. Given the number of users, this is quite significant.
Well, we must see. First of all, I check the download speed - normal.
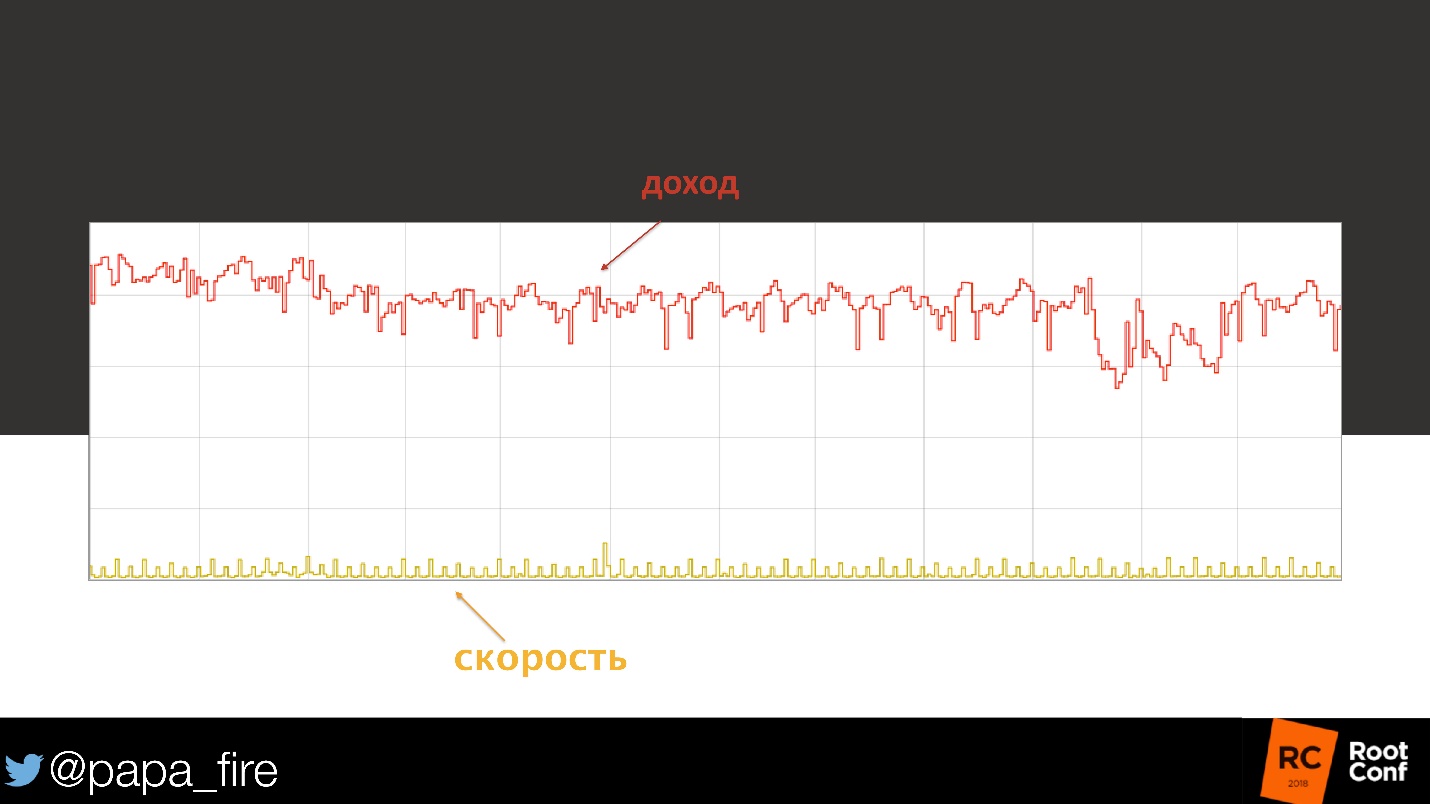
We looked at the load on the database - everything was reasonable, nothing seemed to change. Then we started to look at the cpu-load, on individual nodes, on caches.
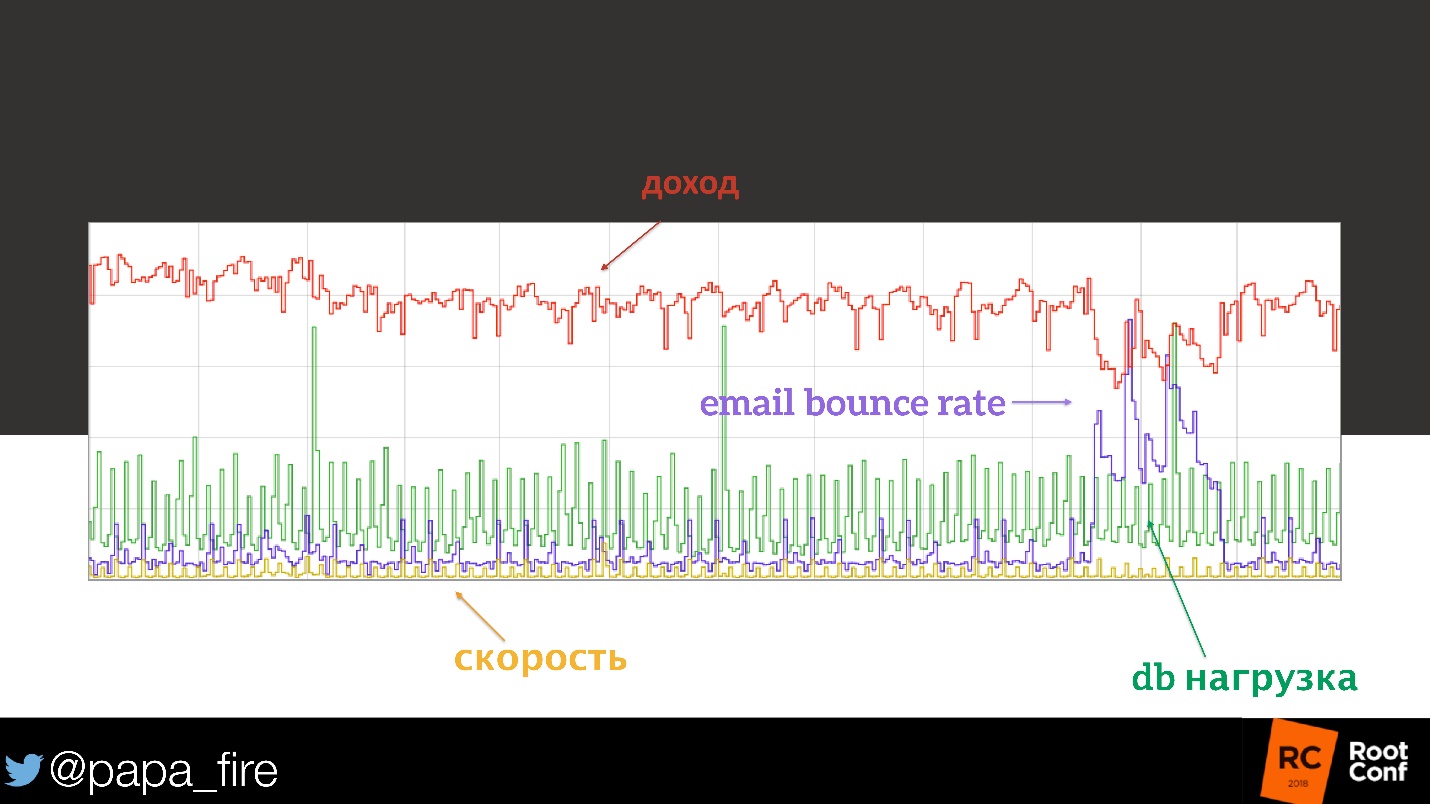
Everything was in order. Until we reached the metrics of the e-mail list. One of the big providers accidentally put their domain on the black-list. The percentage of their e-mail marketing has ceased to reach users, which means that fewer people: received letters, clicked on a button, went to the site and bought something.
Here is a correlation!
We are lucky that we had these metrics. If we didn’t have them, we would add them - this is a very simple answer.
The biggest mistake people make is they think that monitoring can be made at the end of the project. It's like a feature: make your project, put monitoring - and that's it, we are ready!
Instrumentation can never be completed. There are always problems that are unknown from the very beginning. As with testing, you cannot write tests and cover everything, because you do not know what “everything” is. We do not know how to predict the future and do not know how to predict business, therefore we don’t know what “everything” is.
An absolutely identical example of what I am talking about. It was the CEO who woke up in the morning at a conference in Paris, drank coffee, looked through his mail and income report, and called me with the same problem: income fell.
I remember it well, because he had 9 am, and I had 6 hours earlier, also on Saturday. I was just transported home from a birthday party - but that doesn't matter. So, at 3 am, I sit down at the computer, and we begin to go the same steps. That is, we look at the load on the system, on the registration number, on everything.
The only deviation from the norm that we found is the lower percentage of successful authorizations. That is, the number is the same, and the percentage is slightly lower. I know it could be spam, etc. But all the other technical metrics are absolutely normal. And we came to the point that already almost along the lines in the database went and tried to check - is there something that you can catch with the eye. Absolutely nothing!
We spent half a Sunday, on Monday, too, continued, but were already confident that the problem is not technical. Let them decide it themselves. And on Monday I am sitting at work and an employee from their accounting department calls me:
- Listen, can you quickly help me?
- What do you need?
- Can you remove the "American Express" badge from the site?
- Certainly can! Why then?
- You know, we are arguing with them here, and as long as we do not accept American
Express at all.
- I apologize to ask, and when did you stop taking them?
- Before the weekend, I think - on Friday or Saturday .
No one in their right mind would ever put a collection of metrics on the percentage of authorizations from a certain type of credit card! After this incident, we, of course, set.
Why am I telling this? You must first look at the business, because all these systemic problems were simply invisible. They did not wake anyone in the middle of the night, we did not see that these were problems. It is easy to notice a drop in income, and everything else needs to be tracked so that this data can be correlated with business data.

Success for business
For a business, success may be different, it depends on the goals. The most important thing is how to measure it? Traditionally, we measure system indicators, sometimes as engineers, forgetting that everything can be measured.
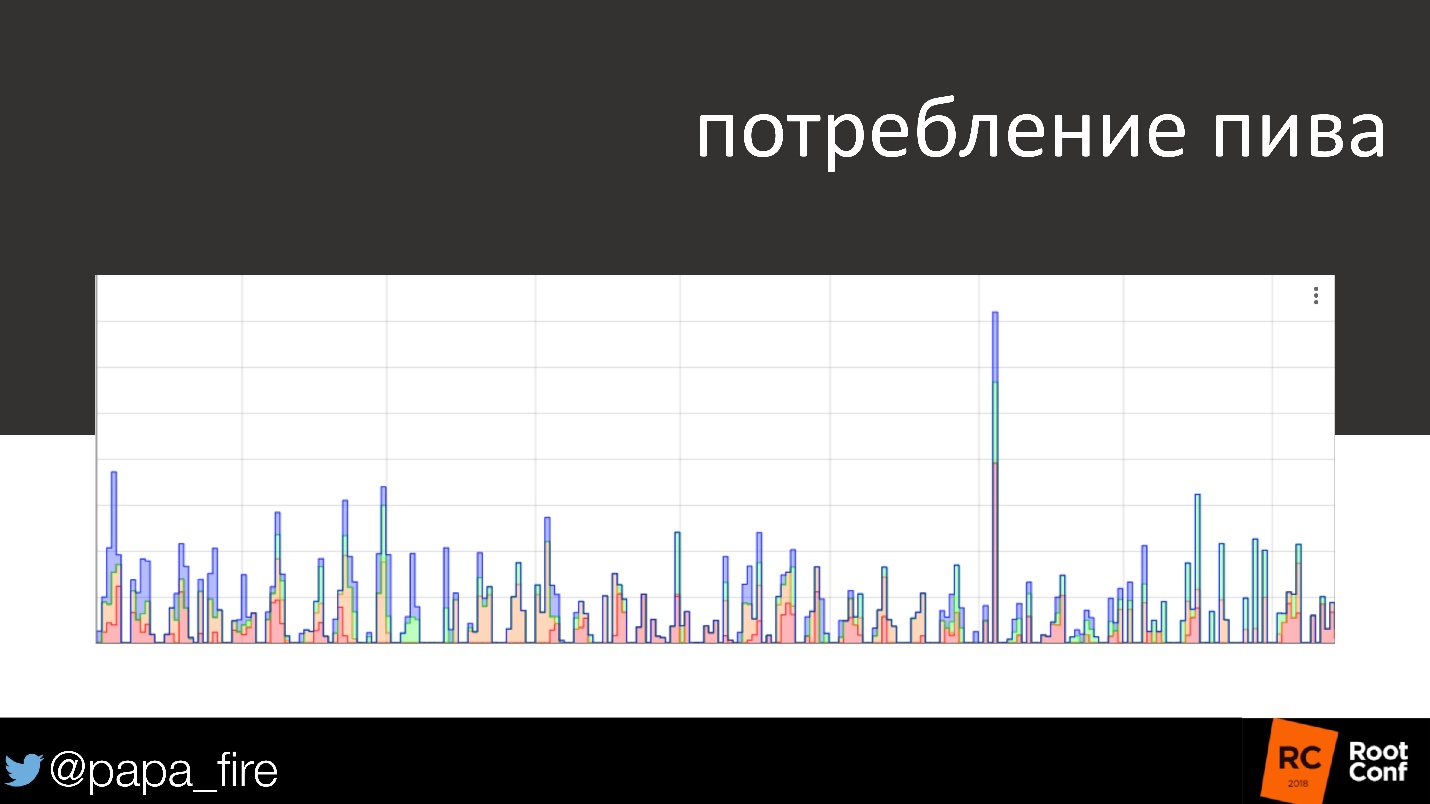
For example, you can measure your own alcoholism. By the way, I'm not joking. In our office there is a draft beer with four faucets. Since we are all engineers, my colleague decided to install the Raspberry Pi sensors to see how much beer we drink and what kind of beer.

It looks like a simple joke, but in fact it is convenient, because we see when the beer comes to an end and we need to replace the barrel. And in general, we can see when people drink, which beer they like best - dark, light, etc. By the way, the peak is my birthday.
Absolutely by chance we found another use for this.
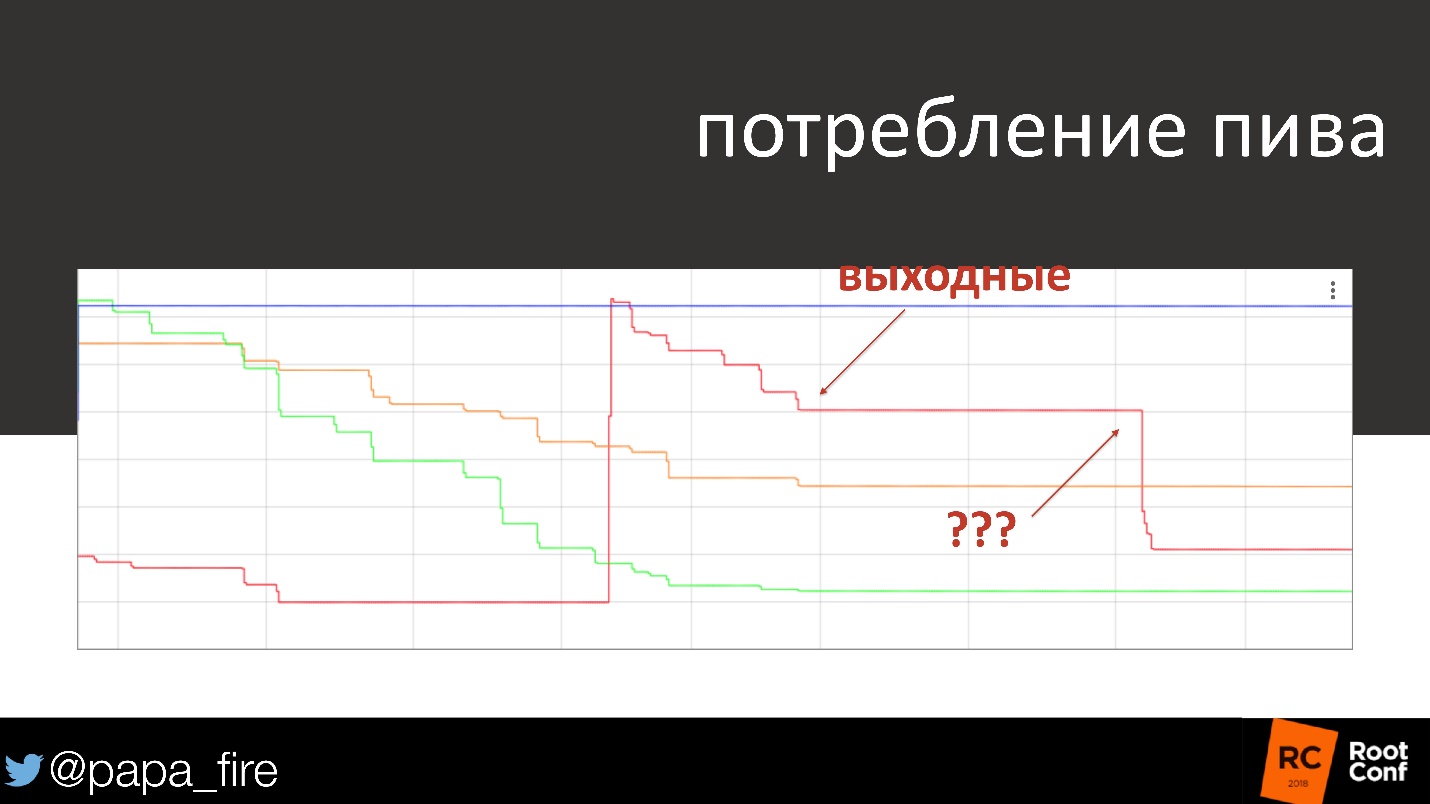
On the graph, beer consumption over several days and weekends. By the weekend, alcohol consumption is usually reduced, almost fading away. Once we arrive on Monday, look at the schedule and see that someone drank a quarter of a barrel of beer on Saturday. The graph shows the exact time within half an hour. It turned out that the cleaners who came on Saturday needed a hangover, so they were hung over.
A joke, but in the end they had serious problems, because it is generally not good to drink at work, and even someone else's beer!
In the end, any metrics can be helpful. Even this metric, which we collected purely for our own fan, turned out to be important in something else. But basically the really necessary metrics are reduced to money. Money is most important to business.
Typically, business success criteria are something that is ultimately related to money:
- profit;
- income;
- expenses;
- efficiency.
Business metrics:
- registration;
- purchases;
- ad views;
- conversion;
- return percentage;
- amount of beer drunk
All this has a cash equivalent. By the way, most likely, all these metrics are already collected in your company - either by sales or by marketing. So you don’t need to invent a wheel, you can simply take the existing metrics into your own system.
Everything must be considered in the context of the business. We talked about special metrics for business. Other technical metrics can also be considered in this context.
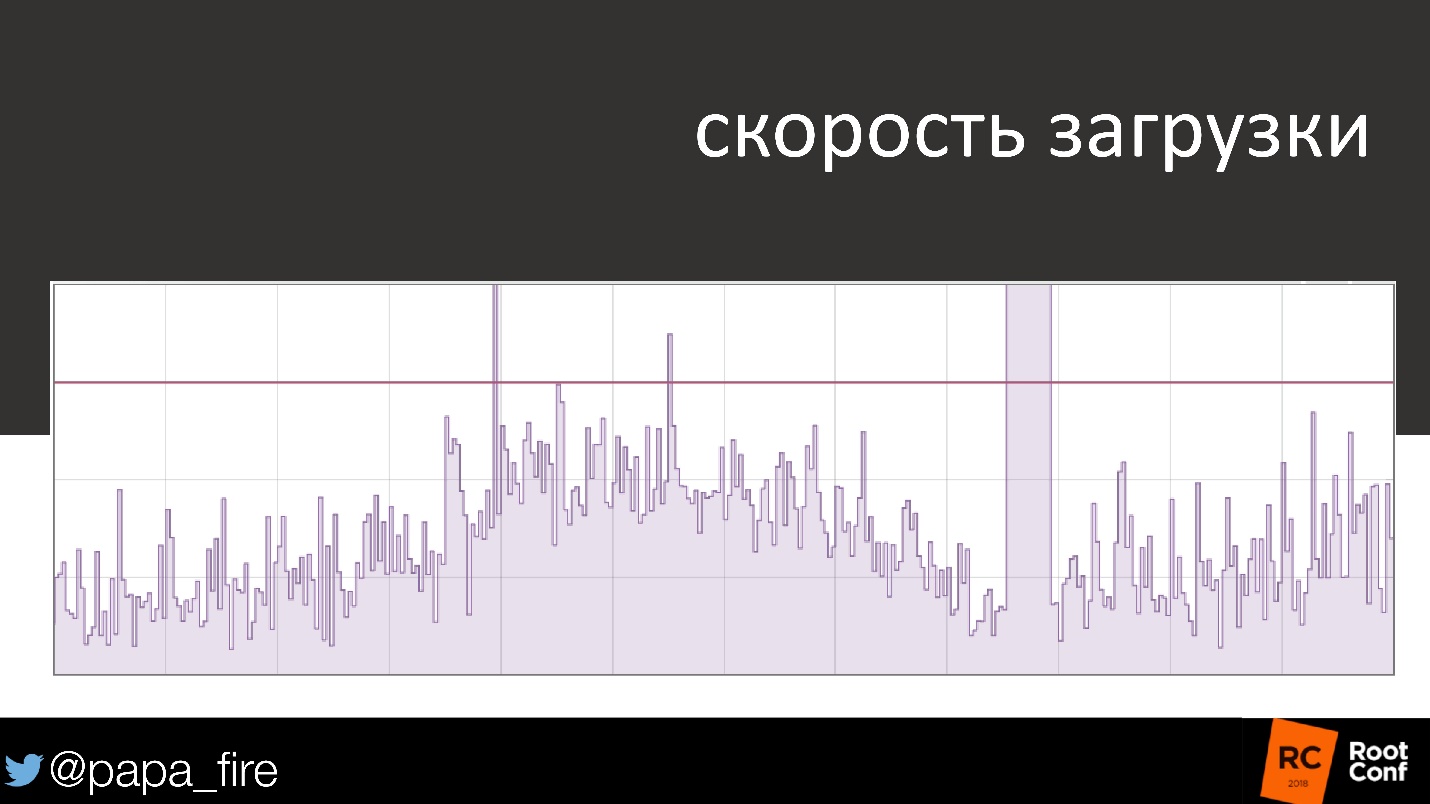
For example, the download speed is pretty standard. At first everything is in order, goes up - down, up - down, and suddenly a clear problem. It was repaired, and the graph returned to the standard form - the 99th percentile is below the threshold, the SLA is not violated.
If you take the same schedule and look at the number of users who have been affected, the problem immediately looks different.
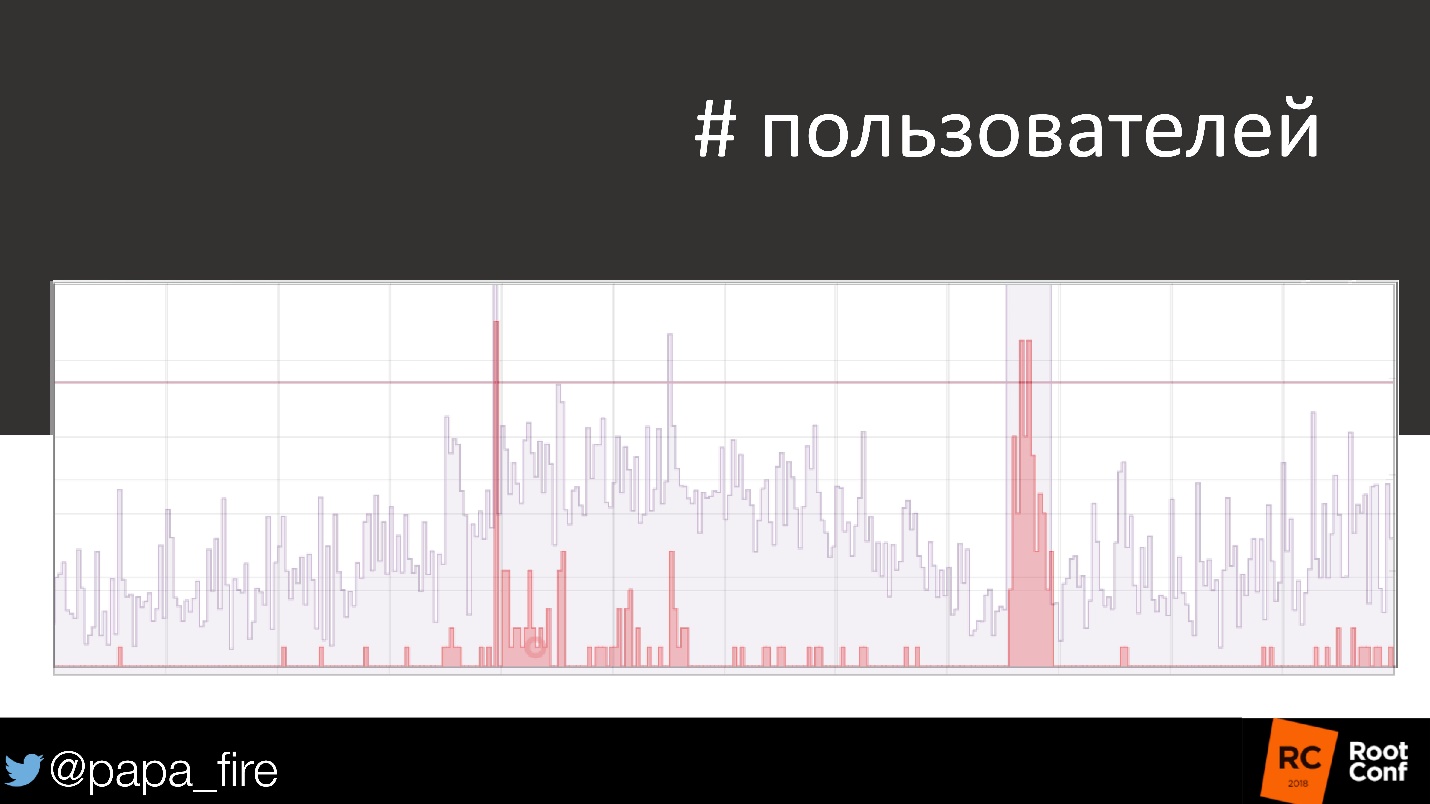
These users did not spend money, that is, they brought losses. Moreover, when no alerts came and it was considered that everything was in order, there were also problems. Here it can be seen much better than in the graphs of system metrics.
Every user is important. We forget this because we are looking at the average amount on a time interval. But each user carries a certain value. Marketing knows this very well. The amount that each user spends in the next 3 months, marketers know very well.
The average is evil. Not that it is not needed, it gives us information that is really necessary when we try to find a problem, but as a measurement it is not enough.
On the chart, the average download speed.
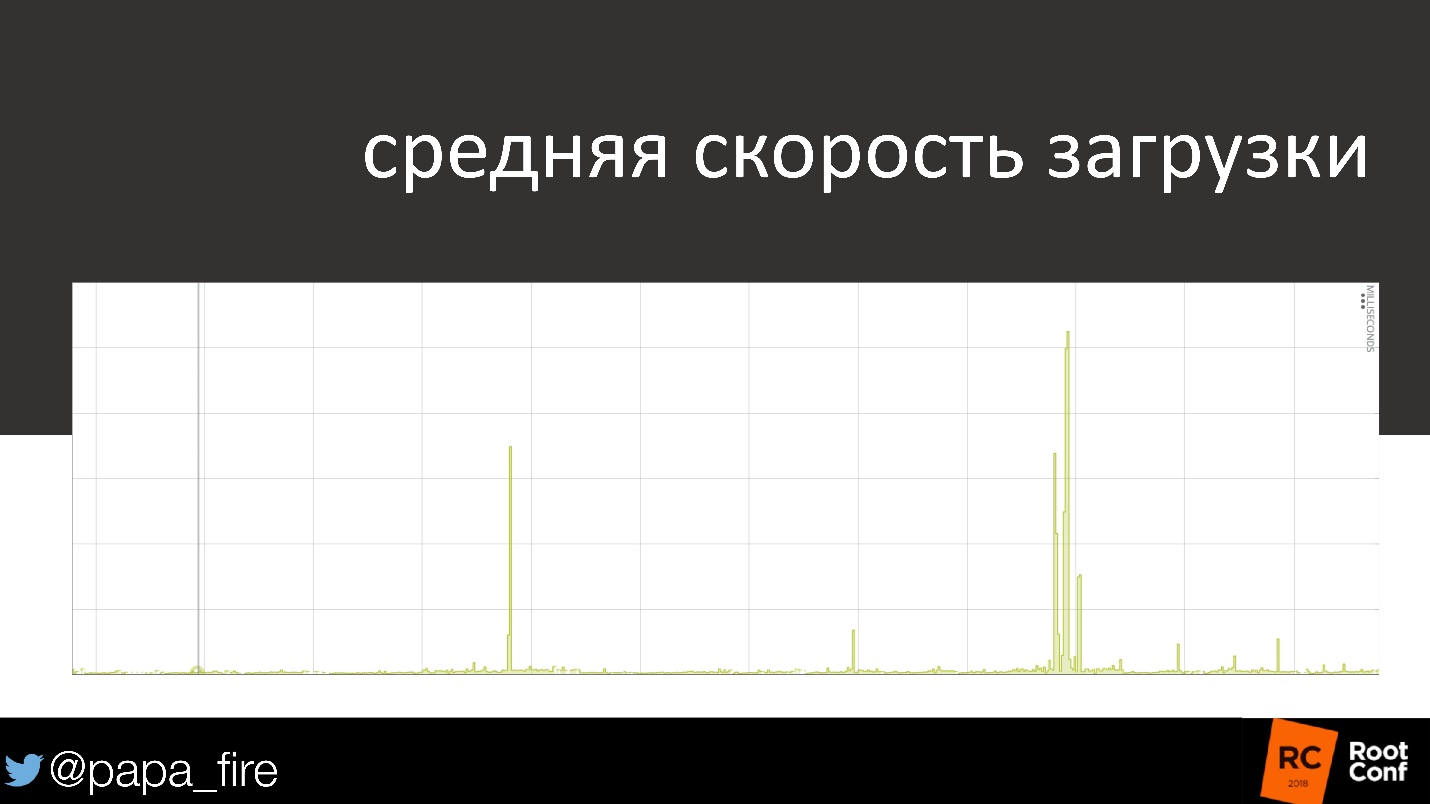
Again everything is standard: first everything is in order, then a small problem, and then a serious problem that someone solved.
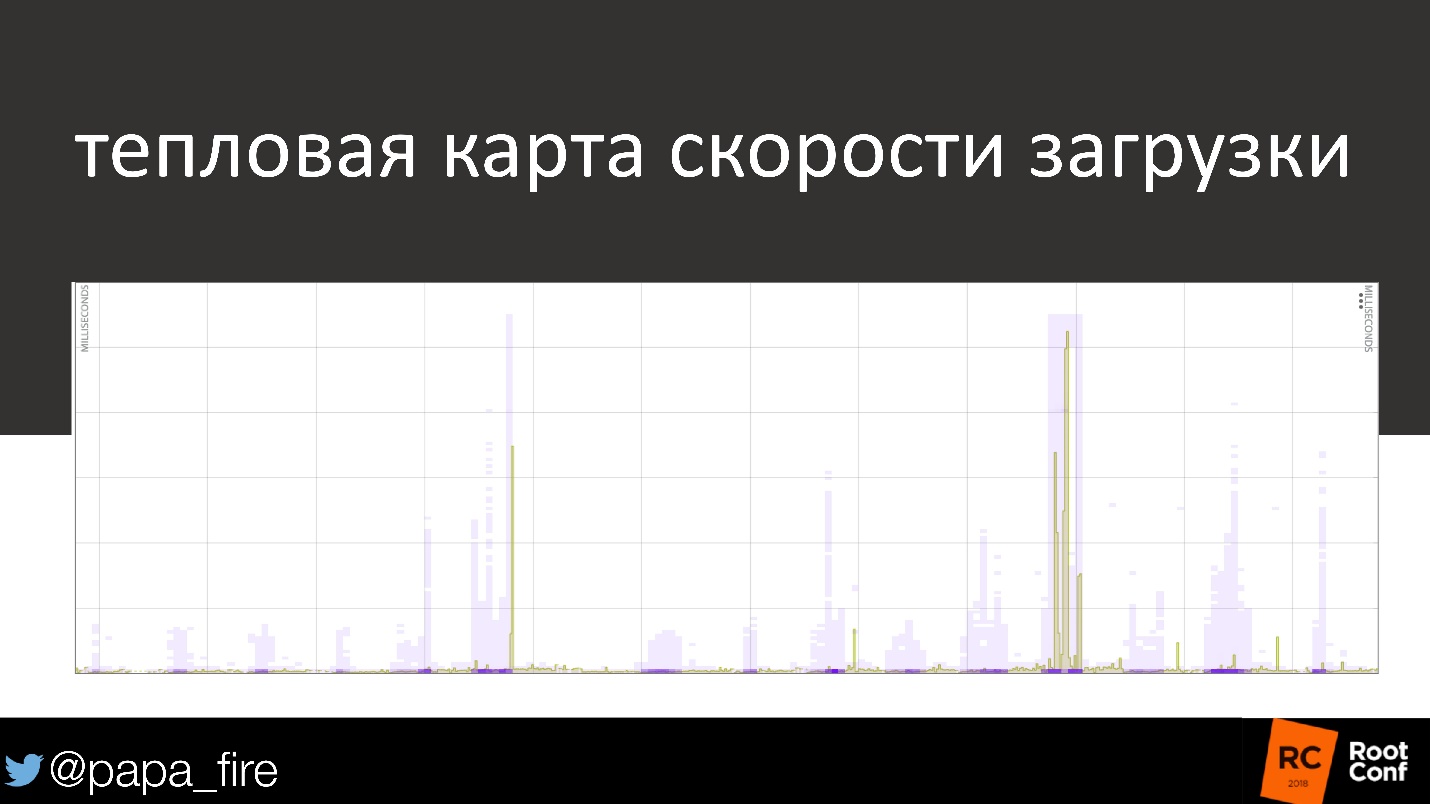
This is a heat map that applies to individual users every second. Where the graph of the average download speed shows that everything is in order, 50% of users actually fall into the “all right” category, but the rest either download more slowly or not at all.
How valuable is 1 second?
Now there are few systems with 1-2 requests per second. We work in systems of tens of thousands of requests per second. There are 10,000 different options out there that can go wrong. Most likely, there are 10,000 different users who may be affected in some way.
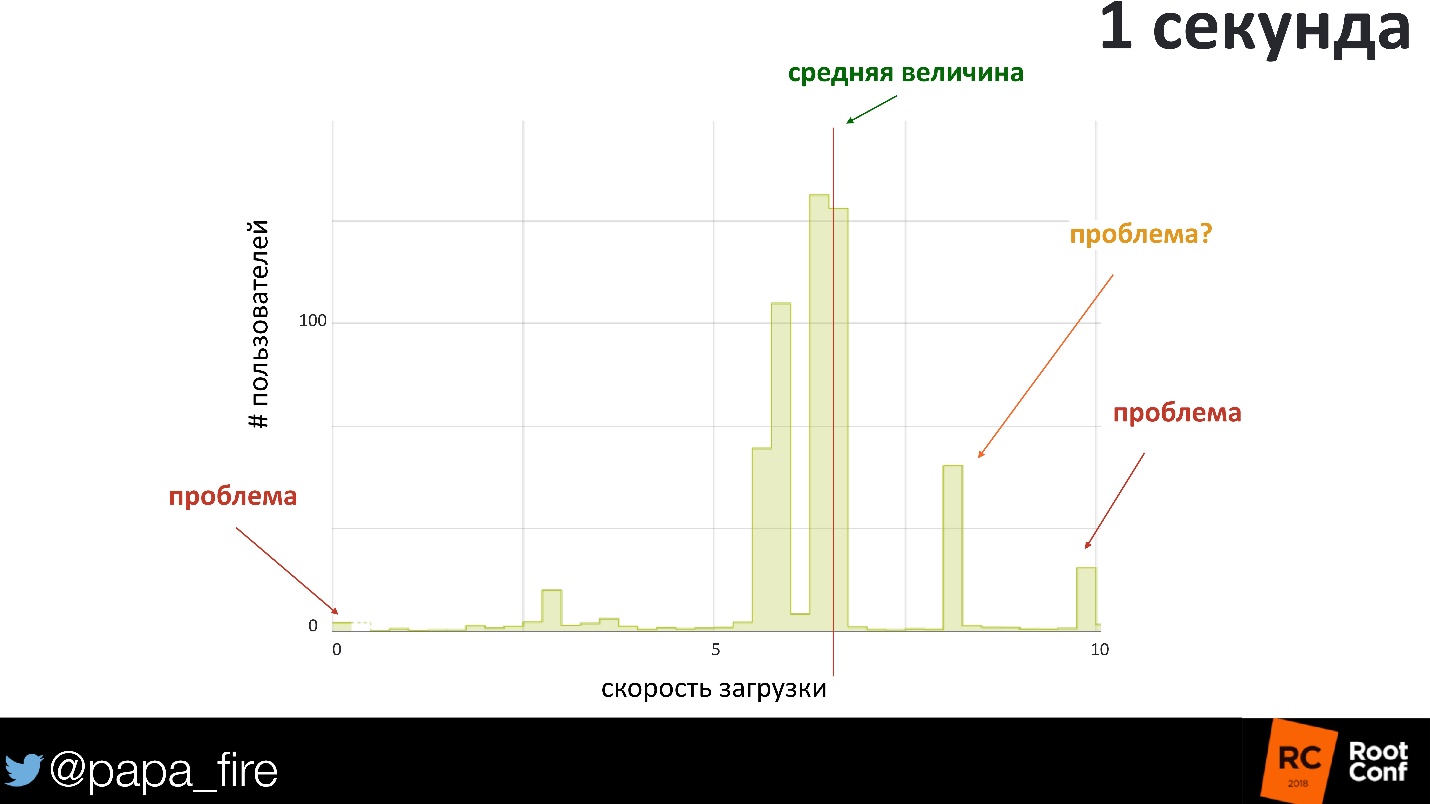
We construct the distribution of the response rate for 1 second. Loading the page for each user on average takes 600-700 ms. Of course, 600 ms is not the best time, but it seems to be within reasonable limits. But if you look in detail, you can see users who took more than a second to download. Already with 800 ms, an area begins where you can lose money, because users will simply leave - it loads too slowly.
Interestingly, the problem may be where the load time is close to zero. If the answer returned in 0 seconds, obviously something went wrong, not at all! But on average, no alerts will not go.
Each user is important because it bears some amount. Histograms and heatmaps are the best way to track a picture, because they show the variation of individual users and how it relates to the metric.
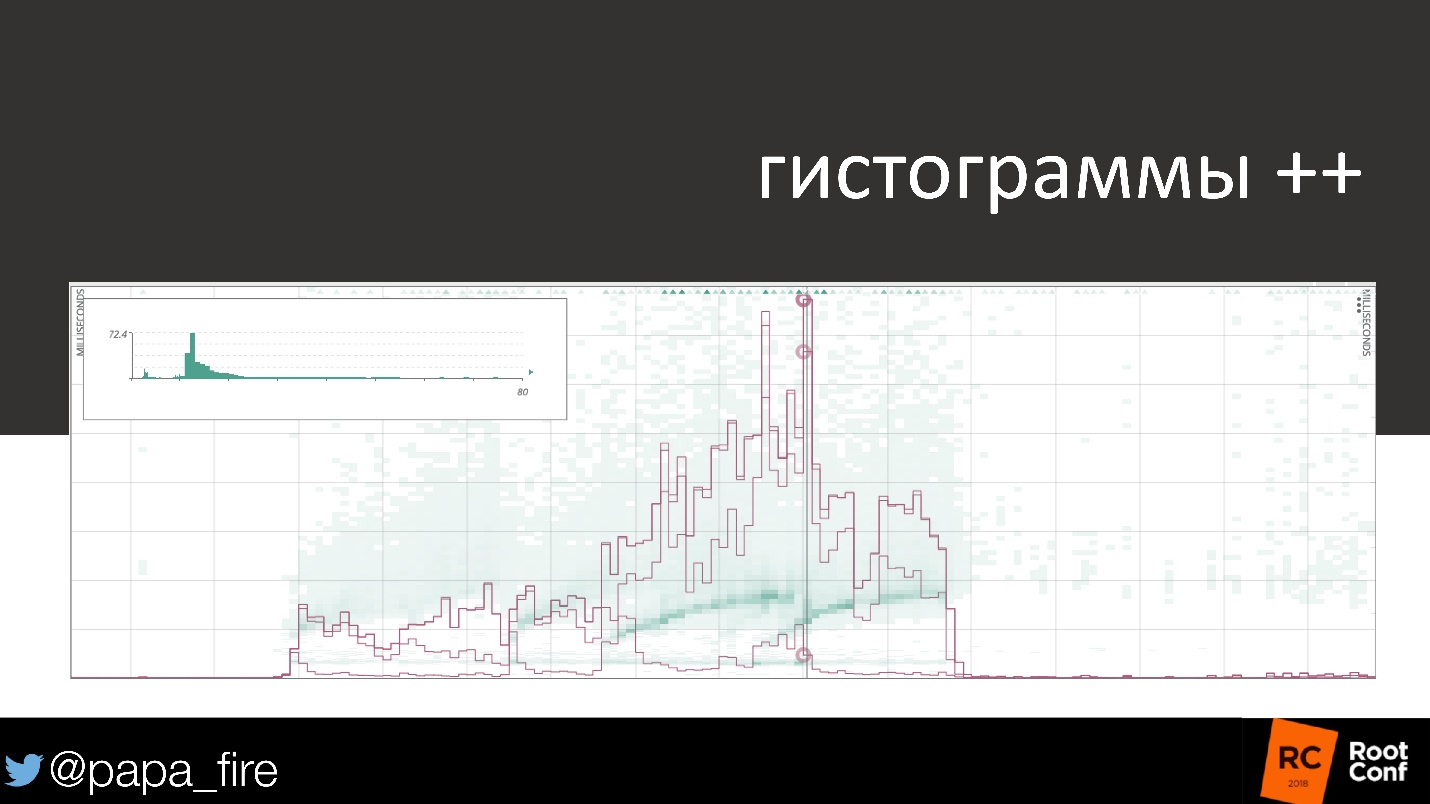
This map shows the 99th and 50th percentiles, the average and variation of individual users. You can see how they differ from each other.
Another point that I would like to talk about is what DevOps has been talking about lately - this is the measurement of process efficiency.
Process efficiency
In each process there are many small processes, in each company there are different processes, and each stage of these processes can be optimized.
Value stream mapping is the partitioning of a process into components and the optimization of individual steps. You take the whole process and write down what exactly happens step by step. For example, who should tick where the automatic test worked, how long it takes, what happens after that, what percentage of errors. After that, you look where it is best to optimize this process in order to increase revenues.
There are four main metrics:
- MTTD (mean time to discovery) - how much time is needed on average to find an error.
- MTTR (mean time to recovery) - how much time on average it takes to correct the error.
- The time from the beginning of the process to the moment when the result comes into the hands of the user.
- Time / resources of each step.
On a couple of my projects, I calculated how much money a company makes per hour, and then extrapolated from this how much money one user brings. By simple calculations it turned out: “If just registration will not work for an hour - that's how much money the company will lose. Not the theoretical or potential, but the company loses the physical money if the registration page does not work. ”
If the process can be optimized, it takes less resources, costs less. This eventually raises the company's revenues, which also need to be measured.
So your job is to support the business . We sometimes forget it and believe that our job is to write a better program, to make the most funny architecture. In the end, all this is done in order to support the business. Learn to understand business .
How to understand a business is a separate conversation that can take much longer because we speak different languages to them. But understand what data you need to collect, what exactly is important, what should wake you in the middle of the night. Because success for you is success for business.
On October 1 and 2, Moscow will host a professional conference on the integration of DevOpsConf Russia development, testing and operation processes .
If you are just starting to work on the principles of DevOps, this will be a great opportunity to look at real working examples from start to successful implementation, and get into ideas like the Leon report. For advanced professionals, there will be reports with deep immersion in the topic and important details, and discussions of new products.
Come and see how development, testing and operation can be inseparable .
