Project Economics (start a project or not) - version two
More than a year ago I published a post about the economics of projects . I was approached by habrausers with a request to help with the assessment, and over time I realized that that post was not very good. Therefore, I propose to get acquainted with a more detailed approach.
Under the cut will be financial methods tested on IT projects, in particular - how to draw up a road map, how to work with the planning horizon, how to calculate indicators, how to analyze risks.
To make a decision about whether to start a project or not, you should go through several steps that will answer various questions. The steps are as follows - first you need to understand the idea of the project and the product, how it will generate money (its business model). The next step will be to determine the “strategy” of the project - what should be done and when, then you need to determine at what time intervals the project is evaluated (for different periods different approaches to the assessment), after which everything is calculated and the risk is analyzed. You can add / repartition steps, but the sequence as a whole is this, it is due to the fact that the information from the previous step is used in the next step. Next, each step will be considered in more detail.
Description of the idea of a project, product, service, some profit-making system. Description and design should be reduced to how the profit will be earned, and what investments it will be accompanied. Since the ideas are all different, and even unique, it is difficult to advise something concrete here, but the case should contain information about events and decisions on the project that will occur in the future.
A simple example of a case might be:
Imagine a project to develop some software package that implements a set of useful functions for the end user. Suppose that we previously have the opportunity to conduct market research on the subject of future demand, and then this complex will need to undergo certification after development. If the demand estimate is unsatisfactory (with a probability of 0.3), we abandon the project. If the complex does not pass certification - with a probability of 0.1 - we abandon the project.
The next step will be to draw up a roadmap for the project - a tree of events and decisions, which will allow us to move from the description to the calculation of the final indicators.
Roadmaps are different, but it is important for us to evaluate the project that it contains the following information:
The main type of solution that is most often considered is the refusal to continue the project. In this case, we can count in the worst case on zero revenues, in the best case, on the proceeds from the liquidation of accumulated assets (equipment, customer bases, for example, etc.).
An example of a road map may be as follows (for our case study):
a road map of the project will consist of two events (the result of demand estimation and certification of transmission), and the four points of the decision (at the start of the project, the rejection of the implementation in the case of low demand estimation, the abandonment of sales in case of failure to pass certification, and acceptance for sales in case of successful certification).
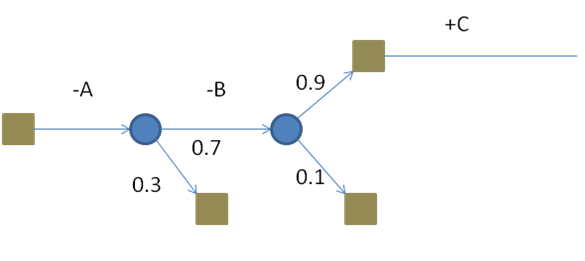
In this case, A is the costs of researching demand brought to date, B is the development costs of investments (present), and C is the net income of the present (net means income minus expenses, that is, profit) .
Looking ahead, the NPV of such a project will be obtained by folding this tree from “leaves” to “root”. NPV = -A + 0.7 * (- B + 0.9 * C) = - A - 0.7 * B + 0.63 * C. About what NPV is and what is “money brought to date” - will be a little later.
The starting point of the planning horizon is always the present. It does not make sense to take into account past costs when evaluating a future project - because they are the same for all options for the development of events, this is firstly, and secondly they only distract (do not give any additional information).
For the end point of the planning horizon, the terminal cost is determined (the cost of the project beyond the horizon) and there can be two cases:
After determining which option the project will be calculated, that is, assumptions, it should be actually calculated. For our example, work with the planning horizon can be as follows: the
phase of sales and support © does not require investment costs, and lasts, say, 5 years, sales are accrued at the end of the period. There is no liquidation of assets (sales of equipment or accumulated data / component). A demand study (A) let it take one year for us (expenses at the beginning of the period), and let investment in development (B) take two years (costs at the beginning of the period).
Now is the time to talk about calculating those indicators by which you can make a decision about the start. We will consider two indicators - NPV (Net Present Value) and PI (Profitability Index). They are consistent, that is, they provide the same information for decision-making, but are used in various cases.
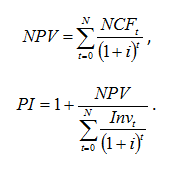
In these formulas: NCF - Net Cash Flow - net cash flow, Inv - investments, t - time, and i - discount rate. You can talk about the discount rate for a long time and to no avail, so I’ll say briefly and on the case - this is the cost of capital (in percent) for the project, which should not be lower than the return on alternative investments with the same level of risk. In good it should be a WACC, which in the case of borrowed capital, it is still clear how to calculate it (cost - the percentage of the loan), and in the case of own - you must rely on what the owners of the capital say. In any case, the discount rate in the calculations should be made a parameter.
NPV thus shows how much net profit given that future payments are cheaper now (than in the future) we have. In the case of an unlimited investment budget, for NPV> 0, the project should be accepted, if NPV <0 - reject, in case of zero - revise later, after changing any of its factors. In case of a limited budget, projects should be ranked by PI, and, cutting off the amount of project investments, start collecting projects in the portfolio with the highest PI - this guarantees the maximum NPV portfolio.
Now about how to calculate NCF. NCF is the sum of two flows - investment and operational. For the case of IT projects, investment is the cost of developing the product / service, and operations are the production and sale of the product (as well as its support).
An example of the calculation can be found in the file .
If you look at the file, you can find the Tornado tab there. The Tornado chart shows how a certain indicator (in our case, NPV) changes depending on changes in project parameters, such as, for example, sales volume or price. The selected worst values of the parameters can lead the project into the zone of negative NPV, which means that something bad is hidden behind this parameter, and it must be at least additionally investigated and then monitored.
This is only one of the methods of risk analysis (sensitivity analysis), but the most commonly used. Others are either an order of magnitude more complicated or do not provide as much information as this.
Taxes remained overboard. For profit, VAT, UST and more. How to take them into account depends on the project, if the evaluation of the project is within the company, then you need to talk with an accountant or economist.
Accounting for inflation was left overboard - in a good way, it must be taken into account both in prices and in the discount rate. Usually, inflation is already sitting in the rate, and prices need not only to be indexed by a certain percentage, but simply set future prices.
After going through all these steps, we have some information about the project, on the basis of which you can make an economically sound decision about whether to start or not. In my opinion, this is not so difficult that it could not be done, except for the problem of the source data - sales estimates and other things. As for the fact that costs are floating - this can be considered as a risk. As regards sales, you can advise the following: if the market is not visible, then either after additional squats (studies) it should still be viewed, or you can put scenarios in the roadmap (high-medium-low demand, and for example, take probabilities based on the distribution according to the survey) . And yet, a project with a decision to refuse is not cheaper (NPV is equal to or greater) than a project in which it is impossible to refuse losses.
In general, not only the final indicators are important, but also this entire step-by-step process: it allows you to structure the future of the project, and work out alternatives that at first glance may not be obvious.
Under the cut will be financial methods tested on IT projects, in particular - how to draw up a road map, how to work with the planning horizon, how to calculate indicators, how to analyze risks.
To make a decision about whether to start a project or not, you should go through several steps that will answer various questions. The steps are as follows - first you need to understand the idea of the project and the product, how it will generate money (its business model). The next step will be to determine the “strategy” of the project - what should be done and when, then you need to determine at what time intervals the project is evaluated (for different periods different approaches to the assessment), after which everything is calculated and the risk is analyzed. You can add / repartition steps, but the sequence as a whole is this, it is due to the fact that the information from the previous step is used in the next step. Next, each step will be considered in more detail.
Business case
Description of the idea of a project, product, service, some profit-making system. Description and design should be reduced to how the profit will be earned, and what investments it will be accompanied. Since the ideas are all different, and even unique, it is difficult to advise something concrete here, but the case should contain information about events and decisions on the project that will occur in the future.
A simple example of a case might be:
Imagine a project to develop some software package that implements a set of useful functions for the end user. Suppose that we previously have the opportunity to conduct market research on the subject of future demand, and then this complex will need to undergo certification after development. If the demand estimate is unsatisfactory (with a probability of 0.3), we abandon the project. If the complex does not pass certification - with a probability of 0.1 - we abandon the project.
The next step will be to draw up a roadmap for the project - a tree of events and decisions, which will allow us to move from the description to the calculation of the final indicators.
Road map
Roadmaps are different, but it is important for us to evaluate the project that it contains the following information:
- What money will be received / spent as a result of the stage
- What is the likelihood that after some event we will fall into a certain scenario for the further development of the project
- What decisions can be made after events occur.
The main type of solution that is most often considered is the refusal to continue the project. In this case, we can count in the worst case on zero revenues, in the best case, on the proceeds from the liquidation of accumulated assets (equipment, customer bases, for example, etc.).
An example of a road map may be as follows (for our case study):
a road map of the project will consist of two events (the result of demand estimation and certification of transmission), and the four points of the decision (at the start of the project, the rejection of the implementation in the case of low demand estimation, the abandonment of sales in case of failure to pass certification, and acceptance for sales in case of successful certification).
In this case, A is the costs of researching demand brought to date, B is the development costs of investments (present), and C is the net income of the present (net means income minus expenses, that is, profit) .
Looking ahead, the NPV of such a project will be obtained by folding this tree from “leaves” to “root”. NPV = -A + 0.7 * (- B + 0.9 * C) = - A - 0.7 * B + 0.63 * C. About what NPV is and what is “money brought to date” - will be a little later.
Horizon planning
The starting point of the planning horizon is always the present. It does not make sense to take into account past costs when evaluating a future project - because they are the same for all options for the development of events, this is firstly, and secondly they only distract (do not give any additional information).
For the end point of the planning horizon, the terminal cost is determined (the cost of the project beyond the horizon) and there can be two cases:
- End of product life cycle and liquidation of accumulated assets. The terminal value in this case is the value of the assets sold.
- The point at which it is believed that after it the project’s cash flows are the same (the project reaches “capacity” and generates the same money flow). The terminal value in this case is the value of these cash flows reduced to this point.
After determining which option the project will be calculated, that is, assumptions, it should be actually calculated. For our example, work with the planning horizon can be as follows: the
phase of sales and support © does not require investment costs, and lasts, say, 5 years, sales are accrued at the end of the period. There is no liquidation of assets (sales of equipment or accumulated data / component). A demand study (A) let it take one year for us (expenses at the beginning of the period), and let investment in development (B) take two years (costs at the beginning of the period).
Calculation of indicators
Now is the time to talk about calculating those indicators by which you can make a decision about the start. We will consider two indicators - NPV (Net Present Value) and PI (Profitability Index). They are consistent, that is, they provide the same information for decision-making, but are used in various cases.
In these formulas: NCF - Net Cash Flow - net cash flow, Inv - investments, t - time, and i - discount rate. You can talk about the discount rate for a long time and to no avail, so I’ll say briefly and on the case - this is the cost of capital (in percent) for the project, which should not be lower than the return on alternative investments with the same level of risk. In good it should be a WACC, which in the case of borrowed capital, it is still clear how to calculate it (cost - the percentage of the loan), and in the case of own - you must rely on what the owners of the capital say. In any case, the discount rate in the calculations should be made a parameter.
NPV thus shows how much net profit given that future payments are cheaper now (than in the future) we have. In the case of an unlimited investment budget, for NPV> 0, the project should be accepted, if NPV <0 - reject, in case of zero - revise later, after changing any of its factors. In case of a limited budget, projects should be ranked by PI, and, cutting off the amount of project investments, start collecting projects in the portfolio with the highest PI - this guarantees the maximum NPV portfolio.
Now about how to calculate NCF. NCF is the sum of two flows - investment and operational. For the case of IT projects, investment is the cost of developing the product / service, and operations are the production and sale of the product (as well as its support).
An example of the calculation can be found in the file .
Risk analysis
If you look at the file, you can find the Tornado tab there. The Tornado chart shows how a certain indicator (in our case, NPV) changes depending on changes in project parameters, such as, for example, sales volume or price. The selected worst values of the parameters can lead the project into the zone of negative NPV, which means that something bad is hidden behind this parameter, and it must be at least additionally investigated and then monitored.
This is only one of the methods of risk analysis (sensitivity analysis), but the most commonly used. Others are either an order of magnitude more complicated or do not provide as much information as this.
What's overboard
Taxes remained overboard. For profit, VAT, UST and more. How to take them into account depends on the project, if the evaluation of the project is within the company, then you need to talk with an accountant or economist.
Accounting for inflation was left overboard - in a good way, it must be taken into account both in prices and in the discount rate. Usually, inflation is already sitting in the rate, and prices need not only to be indexed by a certain percentage, but simply set future prices.
Finally
After going through all these steps, we have some information about the project, on the basis of which you can make an economically sound decision about whether to start or not. In my opinion, this is not so difficult that it could not be done, except for the problem of the source data - sales estimates and other things. As for the fact that costs are floating - this can be considered as a risk. As regards sales, you can advise the following: if the market is not visible, then either after additional squats (studies) it should still be viewed, or you can put scenarios in the roadmap (high-medium-low demand, and for example, take probabilities based on the distribution according to the survey) . And yet, a project with a decision to refuse is not cheaper (NPV is equal to or greater) than a project in which it is impossible to refuse losses.
In general, not only the final indicators are important, but also this entire step-by-step process: it allows you to structure the future of the project, and work out alternatives that at first glance may not be obvious.