Electric Imp - Making a WiFi Thermometer
 Many of you are familiar with the announcement of Electric Imp, which was not so long ago on the hub , in addition , first impressions of its use are already beginning to appear . Since this device seemed promising and quite interesting to me, when I first released the developer edition, I ordered myself to play a little and evaluate the possibilities.
We collect
Electric Imp itself at the time of purchase cost $ 29.95 , but to start using it you will have to buy a fee, which was estimated at $ 19.95 (now the price has decreased to $ 12.95 ).

After the kit arrived, instead of the usual
Thermistor connection diagram is very simple

Thermistor connection diagram ( source )
To get rid of the wires, I connected a 750mAh battery, while on the board itself I need to set the battery power on with the jumper. It turned out to be a very compact device.


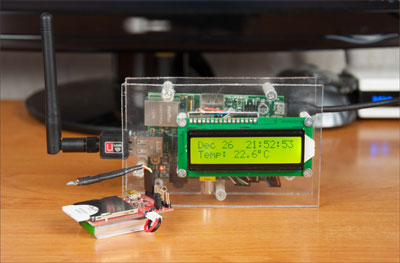
To visually display the temperature, I took a Raspberry Pi lying around idle and a 16x2 LCD indicator from some Chinese set.

Scheme of connecting the LCD 16x2 indicator to the Raspberry Pi ( source )
I had to suffer a bit because I came across some kind of intermediate revision of raspberries and the code did not start on the fly. It turned out that on the Raspberry Pi board the purpose of several legs was changed, one of them was just needed to connect the LCD.
Programmable
The code for working with a thermistor is quite simple, everything works great and the result can be observed in a glider on the electricimp website. Now I need to send the result to where I need it, since the API has the ability to send HTTP requests, but there are some nuances here. First of all, I tried to send the result inside my local network, and received nothing. After the debriefing, it turned out that the Imp request was sent not directly, but through its server. There are two ways out, either forward the port on the router inside the local network, or send it to your external server, and periodically drag out the latest readings from the local server from there. Port forwarding imposes certain restrictions on use, so I decided to raise the server with a simple API on the App Engine, simultaneously forcing him to draw graphs, which turned out to be very useful.
main.py
#!/usr/bin/env python
import webapp2
import json
import logging
import utils
import time
import os
import datetime
from google.appengine.ext.webapp import template
from google.appengine.ext import db
class Sensor(db.Model):
    temperature = db.FloatProperty(required = True)
    battery     = db.FloatProperty(required = True)
    added       = db.DateTimeProperty(auto_now_add = True, indexed=True)
class SensorRequestHandler(webapp2.RequestHandler):
    def post(self):
        data    = json.loads(self.request.body)
        params  = json.loads(data['value'])
        temp    = params['temp']
        battery = params['battery']
        sensor = Sensor(temperature = temp, battery = battery)
        sensor.put()
        self.response.out.write('OK')
    def get(self):
       sensors_data = Sensor.all().order('added').fetch(None)
        temperature_data = []
        battery_data     = []
        for item in sensors_data:
            temperature_data.append([int(time.mktime(item.added.timetuple()))*1000 ,round(item.temperature, 1)])
            battery_data.append([int(time.mktime(item.added.timetuple()))*1000, round(item.battery, 2)])
        path = os.path.join(os.path.dirname(__file__), 'templates/charts.html')
        self.response.out.write(template.render(path, {
            'temperature_data' : utils.GqlEncoder().encode(temperature_data),
            'battery_data' : utils.GqlEncoder().encode(battery_data)
            }))
class LastRequestHandler(webapp2.RequestHandler):
    def get(self):
        ordered_list = db.GqlQuery('select * from Sensor order by added desc limit 1')
        last = ordered_list.get()
        self.response.headers['Content-Type'] = 'application/json'
        self.response.out.write(utils.GqlEncoder().encode(last))
class CleanRequestHandler(webapp2.RequestHandler):
    def get(self, bulk = 'old'):
        logging.debug("bulk: %s", bulk)
        try:
            while True:
                q = Sensor.all()
                if bulk != 'all':
                    q.filter('added <', datetime.date.today() - datetime.timedelta(days=60))
                assert q.count()
                db.delete(q.fetch(200))
                time.sleep(0.5)
        except Exception, e:
            self.response.out.write(repr(e)+'\n')
            pass
app = webapp2.WSGIApplication([
    ('/sensor', SensorRequestHandler),
    ('/sensor/last', LastRequestHandler),
    ('/sensor/clean/?(all)?', CleanRequestHandler)
], debug=True)
As a result, the result looks like this:
- Imp every 10 minutes sends temperature readings to an external server
- The server saves this value
- Raspberry Pi pulls up the temperature readings every few minutes and displays it on the LCD display.
In parallel with the temperature, I decided to collect battery voltage readings, but it turned out that the function from the API returns the voltage from the board itself (~ 3.25V).
Unfortunately, the current capabilities for executing an HTTP request are very limited, so I had to pervert and pack the data in JSON, which in turn was packaged in JSON a second time inside the HTTPRequest node.
class Termistor
{
    pin_num = null;
    constructor(pin){
        pin_num = pin
        hardware["pin" + pin_num].configure(ANALOG_IN);
    }
    function read(){
        return hardware["pin" + pin_num].read();
    }
    function getTemperature(){
        local temp = math.log(((655350000/read()) - 10000));
        temp = 1 / (0.001129148 + (0.000234125 + (0.0000000876741 * temp * temp ))* temp );
        temp = temp - 273.15;
        return temp;
    }
}
local sensor = Termistor(9);
local output = OutputPort("Temperature", "string");
imp.configure("Termistor 10K", [], [output]);
function capture(){
    imp.wakeup(600.0, capture);
    local temp = sensor.getTemperature();
    local jsonOut = "{\"temp\":"+temp+", \"battery\":"+hardware.voltage()+"}";
    output.set(jsonOut);
    server.show(format("%1.1fºC", temp));
}
capture();
imp.sleep(2.0)
server.sleepfor(600.0)
Reaping the benefits
The graphs are stable, they look like this:

Raspberry Pi displays the temperature.

For a more visual demonstration, I shot a short video (I recommend watching in 720p and in full screen):
Energy saving
Imp can be launched in three modes
Disabled powersave mode (default)
In this mode, the WiFi module is always on. This contributes to low network latency but leads to high current consumption of ~ 60-80mA for 3.3V
Powersave mode enabled
In this mode, the consumption drops to 5mA at times when there is no WiFi transmission, but the delay before transmission increases accordingly and it can be more than 250ms.
Deep dream
In this mode, Imp disconnects from the WiFi network, stops executing code, loses context (except for data in a special nv table) and switches to very low power consumption mode (~ 6 μA). Either a pre-cocked timer or a wake-up pin can wake you up. Starting and connecting to a WiFi network takes about 2s.
I must admit that my experiments with powersave mode ended in failure. That with the mode turned on, that with the Imp turned off, I lived alone for three days. In principle, we can conclude that for some reason this same powersave mode was always on for me because the average consumption came out
750/24 * 3 ~ 10 mA, which corresponds to the included powersave mode.
In deep sleep mode, Imp has been working as a temperature sensor for a month, and the voltage dropped from 4.2 to 3.68, that is, a 750mAh LiPo battery should last about a month and a half, which is good news.
Plans
Add an honest battery voltage meter (which is especially important for LiPo batteries), fasten the solar battery and, while there are no special plans, use it as a local temperature sensor in one of the enthusiastic weather projects. It’s also possible to add a Geiger counter.
Conclusion
The device turned out to be very interesting and promising, but at the moment it is severely limited by the tight binding to its own Electric Imp servers and the scarcity of the API. Assuming that these shortcomings are corrected, Imp is ideally suited for use with various sensors in smart home systems.
useful links
1. Source code on github
1. Arduino + termistor
2. Electric Imp Wiki
3. Drive a 16x2 LCD with the Raspberry Pi