December 7, 2012 at 15:18
Introduction to Vector Displays
This article is a translation of this article.
I hope my translation is not too clumsy, but the material is interesting.
Today vector displays are more likely old wonders than a means of displaying information, nevertheless, their use in arcade machines and radar systems gives them a certain charm.
Unlike ordinary raster displays, where the beam each time passes from left to right and from top to bottom to draw each line, in vector displays the beam moves along the lines that define the image.
Most two-channel oscilloscopes have an XY mode in which the signal used to sweep the image in time is replaced by the input signal, thereby allowing you to control the position of the beam in two planes. Using PWM-a with a low-pass filter can be effective for controlling the brightness of the LED, but in order to draw complex shapes a faster way is needed. The easiest way is to use the DAC (digital-to-analog converter) according to the R-2R scheme.
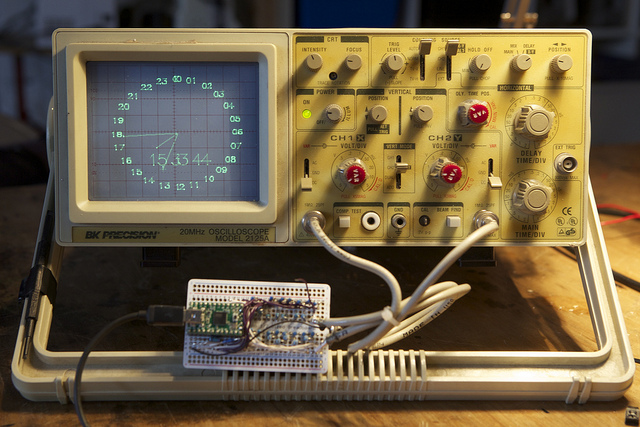
If you are interested in learning more about creating a vector display or how to draw an oscilloscope on a screen, welcome to cat.
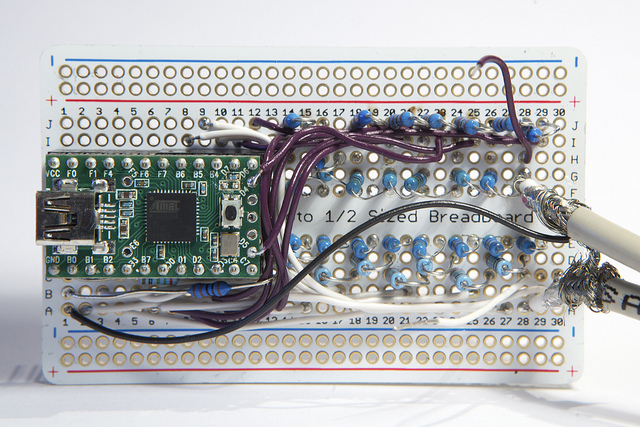
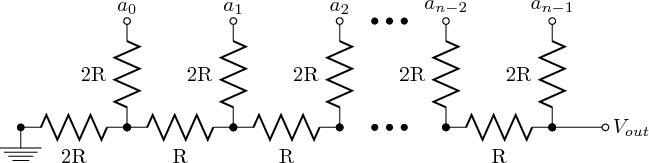
The eight-bit DAC is easy to make, it only requires 16 resistors per channel. It is advisable to use resistors with one percent tolerance, but 5% will also work. You need 7 resistors with resistance R and 9 with resistance 2 * R.
In this case, 0.5 and 1 kΩ resistors are used.
Schematic diagram of the converter:
Since we control two channels of the oscilloscope, we need two DACs.
If you don’t want to solder so many details, you can use resistor assemblies in SIP packages or use something like MC1408 / 1508 (multiplying DACs) in a 16 pin DIP package.
This project uses a board based on the ATMEGA32U4 microcontroller, you can use almost any other other microcontroller, the main thing is that there are two 8-pin ports in it so that you can change the state of the pins at the same time.
I use the ports PORTD and PORTB.
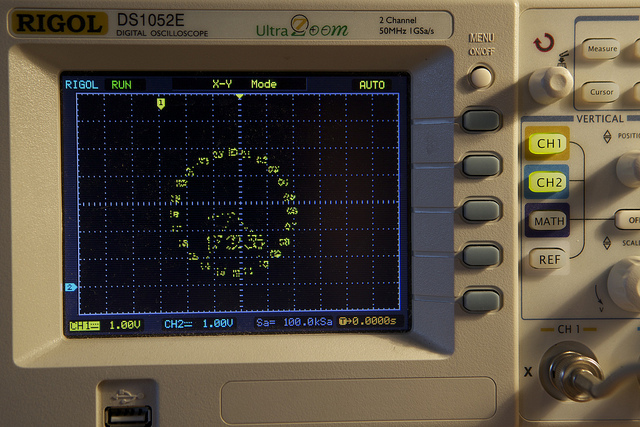
After soldering the circuit, connect it to the oscilloscope and put it into XY mode.
In inexpensive Rigol, you need to go to the Horizontal Menu - Time Base menu and select the XY mode.
Unfortunately, inexpensive digital oscilloscopes with LCD screens are inferior to analog ones in the context of drawing, although some have a Digital Phosphor mode that simulates the inertness of the screen.
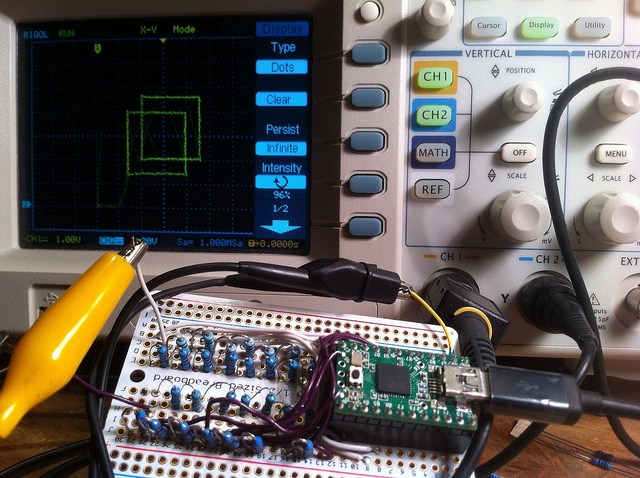
By connecting the DACs directly to the ports of the microcontroller, the analog voltage can be changed by writing values to the port. For example, to generate a 2-volt signal, the value should be 256 * 2.0V / 5.0V == 102.
In principle, we are not interested in the specific value of voltage, it is important that the output voltage varies linearly from 0 volts at 0x00 to 5 volts at 0xFF.
The oscilloscope should be set to a range of 0-5 Volts and aligned on each axis.
The first thing to try is to draw horizontal and vertical lines, this can be done using loops, leaving one variable unchanged. For example, when drawing a horizontal line, the value of Y is constant and vice versa.
Code for drawing a square, like in the previous figure.
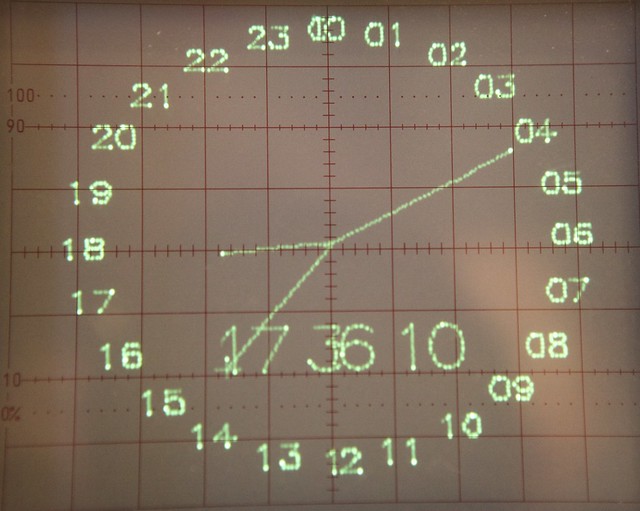
This image shows a common artifact of vector displays: bright dots at the beginning and end of a line. This effect occurs because the intensity of the luminescence of a point depends on the time spent by the beam at that point, and since the program needs some time to load a new line, the beam lingers a little longer in one place. To solve this problem, you can use 16-bit arithmetic or add NOPs so that switching always takes place at the same time.
Here I must say about the burnout of the screen.
If the values do not change for a long time, then the phosphorus in this place can fade and becomes a different color. Screens can also be damaged if you constantly display the same image. During the firmware of the microcontroller, the ports usually switch to Z-mode, which means that zeros are fed to the input of the oscilloscope, which is reflected in the appearance of a bright spot in the corner of the screen.
During flashing it is best to lower the brightness.
Drawing oblique lines is much more complicated than drawing vertical or horizontal lines.
The ideal option is to use analog circuits to smoothly change the signal, as, for example, this is done in the SC200 .
In other matters, instead we can use the Bresenham algorithm to split the line into points. The use of this algorithm causes the appearance of steps in the image, but this is offset by the ease of implementation.

After we learned how to draw lines, nothing prevents us from drawing symbols.
It is convenient to use the Hershey Fonts library as a font .
In it, each character consists of less than 32 points. All coordinates of the points are located relative to the lower left corner of the symbol and are connected until a value (-1, 1) is met, which means that you need to jump to the next point. The contour ends at a point with a value of (0, 0).
Example for the number 1.
Sometimes in the image you can see the lines between two points that do not connect, this is because the voltage on the DAC does not change instantly. This effect can be corrected if you use the brightness channel of the oscilloscope, unfortunately my oscilloscope does not have such a function.
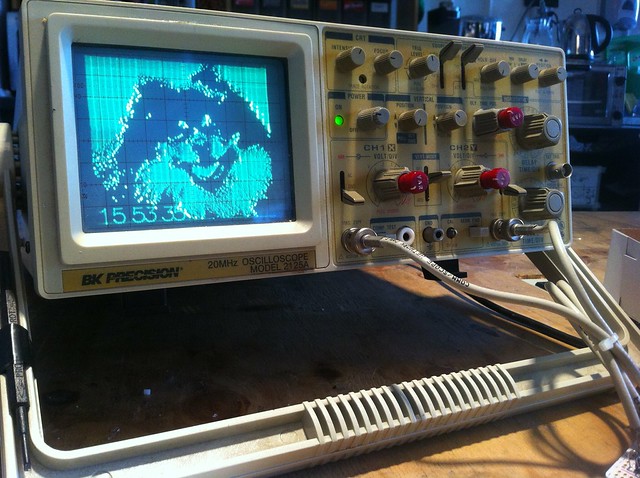
Using the oscilloscope, you can also display bitmap images.
Images are obtained by converting the image to X Bitmap format using ImageMagick. X Bitmap is a text format for representing images, can be used directly in the source.
As a result, a monochromatic image appears, occupying 8 kilobytes of program memory.

If the video does not appear, you can find it at www.flickr.com/photos/osr/7925036218/in/set-72157631344809602
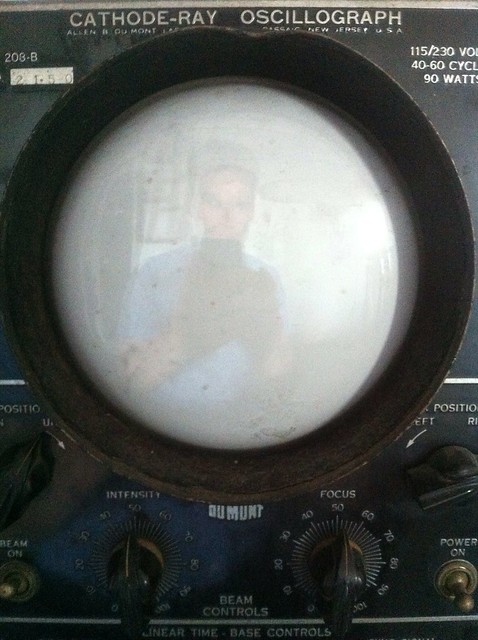
In the future, I plan to restore the wonderful CRT oscilloscope and port Spacewar with PDP-1.
I hope my translation is not too clumsy, but the material is interesting.
Today vector displays are more likely old wonders than a means of displaying information, nevertheless, their use in arcade machines and radar systems gives them a certain charm.
Unlike ordinary raster displays, where the beam each time passes from left to right and from top to bottom to draw each line, in vector displays the beam moves along the lines that define the image.
Most two-channel oscilloscopes have an XY mode in which the signal used to sweep the image in time is replaced by the input signal, thereby allowing you to control the position of the beam in two planes. Using PWM-a with a low-pass filter can be effective for controlling the brightness of the LED, but in order to draw complex shapes a faster way is needed. The easiest way is to use the DAC (digital-to-analog converter) according to the R-2R scheme.
If you are interested in learning more about creating a vector display or how to draw an oscilloscope on a screen, welcome to cat.
Parallel DAC R-2R
The eight-bit DAC is easy to make, it only requires 16 resistors per channel. It is advisable to use resistors with one percent tolerance, but 5% will also work. You need 7 resistors with resistance R and 9 with resistance 2 * R.
In this case, 0.5 and 1 kΩ resistors are used.
Schematic diagram of the converter:
Since we control two channels of the oscilloscope, we need two DACs.
If you don’t want to solder so many details, you can use resistor assemblies in SIP packages or use something like MC1408 / 1508 (multiplying DACs) in a 16 pin DIP package.
This project uses a board based on the ATMEGA32U4 microcontroller, you can use almost any other other microcontroller, the main thing is that there are two 8-pin ports in it so that you can change the state of the pins at the same time.
I use the ports PORTD and PORTB.
Oscilloscope Setup
After soldering the circuit, connect it to the oscilloscope and put it into XY mode.
In inexpensive Rigol, you need to go to the Horizontal Menu - Time Base menu and select the XY mode.
Unfortunately, inexpensive digital oscilloscopes with LCD screens are inferior to analog ones in the context of drawing, although some have a Digital Phosphor mode that simulates the inertness of the screen.
Horizontal and vertical lines
By connecting the DACs directly to the ports of the microcontroller, the analog voltage can be changed by writing values to the port. For example, to generate a 2-volt signal, the value should be 256 * 2.0V / 5.0V == 102.
DDRB = 0xFF;
PORTB = 102; //Значение, необходимое для генерации напряжения, равном 2 Вольта
In principle, we are not interested in the specific value of voltage, it is important that the output voltage varies linearly from 0 volts at 0x00 to 5 volts at 0xFF.
The oscilloscope should be set to a range of 0-5 Volts and aligned on each axis.
The first thing to try is to draw horizontal and vertical lines, this can be done using loops, leaving one variable unchanged. For example, when drawing a horizontal line, the value of Y is constant and vice versa.
void
line_vert(
        uint8_t x0,
        uint8_t y0,
        uint8_t w
)
{
        PORTB = x0;
        PORTD = y0;
        for (uint8_t i = 0 ; i < w ; i++)
                PORTD++;
}
void
line_horiz(
        uint8_t x0,
        uint8_t y0,
        uint8_t h
)
{
        PORTB = x0;
        PORTD = y0;
        for (uint8_t i = 0 ; i < h ; i++)
                PORTB++;
}
Code for drawing a square, like in the previous figure.
 line_vert(64, 64, 128);
 line_vert(196, 64, 128);
 line_horiz(64, 64, 128);
 line_horiz(64, 196, 128);
Inclined lines
This image shows a common artifact of vector displays: bright dots at the beginning and end of a line. This effect occurs because the intensity of the luminescence of a point depends on the time spent by the beam at that point, and since the program needs some time to load a new line, the beam lingers a little longer in one place. To solve this problem, you can use 16-bit arithmetic or add NOPs so that switching always takes place at the same time.
Here I must say about the burnout of the screen.
If the values do not change for a long time, then the phosphorus in this place can fade and becomes a different color. Screens can also be damaged if you constantly display the same image. During the firmware of the microcontroller, the ports usually switch to Z-mode, which means that zeros are fed to the input of the oscilloscope, which is reflected in the appearance of a bright spot in the corner of the screen.
During flashing it is best to lower the brightness.
Drawing oblique lines is much more complicated than drawing vertical or horizontal lines.
The ideal option is to use analog circuits to smoothly change the signal, as, for example, this is done in the SC200 .
In other matters, instead we can use the Bresenham algorithm to split the line into points. The use of this algorithm causes the appearance of steps in the image, but this is offset by the ease of implementation.
void
line(
        uint8_t x0,
        uint8_t y0,
        uint8_t x1,
        uint8_t y1
)
{
        int dx, dy, sx, sy;
        if (x0 < x1)
        {
                dx = x1 - x0;
                sx = 1;
        } else {
                dx = x0 - x1;
                sx = -1;
        }
        if (y0 < y1)
        {
                dy = y1 - y0;
                sy = 1;
        } else {
                dy = y0 - y1;
                sy = -1;
        }
        int err = dx - dy;
        while (1)
        {
                PORTB = x0;
                PORTD = y0;
                if (x0 == x1 && y0 == y1)
                        break;
                int e2 = 2 * err;
                if (e2 > -dy)
                {
                        err = err - dy;
                        x0 += sx;
                }
                if (e2 < dx)
                {
                        err = err + dx;
                        y0 += sy;
                }
        }
}
Fonts
After we learned how to draw lines, nothing prevents us from drawing symbols.
It is convenient to use the Hershey Fonts library as a font .
In it, each character consists of less than 32 points. All coordinates of the points are located relative to the lower left corner of the symbol and are connected until a value (-1, 1) is met, which means that you need to jump to the next point. The contour ends at a point with a value of (0, 0).
Example for the number 1.
typedef struct {
  int8_t x, y;
} path_t;
static const PROGMEM path_t digits[][32] = {
        [1] = {
                { 6,17},
                { 8,18},
                {11,21},
                {11, 0},
        },
};
Sometimes in the image you can see the lines between two points that do not connect, this is because the voltage on the DAC does not change instantly. This effect can be corrected if you use the brightness channel of the oscilloscope, unfortunately my oscilloscope does not have such a function.
Bitmap images
Using the oscilloscope, you can also display bitmap images.
Images are obtained by converting the image to X Bitmap format using ImageMagick. X Bitmap is a text format for representing images, can be used directly in the source.
convert -resize 256x256 input.jpg image/image.xbm
As a result, a monochromatic image appears, occupying 8 kilobytes of program memory.
Video
If the video does not appear, you can find it at www.flickr.com/photos/osr/7925036218/in/set-72157631344809602
Future plans
In the future, I plan to restore the wonderful CRT oscilloscope and port Spacewar with PDP-1.