How expert sales forecasting systems work or how many tablets to load in grams
I already wrote a brief overview of how IT solutions help optimize supply chains. Now I’ll talk about how such systems are implemented in reality in Russia and what it gives . Unfortunately, I can’t name specific customers, so we will now trade in abstract phones and tablets and face the same problems.
So, imagine, two years ago you decided to trade in phones and even opened an online store. At first, everything was simple: there were quite a few orders, and everything can be counted on a piece of paper. Two months later, it became clear that the store was working stably, and deliveries had to be done seriously - because if the user didn’t see his favorite mimi-tablet with a minimal margin, he would just buy it from another store and you would lose the chance to sell not only the tablet, but also expensive covers, adapters and so on.
Accordingly, you have three tasks now:
- Maintain the product range in the main line;
- Understand how many sales will be in order to plan the purchase of accessories;
- Keep control of all the hits and new products, to always sell popular products and "remove the foam" on the launches of new devices.
At this point, the assortment already has about 200 items: it’s difficult to take everything on a piece of paper, so you start keeping an Excel account, where you take into account the speed of sales, the speed of delivery from a distributor or manufacturer, and so on. Little by little it becomes clear that doing all this with hell is difficult, and you write a module to your accounting system (for example, to 1C), where purchases are forecasted.
Thus, you solve your main problem - you can receive alerts that the goods need to be bought at the right moments, plus you can see the condition of the warehouse after a week of normal sales.
Sadly, about 90% of domestic retail and wholesale companies are now at this stage.
If everyone lives like that, what's the problem?
Last January, you suddenly had a problem with an empty warehouse. A few dozens of orders arrived on the day, but you could not respond to them: you just ran out of top-end phones and tablets. Of course, you suspected that in December sales would be much larger than usual, and in January your suppliers would wake up only around the 15th, but you didn’t appreciate how many of these sales would be.
Then, in March, the news was launched: they launched a new, say, Maypud NEW, about which you knew only that it would be very hot. You figured out how many Maypuds of the last generation were sold in a month, bought a couple of dozen new ones - and faced with the fact that there weren’t enough new ones, and the old ones remained in the warehouse for another couple of months, you even had to arrange an action to sell them.
And by this time you already have more than 1000 names of tablets, phones and various accessories, and from a dozen different suppliers. 10 new items of goods are added per day to the assortment matrix, and 2-3 products are consumed (on average). You have three purchasers who constantly go crazy with the load, squint on non-top products (you can’t sell one batch of tablets from China for half a year already) and often forget the shipping dates, which leads to gaps and customer dissatisfaction. Plus, your suppliers are not always stable: someone cuts your batch in half, someone delays delivery, someone is stuck with a whole container of your already paid products at customs, and so on. And for each situation a decision must be made.
And besides, you have a network of distribution points and shops - and in stores you also needed to keep a stock of goods. Roughly speaking, with N points of sale, the task has become more difficult by a factor of N - however, the price of a local error is already lower in comparison with an error in the main warehouse.
As a result, logistics became simply scary, and you decided to solve the problem with the help of the right analytics. People are good, but there are things that can and should be automated so that they work like clockwork.
the main task
After sitting with an accountant over ABC and XYZ analyzes, you realized that you only need to process 20-30 items of goods with your hands, which one buyer can do perfectly. It would be nice if the rest of the goods were considered automatic - it is not so important for your profit, and even a 10% forecast error will be much better and more economical than the work of another 5-6 people. In the end, you are planning to expand your retail network and increase the assortment, so you need automation precisely.
The second task is for the system itself to predict demand, not only taking into account the linear speed of sales, but also taking into account seasonal fluctuations, holidays and so on.
Third task- the launch of new goods should be understandable for purchases: it would be good if the buyer could indicate an analogue from the history for the goods, so that the system understands how it will be sold. For example, the fourth mayfun may have a peak at the beginning and then continue the sales schedule of the third mayfun.
The fourth question - you need to understand how marketing campaigns will affect sales in order to plan purchases based on them. And at the same time - to build scenarios that allow you to evaluate which product is worth selling on the stock, and which is not.
And the fifth question is the withdrawal from the assortment of goods that are in less and less demand, for example, the same second mayfuns that your old system continues to purchase in packs on the machine, regardless of the fourth.
IT solution
You pluck a bunch of solutions, and then come for a test drive us to the CRIC, see how the system is to optimize the supply chain , are asking a lot of questions in its range and you realize that all of the problems, in general, have decided to smart people
a second you imagine that this is already with you - and you experience a blissful feeling that everything is under control, works like a clock and does not mow. True, the frown of the head of the IT department pulls you out of this dream: the fact is that, firstly, he just recognized the price tag for implementation and license, and, secondly, he suddenly realized that the usual 1C or something - It will somehow interact with the new system.
The reality is that you have a tuned 1C, the staff of people working with it, plus you are very, very uncomfortable to change what is very poor, but it works. On the other hand, they promise you a payback of the project for half a year and such clever forecasting of demand and such competent logistics that you will save up to 20% of the money and know exactly what every penny will take - and this will take your breath away.
And in two months, stepping on your standard rake a couple more times, you decide to go. There are several manufacturers of such software. Below I will analyze how this is done, using the JDA solution as an example.
So how does it all go
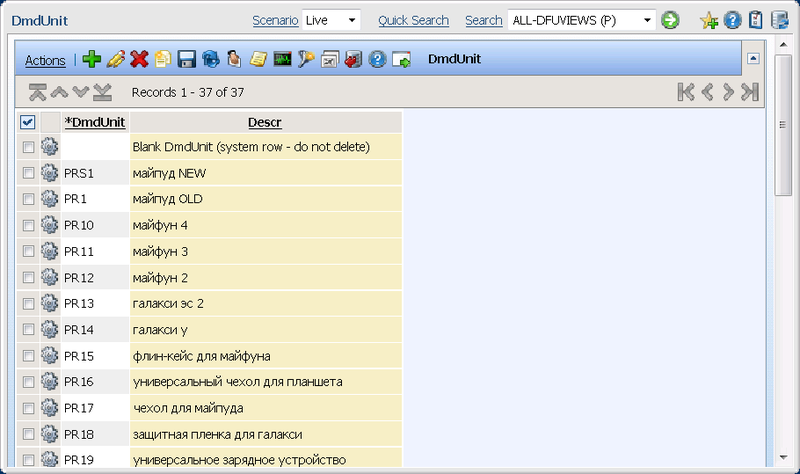
1. You upload all the data about the goods from your accounting system - for example, in JDA there is an opportunity to automatically download the product catalog from your ERP system, for example, from 1C.
2. The forecasting module analyzes each of your products and makes a demand forecast for it. In those time intervals when the goods in the warehouse were 0, the schedule should be restored - it is important for us how much we could sell the goods in the past, if it were, and not how much we sold in fact.
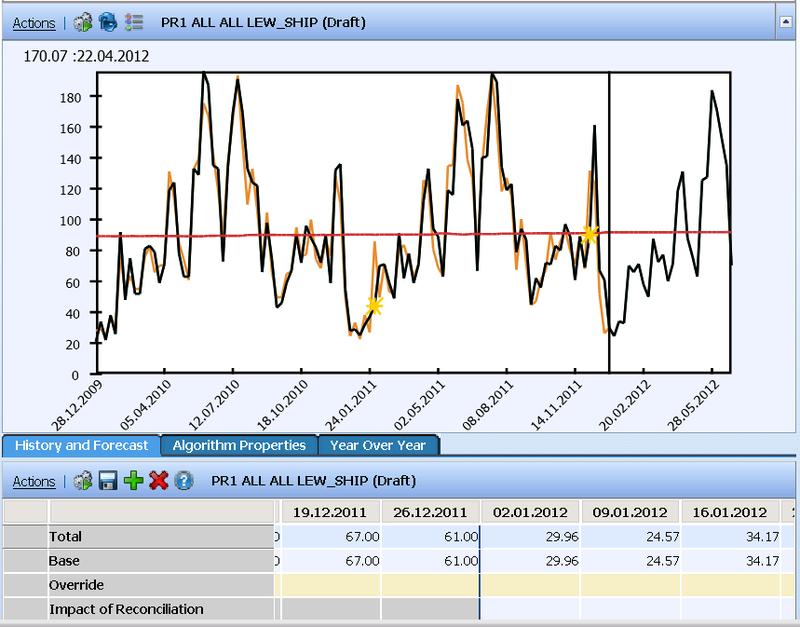
3. Then, for each product, an expert system builds a sales schedule that takes into account all possible fluctuations and factors clogged into the system.At the user level, this is very simple: there are several main scenarios for selling a product: for example, an important commodity for consumption (such as bread), a seasonal product (such as umbrellas), a rapidly obsolete product (mayfun-4), and a product with a torn sales schedule (golden maypud with diamond inlay, which is sold at 5-6 pieces per year). The product may be desired from the launch - or gradually unwind as sales. All this can be calculated automatically or edited by hand. You can see what the system thinks about your product and evaluate how accurately the profile is selected.

4. For each product, points of atypical activity are also constructed:for example, if the schedule is generally smooth, but somewhere there is an outlier, it can be either a marketing campaign (and then you need to show the system that it was), or a small wholesale order through a retail store, or, conversely, the system believes that somewhere then you could sell more goods - and it’s worth remembering if you didn’t fly from the Yandex top at that moment, for example.

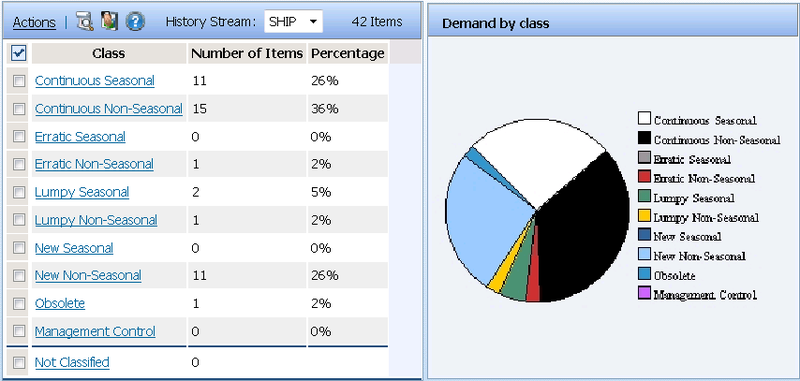
5. After such processing, all your thousands of products receive a sales profile . The system shows you which seasonal product, which is already outdated and ready to go out of circulation, which needs to be purchased more and so on.
6. For goods that are sold in pairs (tablet cover, flashlight, batteries, etc.) you need to build your own accounting units. In addition, if you know related products (for example, a third of those who bought mayfun buy a charge with a car adapter in a month), interactions can also be entered into the system. Such things are not being built automatically by the machine - to configure profiles is the work of the buyer.
7. The system for each product operates with the concept of a forecasting unit DFU (Demand Forecasting Unit). Here is a very important point: DFU is not just a nomenclature unit like a mayfun, but a bunch of units and the place where it is located. For example, a mayfun in Moscow may turn out to be a group A product with a new and “hot” profile, and in Chukotka it may turn out to be a poorly sold group C product that can be easily replaced with a regular brick telephone.
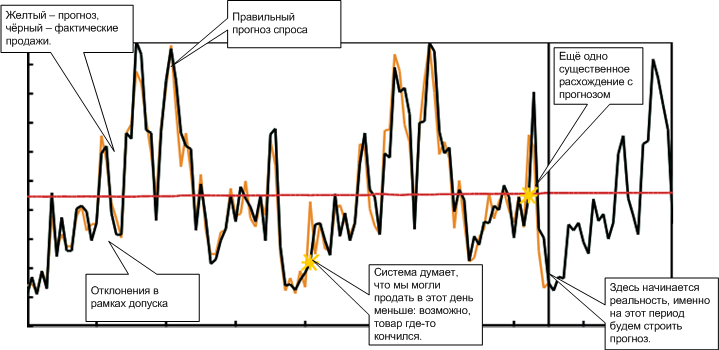
8. After that, actual sales data relative to the forecast are uploaded to the system- and the system learns by comparing the difference in the forecast and the real situation. At the same time, for each new forecast, the following chart is built:
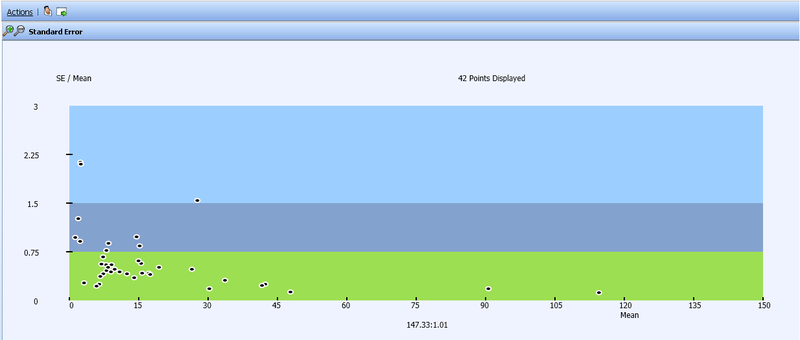
Vertical - forecast error, horizontal - the importance of the goods in circulation.
There are 4 main zones in it:
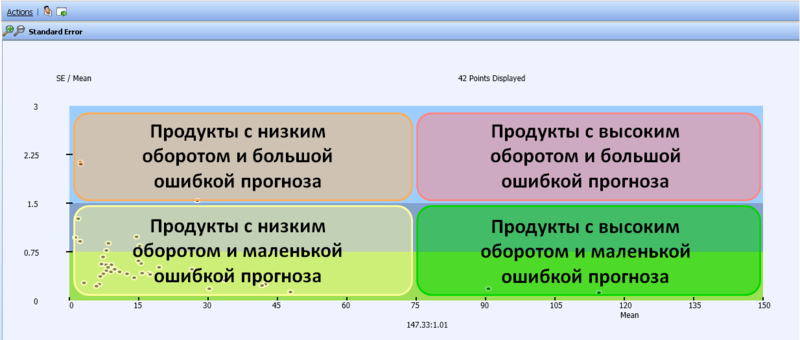
- Low turnover and low error: 70% of goods that previously had to be handled would fall here. Just don’t touch.
- Low turnover and high error: this is something to do if you have time.
- High turnover and low error: you can not touch, but at least worth a look.
- High turnover and high error: here usually there are really several units of goods that you should pay special attention to: either there are serious new trends, problems with supplies, or something else. In any case - precisely handle with your hands.
After the buyer or the specialist in product distribution (depending on the purpose of the forecast) plays enough forecasts, you can build a couple of scenarios, for example, ask the situation that next month you will again sell mayfuns with a 20% discount as you did last year. The system will project these stocks of the past year on the forecast - and you will know how much and what to buy. Which is nice, by the way, promotions can be done by brand - for example, by all covers: the system will calculate how many of each cover you need to buy.
9. The result is a sales forecast , which consists of 95% automatically generated data, and 5% of the data adjusted by the user in accordance with the party’s policy and his ass filing.
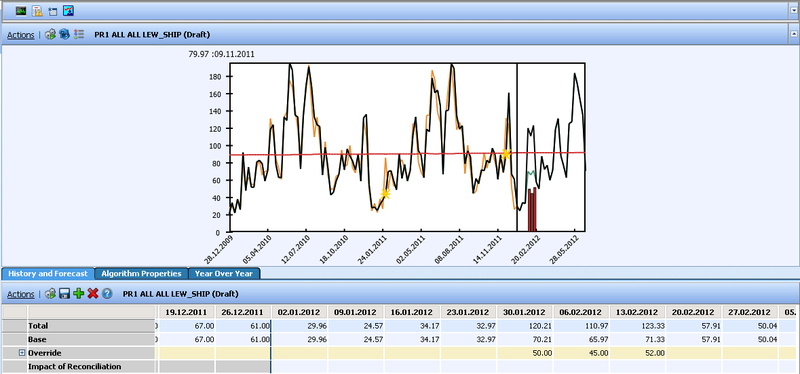
Please note: this graph can be compared with real sales for the past period: this will help to understand how accurate the forecasts are.
This forecast can be shown to management in comparison with the system data (here it thinks that it will sell 100 pieces of tablets with Hello Kitty, but the supplier launched an advertisement on TV, so I believe that 120 pieces are needed).
What next?
Of course, this is cool, but if you think that having received such a forecast, you have solved the problem, then do not rush to rejoice. Here's the thing:
- The supplier offers you to buy a container for 2000 pieces instead of 500 maypuds, but one and a half times cheaper. Will it be profitable considering warehouse storage? And if you also run a discount at the same time, then how?
- The system says that you need to order 40 tablets at one of the points once a week. The problem is that they carry there at least once every two weeks, and in batches of at least 200 boxes - what should I do?
- The Chinese offer to import the tablets directly to your representative office in Vladivostok - it’s really more convenient and cheaper, you just need to take the container: on the one hand, excellent savings on delivery - on the other, it’s not clear what the storage will be, if the tablet has time to become outdated during sales and so on .
- You have already sent two containers of products to Russian Railways to Yekaterinburg, and your competitor suddenly closed there, and demand has grown very much. How much do you need to ship next time and when, taking into account these two containers here?
- Your manager says that there is a suspicion that it is better to print leaflets locally than to distribute them all over the country - and the lag is less and the cost is easier. It must be considered.
- Another manager claims that sometimes it’s more profitable to ship cargo by plane than by train: although it’s more expensive, goods delivered in time are bought up, which increases profit. Again, you need to count.
Previously, you handled such situations as exceptions by hand, but with the growth of your business, they and Russian realities are becoming more and more noticeable. And therefore, you need the next piece of the system - logistics management (in the solution under consideration - this is an additional module) that can process the data of the forecasting module and make sure that the right product is in the right place at the right time. If the topic is interesting, then about it - in the next topic.
Summary
An expert demand forecasting system usually gives this (this is the benchmark of the same JDA):
- The forecast accuracy is growing by 15-20%.
- The complexity of the process is seriously reduced.
- Stocks are reduced by 10-15%.
- The level of service (availability of goods) is growing by 5-10%.
- The number of errors caused by the human factor is reduced.
Approximately this result can be obtained if you use some kind of similar system. We looked at JDA above, there are other vendors that offer similar solutions: what exactly suits your company is up to you.
For specific implementations, you can write to the following addresses:
- Alexander Efimov , head of Data Mining practice, Alexander.Efimov@croc.ru - if you need to understand how this can work or want a test drive.
- Alexey Isaev , head of SCM, AlIsaev@croc.ru - if you need to calculate how much it costs and when it will be implemented, for example.