OpenSource APM Pinpoint

Good to you.
Application Performance Monitoring (APM) monitors the tasks of monitoring, controlling the availability and directly performance of applications.
On Habr's pages, free AWP Glowroot and MoSKito were already covered , but Pinpoint remained in the shadows.
I chose the open source workstation, which are available today as an alternative to paid tools, based on the specifics of our applications and customer requirements, where cloud solutions are completely excluded. Earlier on one of the projects I used Dynatrace software - one of the innovators and leaders in the field of APM. The company previously gave the opportunity to use its product legally after a trial period.
The developers are positioning Pinpoint as a tool for highly scalable distributed systems that will allow you to:
- see the map and application component topologies
- monitor real-time metrics
- see all transactions
- install Agents without editing the code of your applications
- get less than 3% increase in load on your system when removing metrics
On April 1, 2018, support for the following modules was announced:
- JDK 6+
- Tomcat 6/7/8, Jetty 8/9, JBoss EAP 6, Resin 4, Websphere 6/7/8, Vertx 3.3 / 3.4 / 3.5
- Spring, Spring Boot (Embedded Tomcat, Jetty)
- Apache HTTP Client 3.x / 4.x, JDK HttpConnector, GoogleHttpClient, OkHttpClient, NingAsyncHttpClient
- Thrift Client, Thrift Service, DUBBO PROVIDER, DUBBO CONSUMER
- ActiveMQ, RabbitMQ
- MySQL, Oracle, MSSQL, CUBRID, POSTGRESQL, MARIA
- Arcus, Memcached, Redis, CASSANDRA
- iBATIS, MyBatis
- DBCP, DBCP2, HIKARICP
- gson, jackson, json lib
- log4j, logback
But I believe that for standalone systems, it fits perfectly, and in the future there will be the possibility of scaling along with the increasing load on your system.
Pinpoint consists of six main components:
- Apache HBase - as a metrics store
- Apache ZooKeeper - as a configuration and synchronization service
- Apache Flink - streaming engine
- Collector - agent receiving metrics
- WebUI - user interface
- Agent - Metrics Send Agent
Collector and WebUI are war containers, Agent jar file for profiling, which without any changes to your application code is added to JAVA_OPTS. Optionally, developers suggest for WebUI to use the Mysql DBMS to configure users, groups and alerts.
For easy installation, there is an official pinpoint-docker repo.
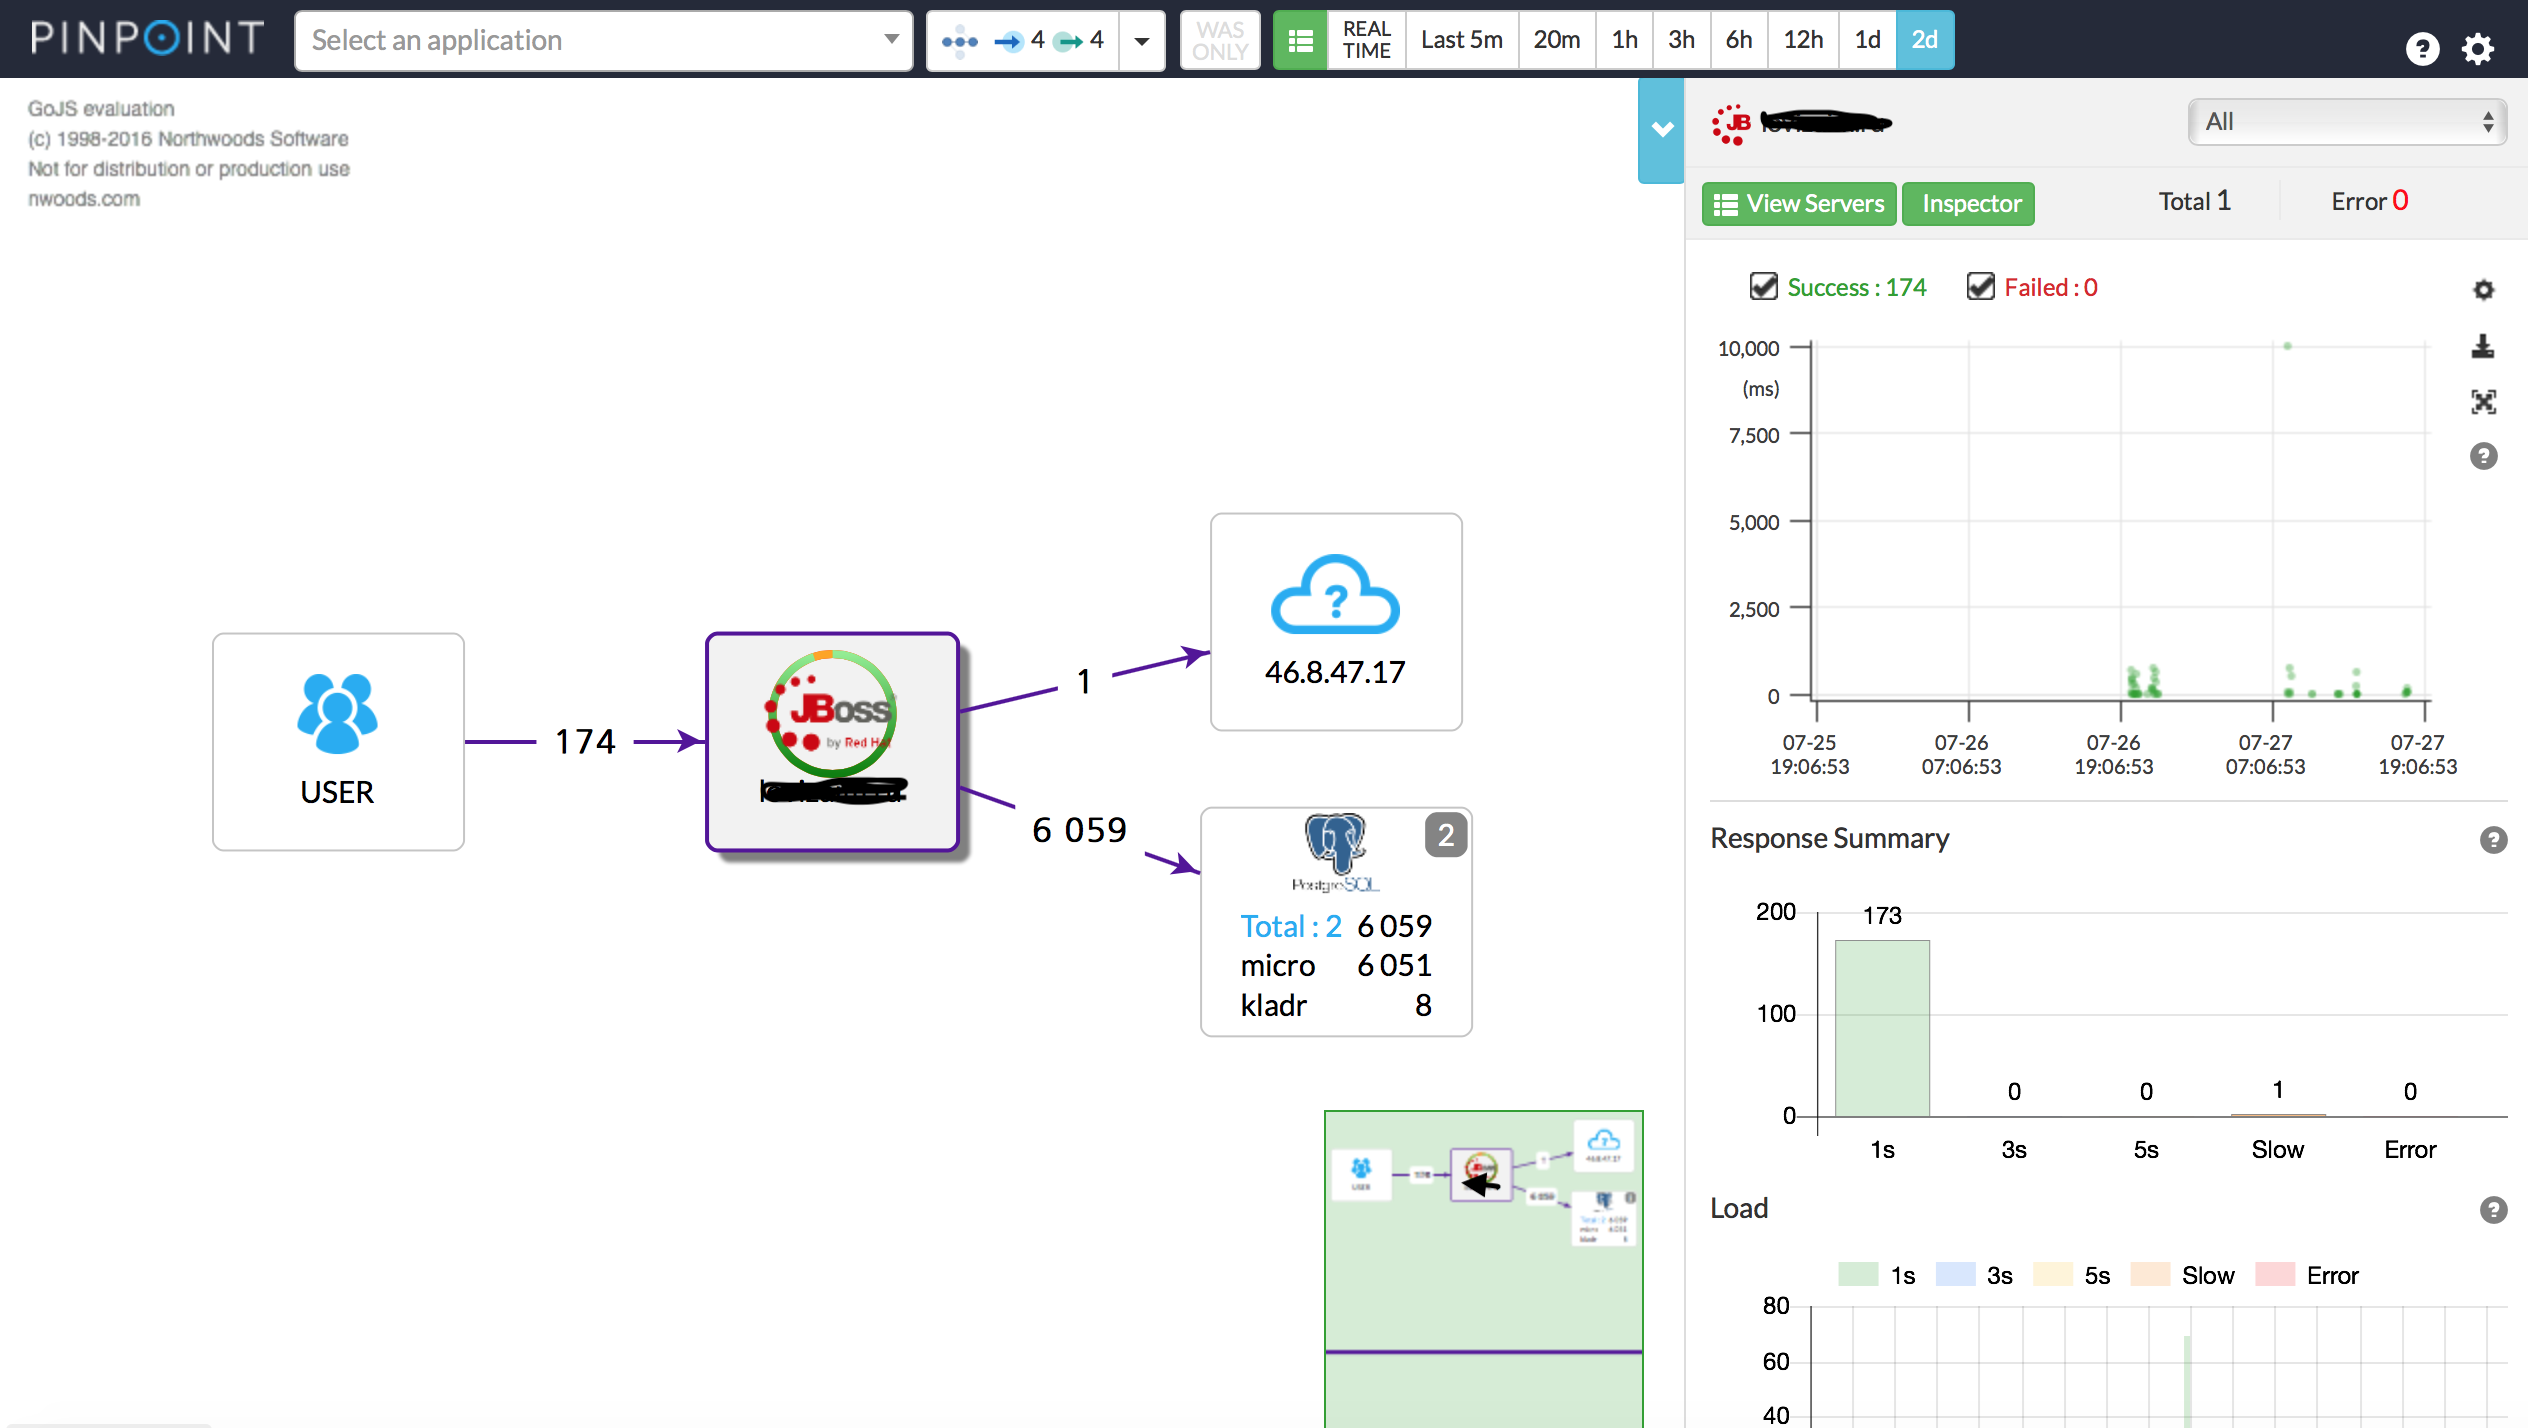
The main page quite clearly displays a picture of the components of the application.
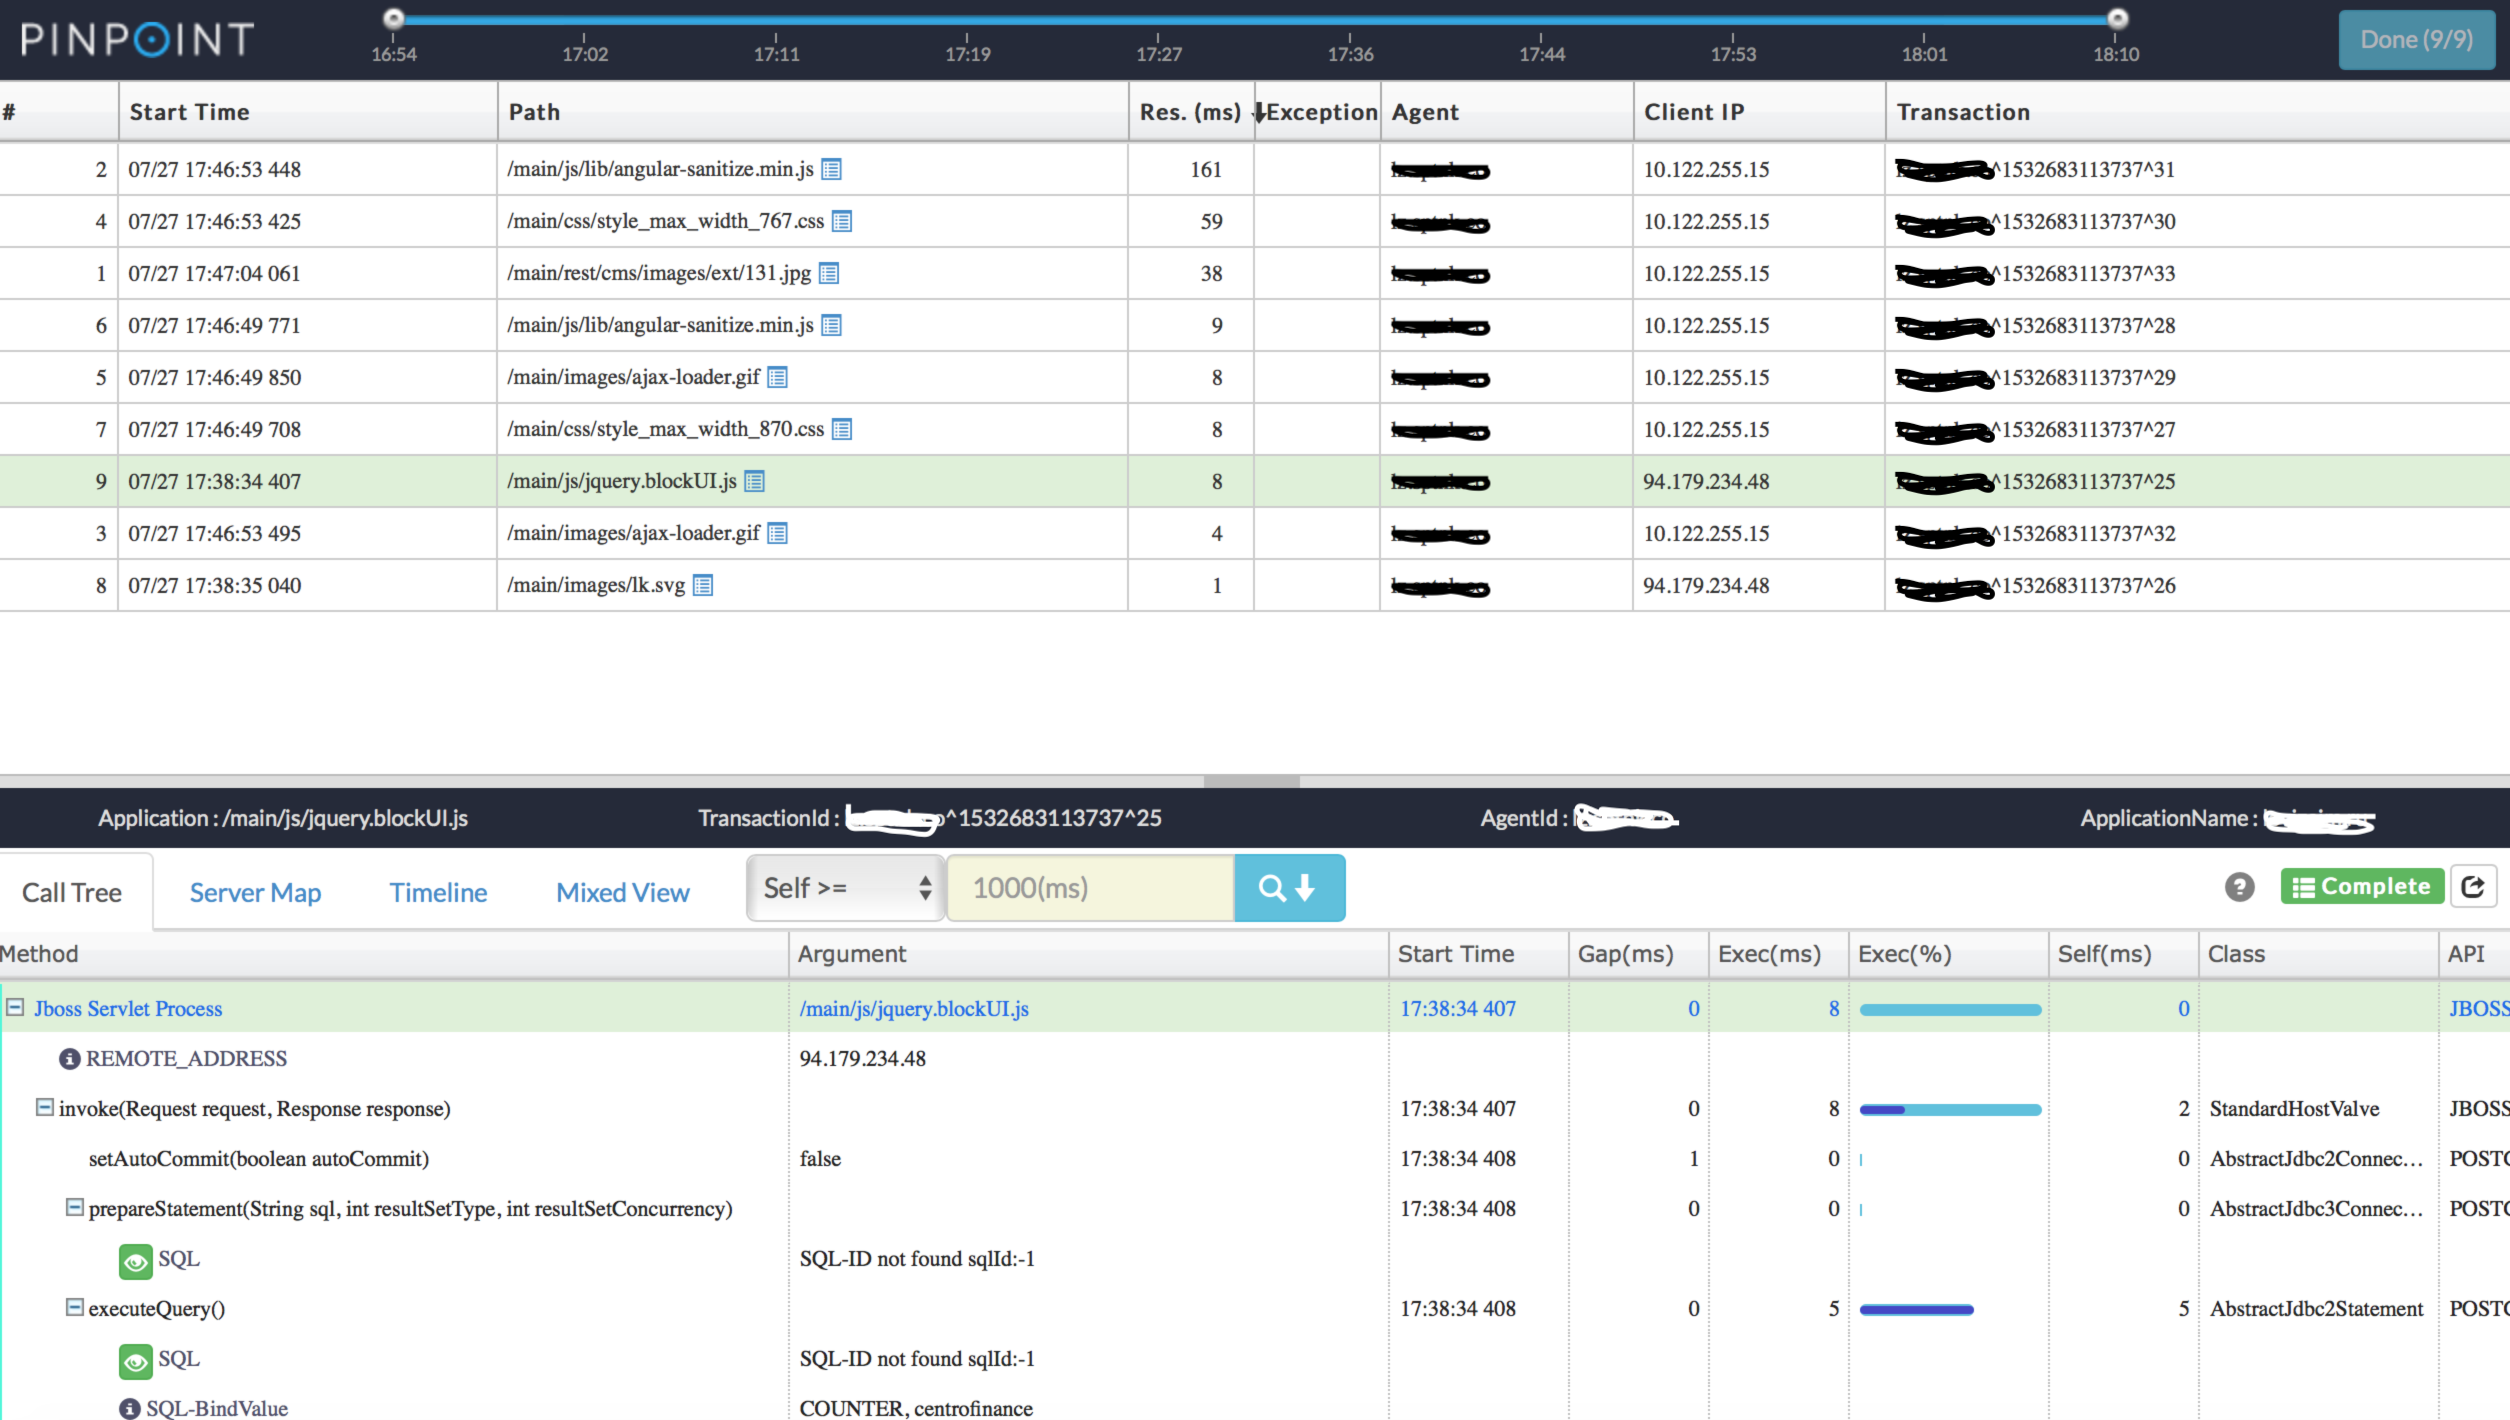
You can examine in detail the transaction and find a bottleneck.
There is an option to display metrics in real time.
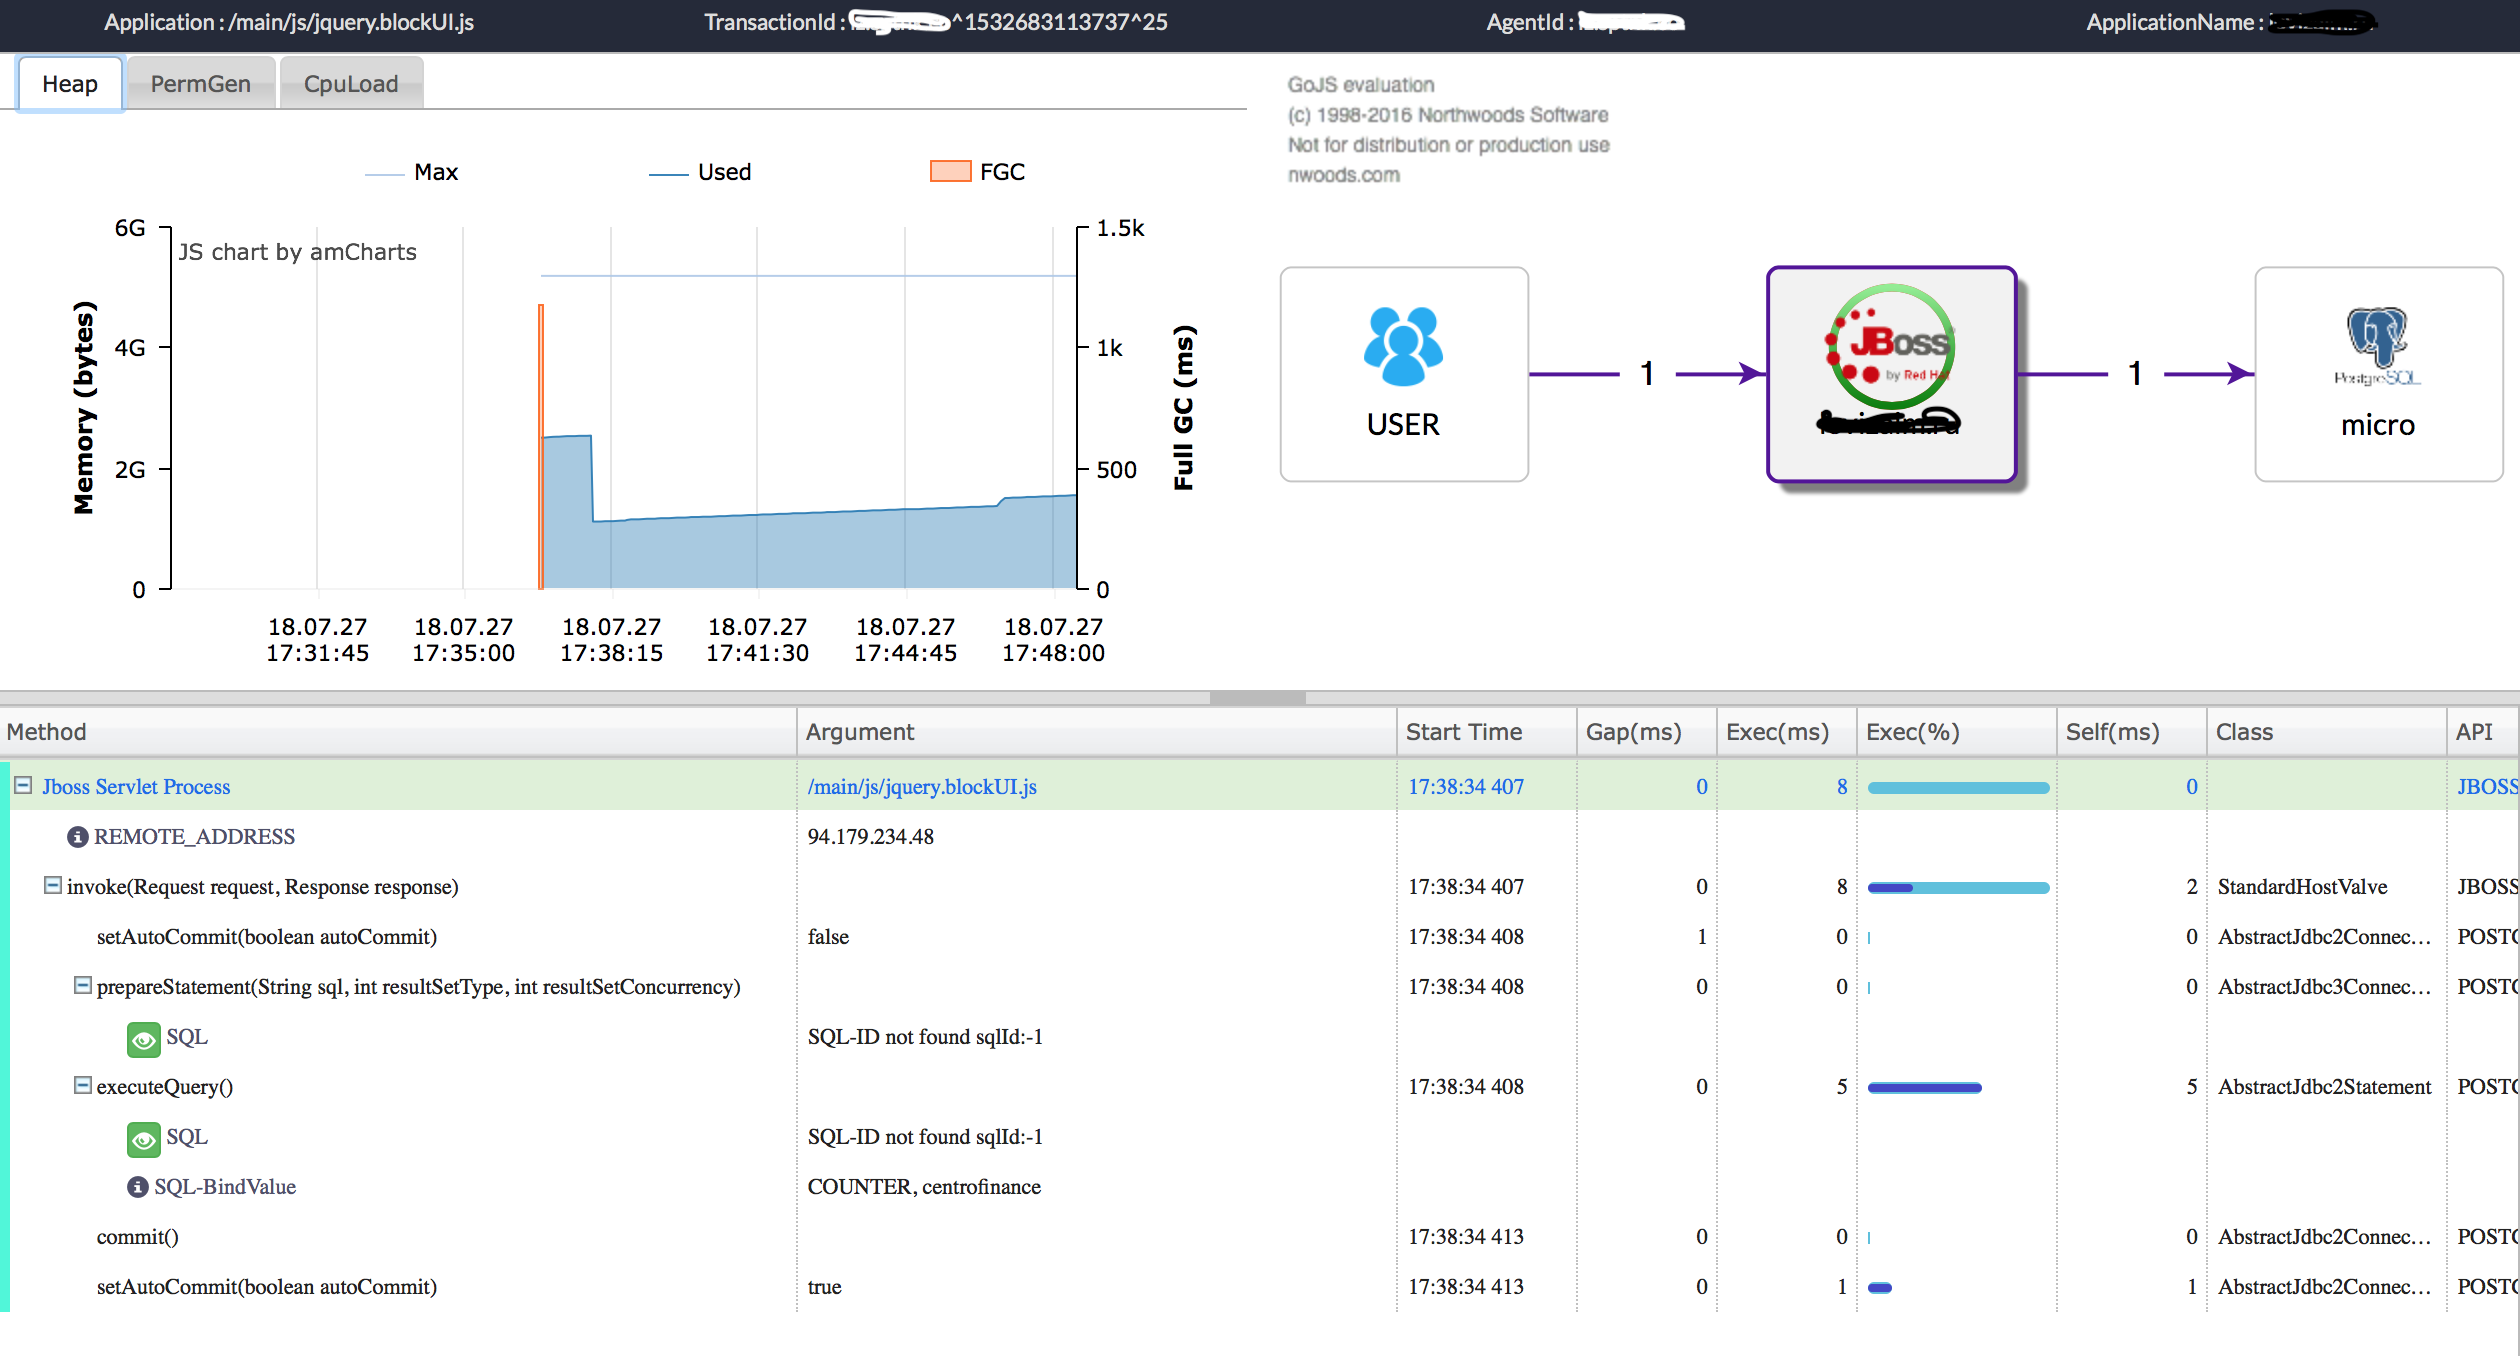
It is possible to examine in detail what was happening at the right time.

Pinpoint is a great tool that is definitely worth having in your arsenal.
Happy Day to the system administrator!