EventTrace for Windows. High-speed network driver debugging
There are various debugging techniques: someone digs into the debugger, someone meditates, waiting for enlightenment, someone frantically changes the code in the hope of luck, but almost no one refuses the file in which the last moments of the process life will be saved, what happened , in what threads, on what kernels, at what time. Carefully and pedantically saved debugging information can save many working hours, especially when it comes to debugging the driver and the hardware with which it works. Well, in the case when the error is random and is reproduced on 1 system of 20 within a week, then without debugging information, meditation can be delayed.
This article will talk about utilities., helping to intercept debug messages of drivers working on several machines simultaneously and send messages to the server for saving and analysis.
EventTrace for Windows technology was first included in Windows 2k and since then it has been a faithful companion of all subsequent OSs, gradually penetrating an increasing number of software: from drivers to user applications.
It's hard to say that it was a breakthrough, but ETW has a highlight - speed. Tens of thousands of debug messages per second from the depths of the driver with a meager effect on performance gives room for the imagination of an engineer. And if we add to this the detail and accuracy of the information received, then life begins to seem cloudless.
Inspired by this feeling, we started to implement. The difficulties started almost immediately, and the name of these difficulties was - TraceView. This utility, designed to receive and view debug messages, stubbornly did not want to do what it was created for.
If the message delivery technology was worked out well enough - ETW easily swallowed tens of thousands, but it didn’t work out with receipt, it seemed that TraceView was created for own needs by a lone engineer in the bowels of the corporation and accidentally ended up in DDK.
After another loss of the results of lengthy tests, it was decided to classify all the difficulties we encountered and look for an alternative that would suit us. Those who want to see the list of reasons can find them under
The search yielded no results, the closest to the requirements was the ETViewer utility , but it did not cover all the necessary needs, moreover, work on it was abandoned and the list of developers is currently empty .
Hopes for a quick solution to our problems have come to naught. To get used to this fact, it took a while, during which we still used TraceView, accumulated strength and ideas.
The idea of independent development was greeted by the leadership of our R&D department with understanding and enthusiasm, however, after compiling a list of tasks and evaluating in parrots, it became obvious that we did not have such free resources. It was about 6 man-months only for the most basic functionality. And, as you know - the appetite comes with eating.
Despite a series of “failures”, I could not throw away and forget the idea. Thus began a series of evenings almost a year long, when, having come from one job, I proceeded to another. As a result of this work, the following applications and libraries were born (source codes are distributed under the Apache 2.0 license ):
What is the highlight of all this stuff? As with ETW , this is speed. It's about millions of debug messages per second for modern home PCs. For example: the duo of I7-870 and a gigabit network can swallow more than 2 million messages of the format:
In addition to the obvious format of the string and parameters, the following data is also transmitted:
The second most important and convenient point is the centralized collection of debug messages. Let me give an example - the company I work for develops both its hardware and almost all layers of software for it. When developing and testing, a huge amount of time is spent on observing a zoo from several glands, drivers and software. Therefore, the ability to centrally monitor vital signs and, in case of failure, restore a detailed picture of what happened is highly valued.
Unfortunately, and perhaps fortunately, I will not be able to fit in one article all the possible information on all components due to my time limitations. Also, an overview of what is under the hood of ETW will be left overboard , but if there is interest, this shortcoming can be filled up with another article.
So in my story I got to the part of it for which it was started. In this chapter, I will talk about how to configure and run the Hangar. It is assumed that you are already familiar with ETW and your driver is already instrumented with similar messages.
The starting point of each ETW session is the Control GUID, one of your source files has similar lines:
We are interested in the value WPP_DEFINE_CONTROL_GUID, which can be written in the form {63423ADB-D156-4281-BA74-8ACAEDDBD810}, remember it - you still need it.
The second most important element that your driver will need is the Trace Message Format File (TMF). The file describes the format of debug messages, and also contains additional information about the message. The easiest way to get this file is to run the following command after successfully building your driver:
The Tracepdb.exe utility is supplied with the DDK, the default path is: C: \ WinDDK \ {Version} \ tools \ tracing \
So, we are armed with a Control GUID and a TMF file - it’s time to edit the Angara configuration file, it is called “Angara.xml” and is located in the same folder as the executable files. Open it with any editor that understands UTF-16, and we can start editing.
The first section that interests us is dedicated to the ETW provider:
There are only two required parameters:
Important but not mandatory parameters are the Flags and Level parameters. They allow you to filter messages that are currently undesirable on the driver side, thereby reducing the load on the ETW and the system as a whole.
The remaining optional parameters are described in sufficient detail in the documentation , as well as in the XML file itself and it is unnecessary to provide a description of them here.
The next section is about network connectivity:
The only required parameter is Address, you must enter the IP address (IPv4 / IPv6) or the symbolic name of the PC on which Baikal is running. Optional parameters are described in detail in the documentation .
The last section is a map on which the conversion of the ETW message level to the message level understandable to Baikal takes place :
Editing this section is only necessary if you have redefined macros in the source code of your driver, for example like this:
In this case, the XML section will take the following form:
That's all, editing the configuration file is finished, you can start to run. In what order you will start Baikal and the Angara - it does not matter, but it is reasonable to launch Baikal first to be able to accept all sent messages, just remember to politely ask your Firewall not to block traffic between the Angara and Baikal .
Starting the Hangar is very simple:
An example of a hangar:
NB : On older operating systems (Windows 2k, XP), the ETW session cannot work stably without an intermediate file, so when starting the Hangar on these OS versions, remember that the Hangar will try to create several temporary files with a total volume of 250 MB to 1 GB, in case failure - the process will end.
The entire graphical interface, or rather, its absence, can be described by the following picture:
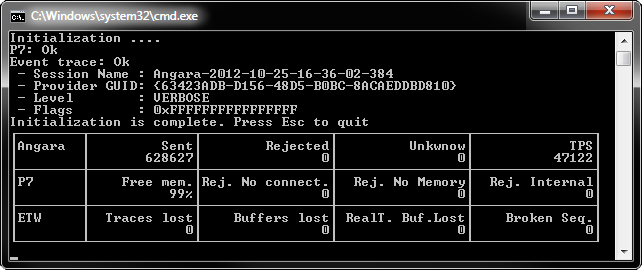
In addition to static information about the session, 12 different counters are provided, a sufficiently large and, at the moment, excess amount of information. They were needed at the stage of active debugging of the program and made it possible to accurately detect the problem place, now this is only a historical relic, which was left with the goal of technical monitoring capability. Counters are divided into 3 groups:
My story ends here, I hope that the utilities presented here will facilitate the difficult but creative life of the developers of drivers and application software.
PS: Project site with source codes and binary files, as well as English help .
PPS: Bai c al is not a random typo.
This article will talk about utilities., helping to intercept debug messages of drivers working on several machines simultaneously and send messages to the server for saving and analysis.
Background
EventTrace for Windows technology was first included in Windows 2k and since then it has been a faithful companion of all subsequent OSs, gradually penetrating an increasing number of software: from drivers to user applications.
It's hard to say that it was a breakthrough, but ETW has a highlight - speed. Tens of thousands of debug messages per second from the depths of the driver with a meager effect on performance gives room for the imagination of an engineer. And if we add to this the detail and accuracy of the information received, then life begins to seem cloudless.
Inspired by this feeling, we started to implement. The difficulties started almost immediately, and the name of these difficulties was - TraceView. This utility, designed to receive and view debug messages, stubbornly did not want to do what it was created for.
If the message delivery technology was worked out well enough - ETW easily swallowed tens of thousands, but it didn’t work out with receipt, it seemed that TraceView was created for own needs by a lone engineer in the bowels of the corporation and accidentally ended up in DDK.
Problem
After another loss of the results of lengthy tests, it was decided to classify all the difficulties we encountered and look for an alternative that would suit us. Those who want to see the list of reasons can find them under
spoiler.
- Work with large files (a file is considered large if the size exceeds 25 megabytes). Opening such a file takes considerable time;
- Loss of service data. Regularly ETW, saving a file, forgets to write a service header. Subsequently, having discovered such a file, one has to meditate for a long time over the hexadecimal editor, restoring the data. This is especially offensive when the file contains error information that could not be reproduced for several days. In Windows 8, they promised to fix this defect;
- In real time, the message viewer only holds 65 thousand. At first glance, this is a lot, but if you imagine that the driver sends at least 1 thousand messages per second, then all you can consider is only 1 minute;
- Copy message text. You can copy the message only in its entirety; there is no way to work with parts of the text;
- Search. He is not there;
- The backlighting is done through the filtering window, the color is selected by its name: for example, “Gray - 50”;
- Filtration. Applying a filter on previously saved data is not a trivial task;
- Profiles Creating a new profile is a tedious and long task, overloaded with settings. You cannot copy profiles using the utility;
The search yielded no results, the closest to the requirements was the ETViewer utility , but it did not cover all the necessary needs, moreover, work on it was abandoned and the list of developers is currently empty .
Hopes for a quick solution to our problems have come to naught. To get used to this fact, it took a while, during which we still used TraceView, accumulated strength and ideas.
Decision
The idea of independent development was greeted by the leadership of our R&D department with understanding and enthusiasm, however, after compiling a list of tasks and evaluating in parrots, it became obvious that we did not have such free resources. It was about 6 man-months only for the most basic functionality. And, as you know - the appetite comes with eating.
Despite a series of “failures”, I could not throw away and forget the idea. Thus began a series of evenings almost a year long, when, having come from one job, I proceeded to another. As a result of this work, the following applications and libraries were born (source codes are distributed under the Apache 2.0 license ):
- Baikal - a server-based framework application to which expansion modules are connected (providers, repositories, viewers);
- Hangar - a client application managing an ETW session , receiving messages and forwarding them to Baikal;
- P7.Trace - C ++ library responsible for processing debug messages of the developed application and transmitting them to Baikal. In essence, this is an ETW replacement that can work on both Windows and Linux;
What is the highlight of all this stuff? As with ETW , this is speed. It's about millions of debug messages per second for modern home PCs. For example: the duo of I7-870 and a gigabit network can swallow more than 2 million messages of the format:
Trace(“Here is my trace and here are my values: %d %d”, iVal1, iVal2);In addition to the obvious format of the string and parameters, the following data is also transmitted:
- Anxiety level (trace, info, warning, error, etc);
- Time accurate to 100 nano seconds;
- The number of the processor on which the code was executed;
- ID of the current thread;
- Module ID;
- Function name, file, line number in the file;
- Serial number;
- Information about the process (name, ID, creation time);
On the side of Lake Baikal, it all looks like this
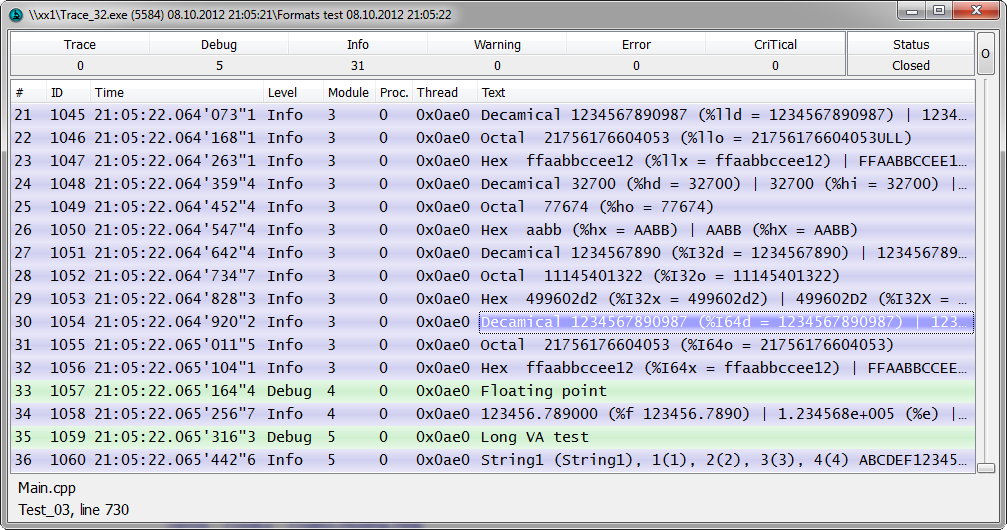
The second most important and convenient point is the centralized collection of debug messages. Let me give an example - the company I work for develops both its hardware and almost all layers of software for it. When developing and testing, a huge amount of time is spent on observing a zoo from several glands, drivers and software. Therefore, the ability to centrally monitor vital signs and, in case of failure, restore a detailed picture of what happened is highly valued.
Unfortunately, and perhaps fortunately, I will not be able to fit in one article all the possible information on all components due to my time limitations. Also, an overview of what is under the hood of ETW will be left overboard , but if there is interest, this shortcoming can be filled up with another article.
Hangar
So in my story I got to the part of it for which it was started. In this chapter, I will talk about how to configure and run the Hangar. It is assumed that you are already familiar with ETW and your driver is already instrumented with similar messages.
ETW session parameters
The starting point of each ETW session is the Control GUID, one of your source files has similar lines:
//{63423ADB-D156-4281-BA74-8ACAEDDBD810}
#define WPP_CONTROL_GUIDS \
    WPP_DEFINE_CONTROL_GUID(ProviderGuid, (63423ADB, D156, 48d5, B0BC, 8ACAEDDBD810),\
    WPP_DEFINE_BIT(DBG_PROVIDER)           /* bit  0 = 0x00000001 */ \
    /* You can have up to 32 defines. If you want more than that,\
    you have to provide another trace control GUID */\
    )
We are interested in the value WPP_DEFINE_CONTROL_GUID, which can be written in the form {63423ADB-D156-4281-BA74-8ACAEDDBD810}, remember it - you still need it.
The second most important element that your driver will need is the Trace Message Format File (TMF). The file describes the format of debug messages, and also contains additional information about the message. The easiest way to get this file is to run the following command after successfully building your driver:
Tracepdb.exe -f MyDriver.pdb -o MyTraceMessageFormatFile.tmf
The Tracepdb.exe utility is supplied with the DDK, the default path is: C: \ WinDDK \ {Version} \ tools \ tracing \
Settings Provider
So, we are armed with a Control GUID and a TMF file - it’s time to edit the Angara configuration file, it is called “Angara.xml” and is located in the same folder as the executable files. Open it with any editor that understands UTF-16, and we can start editing.
The first section that interests us is dedicated to the ETW provider:
There are only two required parameters:
- TMF - the path to the folder with TMF files, which you generated;
- GUID - the same Control GUID;
Important but not mandatory parameters are the Flags and Level parameters. They allow you to filter messages that are currently undesirable on the driver side, thereby reducing the load on the ETW and the system as a whole.
The remaining optional parameters are described in sufficient detail in the documentation , as well as in the XML file itself and it is unnecessary to provide a description of them here.
Settings Network
The next section is about network connectivity:
The only required parameter is Address, you must enter the IP address (IPv4 / IPv6) or the symbolic name of the PC on which Baikal is running. Optional parameters are described in detail in the documentation .
Settings Levels
The last section is a map on which the conversion of the ETW message level to the message level understandable to Baikal takes place :
Editing this section is only necessary if you have redefined macros in the source code of your driver, for example like this:
// Define debug levels
#define     NONE      0 //  Tracing is not on
#define     FATAL      1 // Abnormal exit or termination
#define     ERROR      2 // Severe errors that need logging
#define     WARNING    3  // Warnings such as allocation failure
#define     INFO       4  // Includes non-error cases such as Entry-Exit
#define     TRACE      5 // Detailed traces from intermediate steps
#define     LOUD       6  // Detailed trace from every step
In this case, the XML section will take the following form:
Start
That's all, editing the configuration file is finished, you can start to run. In what order you will start Baikal and the Angara - it does not matter, but it is reasonable to launch Baikal first to be able to accept all sent messages, just remember to politely ask your Firewall not to block traffic between the Angara and Baikal .
Starting the Hangar is very simple:
Angara_32.exe Angara.xml
#либо
Angara_64.exe Angara.xml
An example of a hangar:
NB : On older operating systems (Windows 2k, XP), the ETW session cannot work stably without an intermediate file, so when starting the Hangar on these OS versions, remember that the Hangar will try to create several temporary files with a total volume of 250 MB to 1 GB, in case failure - the process will end.
Appearance
The entire graphical interface, or rather, its absence, can be described by the following picture:
In addition to static information about the session, 12 different counters are provided, a sufficiently large and, at the moment, excess amount of information. They were needed at the stage of active debugging of the program and made it possible to accurately detect the problem place, now this is only a historical relic, which was left with the goal of technical monitoring capability. Counters are divided into 3 groups:
- Main statistics (Angara):
- Send - the number of messages sent
- Rejected - total (for all reasons) the number of messages rejected for sending
- Unknown - the number of unidentified messages, this counter increases every time a message arrives, a description of which cannot be found in TMF files. The possible reason is the lack of the necessary TMF file or the TMF file is outdated (it was not generated after compiling the driver)
- TPS - estimated number of messages sent per second
- Network Statistics (P7):
- Free mem. - percentage of free internal memory.
- Rej. No connect. - the number of messages rejected for sending due to lack of connection to the server (Baikal)
- Rej. No Memory - the number of messages rejected due to lack of memory
- Rej. Internal - the number of messages rejected due to internal failures
- ETW statistics:
- Traces lost - number of lost messages inside ETW
- Buffers lost - the number of buffers lost inside ETW
- RealT. Buf. lost - the number of lost real-time buffers inside ETW
- Broken Seq. - the number of unaccounted ETW losses, monitoring is based on the assumption that the numbers of incoming messages increase linearly by one
Conclusion
My story ends here, I hope that the utilities presented here will facilitate the difficult but creative life of the developers of drivers and application software.
PS: Project site with source codes and binary files, as well as English help .
PPS: Bai c al is not a random typo.