How to understand how much you are worth, or salary clusters in action!
More recently, we have released salary clusters on hh.ru that help us evaluate our value as a specialist. This is a rather interesting and flexible feature, such that with its help it is even possible to conduct a small study of the labor market, determining its place in it:
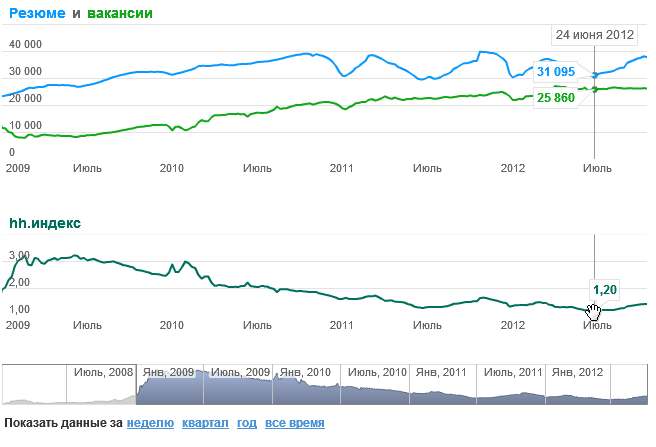
Now job seekers rule the IT market: just open your resume and you will immediately receive a mountain of offers. Our hh.index , which shows the ratio of the number of resumes to the number of vacancies, in the field of information technology in July fell across Moscow to a record value of 1.2 (at the peak in 2009, its value rose above 3):
In a situation where there are a lot of interesting offers, the main question for an IT specialist and, in particular, a programmer is choosing the best of them. And one of the main criteria here is salary.
Search clustering is an information tool for refining (narrowing) a query in search results. There are several clusters on hh.ru on the main parameters of the vacancy. The last one put into operation just allows you to narrow the search by salary:
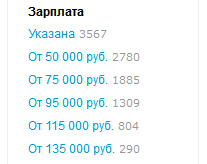 Salary clusters are built automatically based on a search query. All found vacancies are divided into 6 clusters with an indication of salaries and the number of open vacancies in the cluster. Accordingly, it is possible, by choosing a specific cluster, to look at the vacancies from it and recursively break them into smaller clusters.
In addition to the function of narrowing the search, salary clusters carry a serious information component. With their help, any user can make their own brief overview of the labor market for any search query.
For example, let's see how many vacancies are open on hh.ru for programmers in Russia:
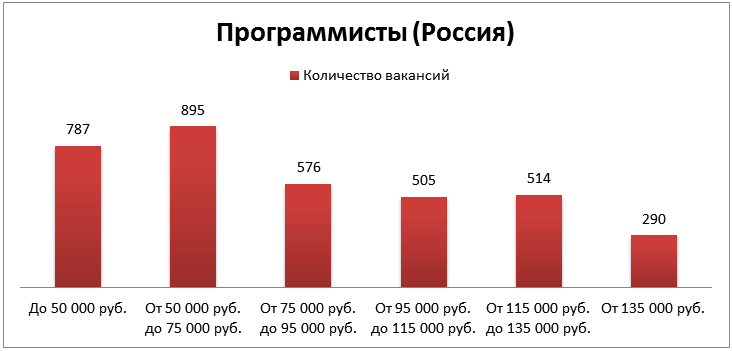
I recalculated the number of vacancies for a certain period for salaries “from” and “to”. On the site, all clusters are considered “from”, since the applicant is usually interested in proposals on which specific amount.
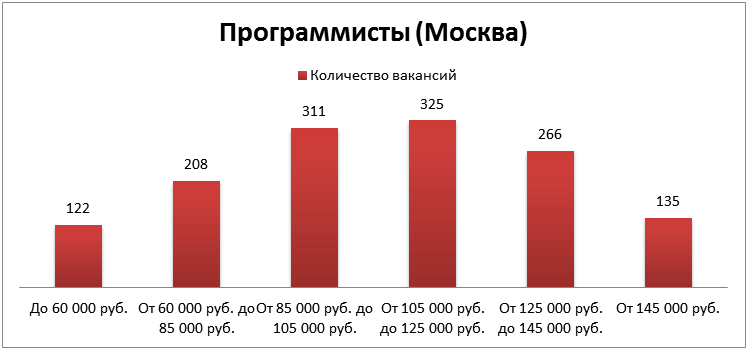
Our partners and competitors offer statistics by region. There is no problem, just select the appropriate region in the search, for example, Moscow and get the picture that I posted before the habrakat:

Clusters are visualized here, in which the distribution of salaries already looks normal. In the first histogram, which displays data for Russia as a whole, in fact, the normal distribution is eroded by the difference in salaries between the capital and the regions, as a result, the first two clusters are so large.
In St. Petersburg, the distribution of salaries is similar:
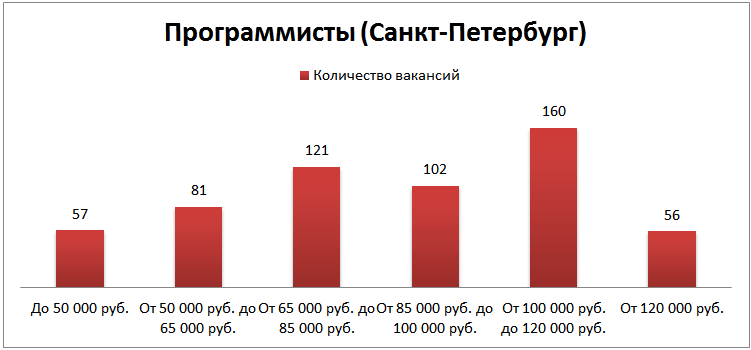
Accordingly, we can make a number of interesting hypotheses, in particular, we can assume (which is confirmed by looking at vacancies for specific clusters):
The main advantage of this study is that we see the distribution of salaries, and not just the average salary, which is as useful as the average temperature in the hospital.
Now, each of the readers can try to correlate their salary and position, and employers can assess how much their salaries correspond to the market situation.

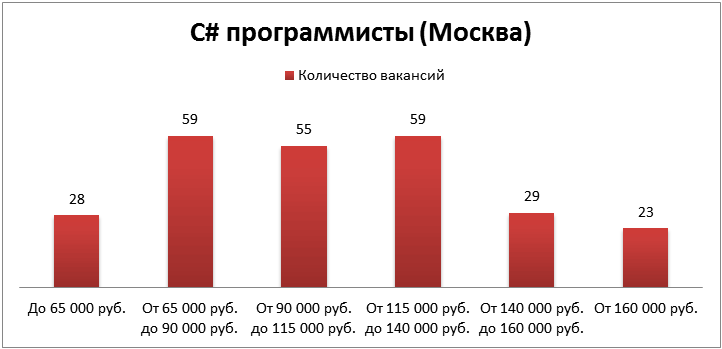
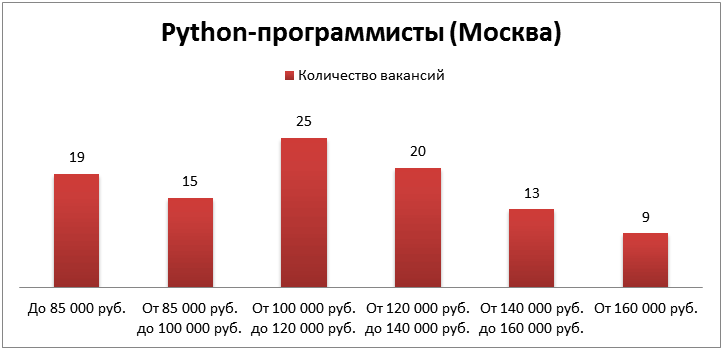
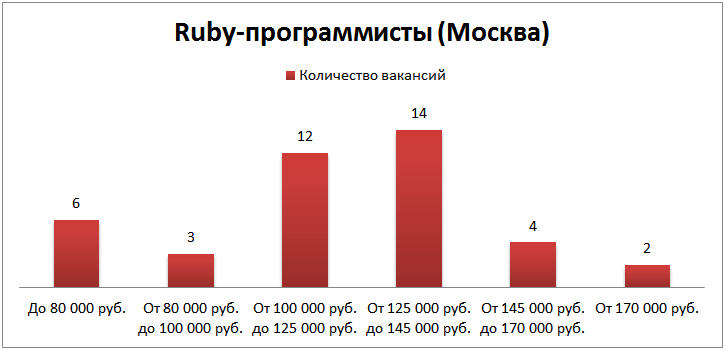
“Well, they promised something interesting and related to a specific person, but they talk about some kind of spherical programmer in a vacuum,” the shrewd reader will say and he will be right. In the next stage of our little research, we will see how much this or that programming language costs. To do this, I will use queries with the name of the corresponding programming language with a search by the description and name of the vacancy (to build past histograms, I used the search only to the name of the vacancy). This approach slightly reduces the accuracy, because quite often in the vacancies indicate the desired programming languages, i.e. actual results will be slightly lower. I do not parse requests for HTML, JavaScript, and the like, because these words are often specified as an additional option.
I chose Default City as the research city, as the largest in terms of the number of programmer vacancies. I chose programming languages at my own discretion with a focus on the desktop / server side, so that it could be, then associated with the DBMS. But all selected languages are in the top 10 according to TIOBE.


Now let's try the last aerobatics: add additional technology, for example, a database, to programming languages. Here I will slightly reduce the list of programming languages, since not everyone has suitable vacancies, and I will indicate salaries in thousands in rubles through a slash. Search queries corresponded to the names of the programming language and database (in the latter case, “NoSQL”): You

can use this matrix not only to understand your value, but also to plan your career. For example, suppose I am an average PHP developer and work with a standard MySQL database. If I study and gain experience in PostgreSQL well, I can apply for a salary of at least 15,000 rubles a month more.
All of the above studies can be repeated (and improved) in their region, programming language, technology and so on.

Now job seekers rule the IT market: just open your resume and you will immediately receive a mountain of offers. Our hh.index , which shows the ratio of the number of resumes to the number of vacancies, in the field of information technology in July fell across Moscow to a record value of 1.2 (at the peak in 2009, its value rose above 3):

In a situation where there are a lot of interesting offers, the main question for an IT specialist and, in particular, a programmer is choosing the best of them. And one of the main criteria here is salary.
Payroll clusters
Search clustering is an information tool for refining (narrowing) a query in search results. There are several clusters on hh.ru on the main parameters of the vacancy. The last one put into operation just allows you to narrow the search by salary:
 Salary clusters are built automatically based on a search query. All found vacancies are divided into 6 clusters with an indication of salaries and the number of open vacancies in the cluster. Accordingly, it is possible, by choosing a specific cluster, to look at the vacancies from it and recursively break them into smaller clusters.
 In addition to the function of narrowing the search, salary clusters carry a serious information component. With their help, any user can make their own brief overview of the labor market for any search query.
For example, let's see how many vacancies are open on hh.ru for programmers in Russia:

I recalculated the number of vacancies for a certain period for salaries “from” and “to”. On the site, all clusters are considered “from”, since the applicant is usually interested in proposals on which specific amount.
Our partners and competitors offer statistics by region. There is no problem, just select the appropriate region in the search, for example, Moscow and get the picture that I posted before the habrakat:

Clusters are visualized here, in which the distribution of salaries already looks normal. In the first histogram, which displays data for Russia as a whole, in fact, the normal distribution is eroded by the difference in salaries between the capital and the regions, as a result, the first two clusters are so large.
In St. Petersburg, the distribution of salaries is similar:

Accordingly, we can make a number of interesting hypotheses, in particular, we can assume (which is confirmed by looking at vacancies for specific clusters):
- Junior's fall into cluster 1 and 2;
- Cluster 3 and 4 are Regular Developper;
- in clusters 5 and 6 are Senior Developper.
The main advantage of this study is that we see the distribution of salaries, and not just the average salary, which is as useful as the average temperature in the hospital.
Now, each of the readers can try to correlate their salary and position, and employers can assess how much their salaries correspond to the market situation.
Diving deeper

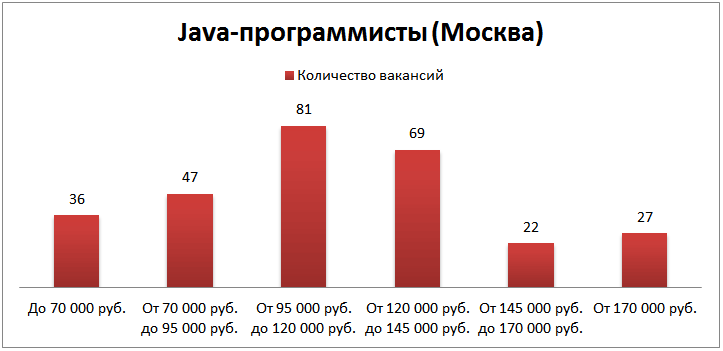
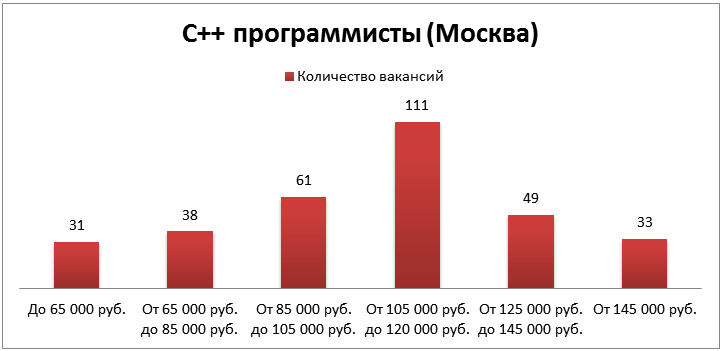
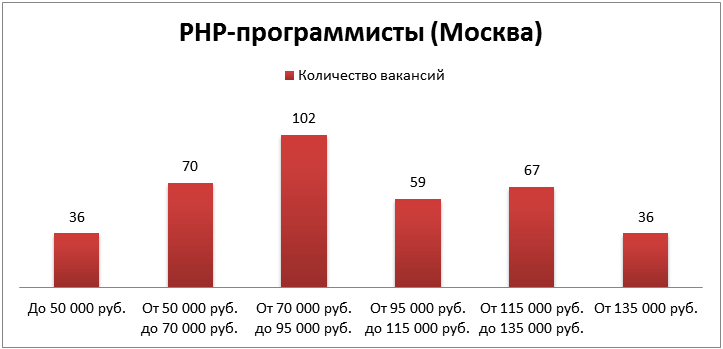
“Well, they promised something interesting and related to a specific person, but they talk about some kind of spherical programmer in a vacuum,” the shrewd reader will say and he will be right. In the next stage of our little research, we will see how much this or that programming language costs. To do this, I will use queries with the name of the corresponding programming language with a search by the description and name of the vacancy (to build past histograms, I used the search only to the name of the vacancy). This approach slightly reduces the accuracy, because quite often in the vacancies indicate the desired programming languages, i.e. actual results will be slightly lower. I do not parse requests for HTML, JavaScript, and the like, because these words are often specified as an additional option.
I chose Default City as the research city, as the largest in terms of the number of programmer vacancies. I chose programming languages at my own discretion with a focus on the desktop / server side, so that it could be, then associated with the DBMS. But all selected languages are in the top 10 according to TIOBE.
Java

C ++

Php

C #

Python

Ruby

Perl

Build a matrix or add a second dimension

Now let's try the last aerobatics: add additional technology, for example, a database, to programming languages. Here I will slightly reduce the list of programming languages, since not everyone has suitable vacancies, and I will indicate salaries in thousands in rubles through a slash. Search queries corresponded to the names of the programming language and database (in the latter case, “NoSQL”): You

can use this matrix not only to understand your value, but also to plan your career. For example, suppose I am an average PHP developer and work with a standard MySQL database. If I study and gain experience in PostgreSQL well, I can apply for a salary of at least 15,000 rubles a month more.
All of the above studies can be repeated (and improved) in their region, programming language, technology and so on.
