The theory of happiness. The law of watermelon peel and the normality of abnormality
I present to the court of Habr's readers the unordered chapters from my book “The Theory of Happiness” with the subtitle “Mathematical foundations of the laws of meanness”. This is not a published popular science book, very informally telling how mathematics allows you to look at the world and life of people with a new degree of awareness. It is for those who are interested in science and for those who are interested in life. And since our life is complex and, by and large, unpredictable, the emphasis in the book is mainly on probability theory and mathematical statistics. Here theorems are not proved and the fundamentals of science are not given; this is by no means a textbook, but what is called recreational science. But it is this almost playful approach that allows us to develop intuition, brighten up lectures for students with vivid examples, and finally explain to nemathematicians and our children,
In this chapter, we begin with an analysis of watermelons and their crusts, find out their connection with the famous Murphy's law and make sure with all the severity that tastes differ.
How often, looking at news, or reading comments to them, we are perplexed: “Are there normal people in this world ?!” It seems that they should be, because there are many of us, and on average, we should be normal. But at the same time the sages say that each of us is unique. And adolescents are sure that they certainly differ from the gray mass of “normal people” and are not similar to anyone.
Readers familiar with the statistics have, of course, seen many times how for different asymmetric mode distributions (maximum on the probability density graph) does not coincide with the mean or mathematical expectation. That is, the average value does not correspond to the highest probability density, but still, it is expected to be, if not already the most frequent, then at least dominant. However, not all so simple. So far, we have considered single-variant distributions — distributions in a one-dimensional outcome space. But life is multifaceted, and certainly not one-dimensional! And with the addition of extra dimensions, quite unexpected things can happen.
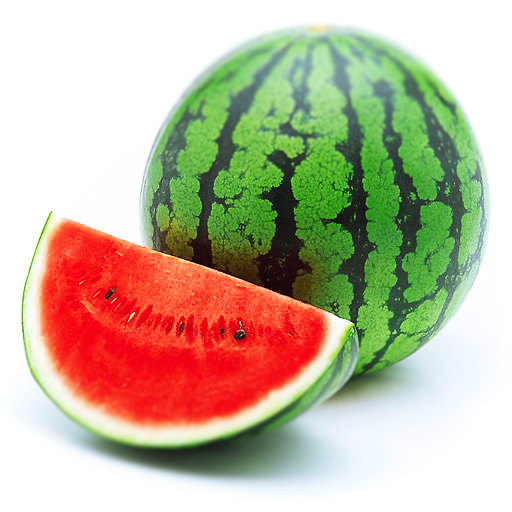
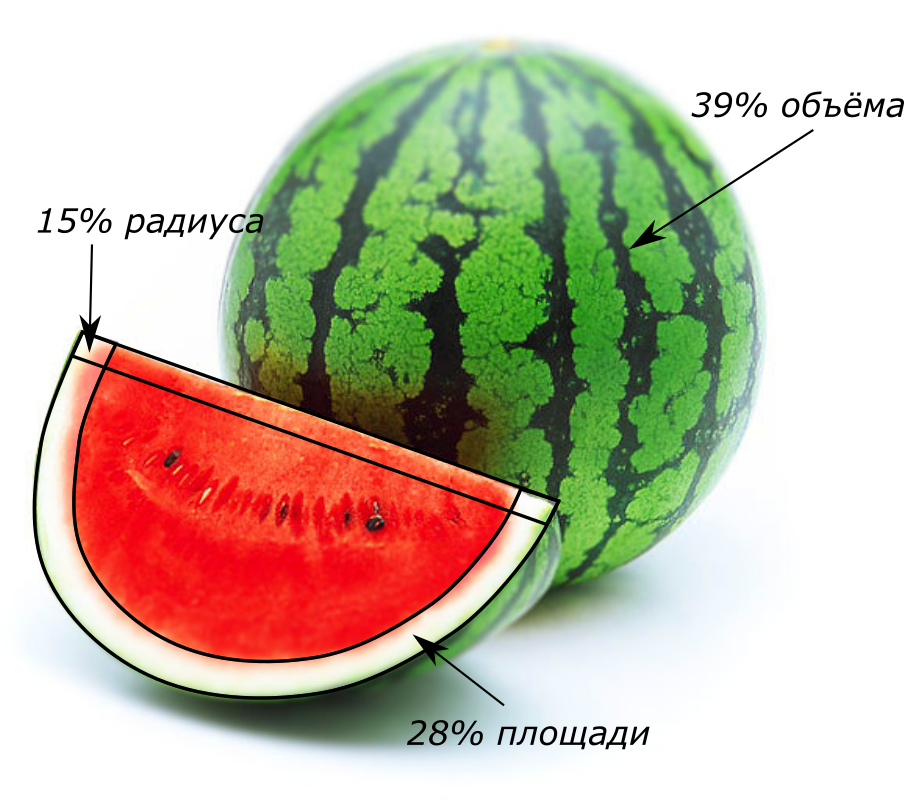
One of the features of multidimensional geometry is an increase in the share of boundary values in a limited volume. This is what is meant. Consider the classical problem of watermelon in spaces with different dimensions and set the goal to find out how much wonderful sugar pulp we get from this huge, strong and appetizing watermelon, if we cut it, we found out that the thickness of its peel does not exceed from its radius? It seems thatit hurts a lot, but look at the picture at the beginning of the article; perhaps, we consider the watermelon with such proportions quite acceptable.
Let's start with a one-dimensional watermelon - it's a pink column, and its peel consists of two small white pieces at the edges. The total length of the peel - this is an analogue of the volume in a one-dimensional world - will befrom the total length of the watermelon. In a two-dimensional, pancake-shaped watermelon, the crust in the form of a white ring will be less in area than its inner part, only three times. In the usual three-dimensional world of us, such a crust will be almost total volume. Feels trick.
 Shares, which takes the crust in watermelon of various dimensions.
For a ball, as well as for a body of arbitrary shape, it is possible to obtain the dependence of the ratio of the volume of the crust to the total volume of the body. It is expressed through the ratio of the thickness of the crust to the characteristic size of the body. and is an exponential function of the dimension of space
  :
:
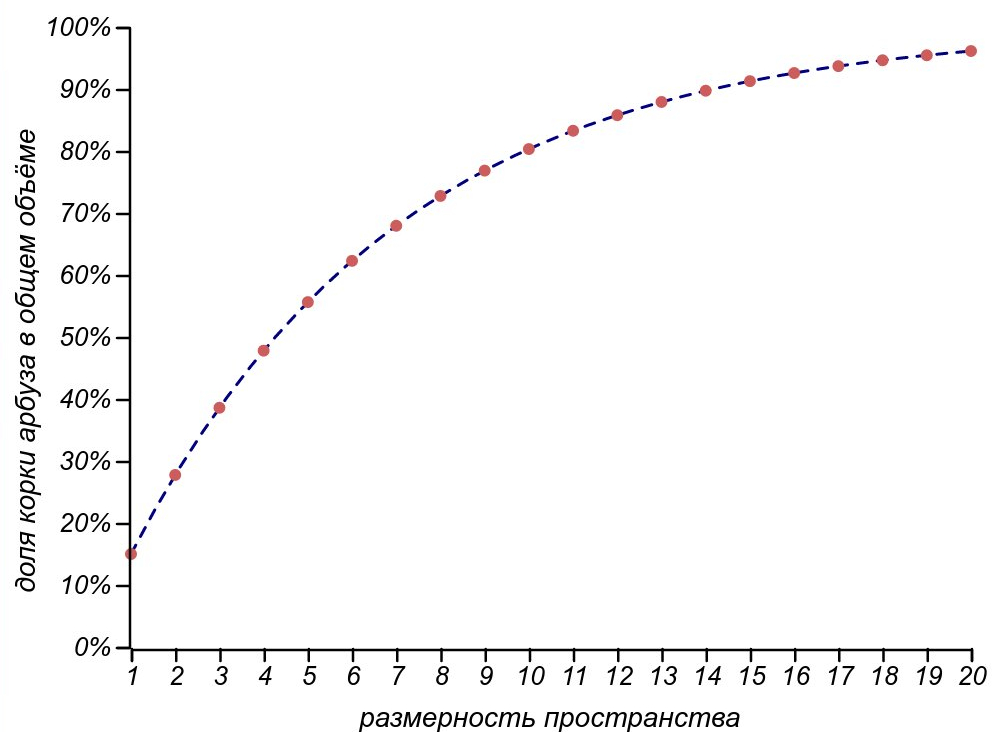
In the four-dimensional space, our conditionally thin-melted watermelon will leave us only half of the pulp, and in the eleven-dimensional world we can only eat from the whole watermelon, throwing away the crust, constituting its radius!
So, we are ready to formulate the profound law of watermelon peel :
It's a shame, of course, but what does this have to do with the normality of our world and the laws of meanness? Alas, it is he who hinders the search for the so-called "golden mean", devalues the results of opinion polls and enhances the role of unlikely trouble.
The fact is that the space of people with all their parameters is essentially multidimensional. It is possible to consider completely independent dimensions as obvious height, weight, age and wealth, as well as levels of intellectual (IQ) and emotional (EQ) development, finally, observable, though poorly formalized facial features, or character traits, such as level of gab, stubbornness or amorousness. We can easily count about a dozen and a half parameters characterizing a person. And for each of these parameters, there is a certain statistically defined “norm” - the most expected one and, what's more, a frequently observed value. How many in this rich parameter space will there be people who are typical in all respects? The expression we used to calculate the ratio of the volume of the peel and watermelon, can be used to calculate the probability to get into the number of at least something but “abnormal” people. Indeed, the probability to satisfy all the criteria of typicality at the same time is equal to the product of probabilities to be typical for each criterion separately.
Now we will greatly simplify the task in order not to write scary formulas by which nothing can be properly calculated. Suppose that the qualities of people in each of the areas are subject to the normal (Gaussian) distributionaround some mean. This is, of course, extremely bold, but quite reasonable for our purposes, because we are not talking about any particular set of characteristics, but, frankly, we fantasize, trying to formulate at least something definite in such a shaky topic. Therefore, to load the details until it is visible the most common picture, too early. So, we have subordinated all the criteria to the normal distribution with its means and variances. So, we can determine the parameters of the most typical person in the world, and measure deviations from them. In addition, it does not matter to us what specific values of variance each criterion will have, since we are only interested in the probability of going beyond the standard deviation, and this value does not depend on the scale of the distribution itself. All this leads to the fact that if denoted by the probability to be outside the area bounded by the standard deviation (to be in the outer “crust” of the distribution, rather than the watermelon crust, but to the Earth’s atmosphere reaching far into space, becoming thinner and thinner), then the probability of being in something abnormal when considered criteria will be calculated by the "watermelon" formula:
 where
where  - standard deviation.
 The chances of being “abnormal” for a different number of comparison criteria and for different “severity” of the norm determination. The top and bottom plots are different in that when defining “normality” they use a radius of one and two standard deviations, respectively.
Well, it turns out that it is normal to be at least something abnormal. Evaluating people by the top ten parameters, be prepared for the fact that only 2% of the total population will be completely ordinary. Moreover, as soon as we find them, they will immediately become celebrities, losing their mediocrity!
One of the classic laws of meanness, formulated in the hearts of engineer Edward Murphy, says:
Let it be necessary to perform a series of actions to do some work, and for each of them there is a small probability of failure. What is the probability that everything will pass without a hitch without a hitch? It's simple - you need to multiply the probabilities of success for all steps. And then the law of the watermelon crust is turned on: the greater the number of steps, the more important is the role of borders, in our case, emergency situations. Dozens of steps are enough for 5% of the probability of error on each of them to increase to 50% of the probability of failure of the whole case! The same applies to complex systems with many parts, each of which may fail. In the simplest case, the probability of system failure is calculated from the probability of failure of each of its parts according to the same law of watermelon peel.
Our reasoning is extremely simple, and Murphy's law is more emotional than objective and seems like a truism, but still, it was from this observation that a new big science began in the forties or fifties of the twentieth century: the theory of reliability. She added time, interrelation of system elements, economics, as well as the human factor, and found application beyond engineering: in economics, control theory and, finally, in programming.
We will return to this topic when we study the law of the last day , which causes the printer to act up precisely on the day of the project. The law of Murphy with regard to time is truly a terrible force! For now, let us return to the topic of uniqueness and normality.
We are all different, this is understandable, but is it even possible to raise the question of compliance with a certain norm, are we trying to evaluate and compare? You ask, what's wrong with that? We all the time someone compare with someone, most often, ourselves with others, but sometimes we allow to evaluate someone else. However, from the point of view of mathematics, everything is not so simple.
To compare is to determine the order relation. That is, to designate that one element of a certain set, in a sense, precedes the other. We learned this at school: 2 less than 20, an elephant is weaker than a whale, a contract is more valuable than money, etc. But here are some questions for you. What goes before Monday or Tuesday? Is it Sunday or Monday? And what Sunday is that before Monday, or that after Saturday? And which number is greater: 2 + 3i or 3 + 2i? We can call in order the colors of the rainbow and even associate all intermediate colors with a real number — the frequency of light, but apart from these colors there are many non-spectral colors, they form a color circle well known to printers and designers, is it possible to arrange all the colors visible to the eye in order? These examples show that there are difficulties with the attitude of order. For example, transitivity does not work on many days of the week (from follows
  but for follows
  does not follow that always follows ). Attempting to introduce the concept of more / less in the field of complex numbers is inconsistent with the arithmetic of these numbers, and the colors have both of these disadvantages.
And how can you compare people, books, dishes, programming languages and other objects that have many parameters, even if they are conventionally formalized? In principle, it is possible, but only first agreeing on definitions and metrics, otherwise it will be an endless, turbulent and meaningless argument. Alas, heated debates arise most often already at the stage of selecting metrics, since they themselves form a certain set, on which the order relation also needs to be determined.
However, it is possible to offer a quite sensible and unambiguous way of talking about the comparability of multidimensional objects, for example, people. In a multidimensional parameter space, each object can be represented by a vector — a set of numbers — the values of the criteria that characterize it. Considering the ensemble of vectors (for example, human society), we will see that some of them will be co-directed, or at least close in directions, so they can already be compared in length. At the same time, some vectors will be orthogonal (in a geometrical sense - perpendicular, in a wider sense - independent), and the people corresponding to them will be simply incomprehensible to each other: they will turn out in conjugate spaces in a number of parameters, like the notorious physicists and lyricists. It makes no sense to talk about that a good poet is better or worse than a talented engineer or nature-endowed athlete. The only thing that can be judged is the length of the vector - the degree of endowments, the distance from the average.
In this connection, a curious question may arise: what proportion of random vectors in the space of a given dimension will be co-directed, and what proportion will be orthogonal? How many will be able to find like-minded people or, at least, those with whom you can compare yourself?
In a two-dimensional world, each vector corresponds to a one-dimensional space of collinear (c) and one-dimensional space of orthogonal vectors. If we consider “almost” codirectional and “almost” orthogonal vectors, then they form sectors of the same area with the same choice of tolerance. That is, similar and unlike objects, when considering the two criteria, there will be the same number.

Almost collinear and almost orthogonal vectors in two-dimensional and three-dimensional space.
In the three-dimensional world, the picture will change. The codirectional vectors still form one-dimensional space, but the orthogonal vectors already fill the plane — two-dimensional space. Fixing the length of vectors and allowing a slight deviation from the ideal directions at an angle
  , it is possible to compare the number of almost codirected vectors with the area of circular areas around the poles
  , and the number of almost orthogonal vectors - with an area of a strip around the equator:
  . Their attitude
 while reducing the deviation grows unlimited.
In the four-dimensional world, orthogonal vectors form already three-dimensional space, while the co-directed vectors still lie in one-dimensional, and the difference in their number grows in proportion to the square of the deviation from the ideal. But at this stage it is better to turn to the theory of probability and find out what are the chances of getting orthogonal or codirectional vectors, taking at random two vectors from the space, dimension? This will tell us the distribution of angles between random vectors. Fortunately, talking about the areas of multidimensional spheres, it can be calculated analytically and presented in the final form: Is a gamma function, a generalization of factorial to real (and even complex) numbers.
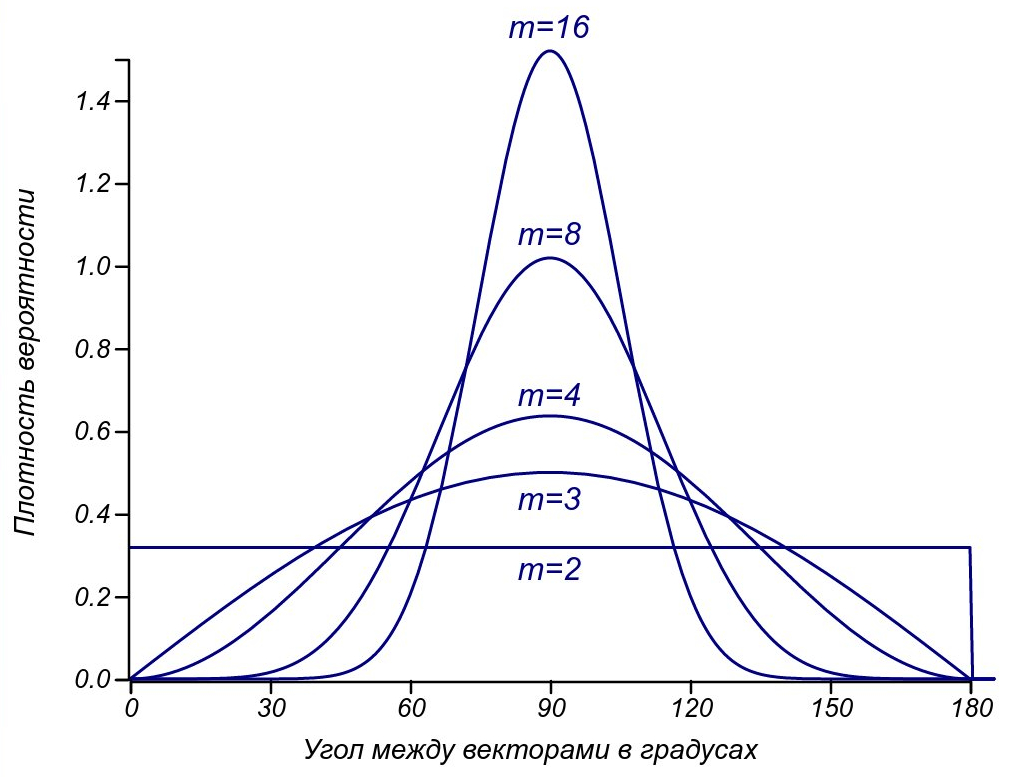 The distributions of the angles of random vectors for spaces of different dimensions.
Now it is clear that for two-dimensional space the angles are distributed evenly, for three-dimensional - in proportion to the sinusoidal function, and as the dimension increases, the distribution tends to normal with constantly decreasing dispersion. For all dimensions above two, the mode of distribution is 90 degrees and the proportion of mutually orthogonal vectors increases as the number of parameters increases. The most important observation is that the co-directed vectors (having an angle of about 0 or 180 degrees practically do not remain at a sufficiently high dimension of space. Let's consider vectors more or less similar (co-directional, comparable) that have an angle less than 30 degrees (this is quite a small angle: ). Then, when comparing by two criteria similar to some selected vector, only one third of all random vectors will turn out. The use of three criteria will allow to compare with a given vector only
 of the whole set, for the four criteria - already
  , and each subsequent addition of the dimension will halve this fraction. If we are stricter and limit ourselves to a smaller angle, the proportion of vectors considered similar will decrease even faster.
Thus, we obtain the vector formulation of the law of watermelon peel:
or equivalent: the taste and color of comrades is not.
Compare reasonably, do not look for normality in life and do not be afraid of abnormality. Mathematics itself tells us that in a complex world of people one can only speak about the degree of similarity, but not about comparison. So there is no reason to carry on endless disputes, in search of truth, instead, you should listen and try to hear a different opinion, see the view from another, conjugate, space, thereby enriching your perception of the world.
The sages are right: we are all unique and in their uniqueness are absolutely the same.
I invite you, the first readers of this book, to questions, additions and comments that, no doubt, make it more accurate, richer and more interesting.
Published chapters:
• Введение в мерфологию
• Случайности случайны?
• Головокружительный полёт бутерброда с маслом
• Закон арбузной корки и нормальность ненормальности
• Закон зебры и чужой очереди
• Проклятие режиссёра и проклятые принтеры
• Термодинамика классового неравенства
• Случайности случайны?
• Головокружительный полёт бутерброда с маслом
• Закон арбузной корки и нормальность ненормальности
• Закон зебры и чужой очереди
• Проклятие режиссёра и проклятые принтеры
• Термодинамика классового неравенства
In this chapter, we begin with an analysis of watermelons and their crusts, find out their connection with the famous Murphy's law and make sure with all the severity that tastes differ.
It seems to me alone that I am normal?
How often, looking at news, or reading comments to them, we are perplexed: “Are there normal people in this world ?!” It seems that they should be, because there are many of us, and on average, we should be normal. But at the same time the sages say that each of us is unique. And adolescents are sure that they certainly differ from the gray mass of “normal people” and are not similar to anyone.
Readers familiar with the statistics have, of course, seen many times how for different asymmetric mode distributions (maximum on the probability density graph) does not coincide with the mean or mathematical expectation. That is, the average value does not correspond to the highest probability density, but still, it is expected to be, if not already the most frequent, then at least dominant. However, not all so simple. So far, we have considered single-variant distributions — distributions in a one-dimensional outcome space. But life is multifaceted, and certainly not one-dimensional! And with the addition of extra dimensions, quite unexpected things can happen.
One of the features of multidimensional geometry is an increase in the share of boundary values in a limited volume. This is what is meant. Consider the classical problem of watermelon in spaces with different dimensions and set the goal to find out how much wonderful sugar pulp we get from this huge, strong and appetizing watermelon, if we cut it, we found out that the thickness of its peel does not exceed
from its radius? It seems thatit hurts a lot, but look at the picture at the beginning of the article; perhaps, we consider the watermelon with such proportions quite acceptable. Let's start with a one-dimensional watermelon - it's a pink column, and its peel consists of two small white pieces at the edges. The total length of the peel - this is an analogue of the volume in a one-dimensional world - will be
from the total length of the watermelon. In a two-dimensional, pancake-shaped watermelon, the crust in the form of a white ring will be less in area than its inner part, only three times. In the usual three-dimensional world of us, such a crust will be almosttotal volume. Feels trick.For a ball, as well as for a body of arbitrary shape, it is possible to obtain the dependence of the ratio of the volume of the crust to the total volume of the body. It is expressed through the ratio of the thickness of the crust to the characteristic size of the body.
and is an exponential function of the dimension of space : 
In the four-dimensional space, our conditionally thin-melted watermelon will leave us only half of the pulp, and in the eleven-dimensional world we can only eat
from the whole watermelon, throwing away the crust, constituting its radius! So, we are ready to formulate the profound law of watermelon peel :
Buying a multi-dimensional watermelon, you acquire, basically, its peel.
It's a shame, of course, but what does this have to do with the normality of our world and the laws of meanness? Alas, it is he who hinders the search for the so-called "golden mean", devalues the results of opinion polls and enhances the role of unlikely trouble.
The fact is that the space of people with all their parameters is essentially multidimensional. It is possible to consider completely independent dimensions as obvious height, weight, age and wealth, as well as levels of intellectual (IQ) and emotional (EQ) development, finally, observable, though poorly formalized facial features, or character traits, such as level of gab, stubbornness or amorousness. We can easily count about a dozen and a half parameters characterizing a person. And for each of these parameters, there is a certain statistically defined “norm” - the most expected one and, what's more, a frequently observed value. How many in this rich parameter space will there be people who are typical in all respects? The expression we used to calculate the ratio of the volume of the peel and watermelon, can be used to calculate the probability to get into the number of at least something but “abnormal” people. Indeed, the probability to satisfy all the criteria of typicality at the same time is equal to the product of probabilities to be typical for each criterion separately.
Now we will greatly simplify the task in order not to write scary formulas by which nothing can be properly calculated. Suppose that the qualities of people in each of the areas are subject to the normal (Gaussian) distributionaround some mean. This is, of course, extremely bold, but quite reasonable for our purposes, because we are not talking about any particular set of characteristics, but, frankly, we fantasize, trying to formulate at least something definite in such a shaky topic. Therefore, to load the details until it is visible the most common picture, too early. So, we have subordinated all the criteria to the normal distribution with its means and variances. So, we can determine the parameters of the most typical person in the world, and measure deviations from them. In addition, it does not matter to us what specific values of variance each criterion will have, since we are only interested in the probability of going beyond the standard deviation, and this value does not depend on the scale of the distribution itself. All this leads to the fact that if denoted by
the probability to be outside the area bounded by the standard deviation (to be in the outer “crust” of the distribution, rather than the watermelon crust, but to the Earth’s atmosphere reaching far into space, becoming thinner and thinner), then the probability of being in something abnormal when considered criteria will be calculated by the "watermelon" formula:
where - standard deviation. Well, it turns out that it is normal to be at least something abnormal. Evaluating people by the top ten parameters, be prepared for the fact that only 2% of the total population will be completely ordinary. Moreover, as soon as we find them, they will immediately become celebrities, losing their mediocrity!
The same law meanness
One of the classic laws of meanness, formulated in the hearts of engineer Edward Murphy, says:
"Anything that can go wrong will go wrong."It is somewhat deeper than the trivial assertion that all outcomes, even the most unlikely, are observed in the full sample.
Let it be necessary to perform a series of actions to do some work, and for each of them there is a small probability of failure. What is the probability that everything will pass without a hitch without a hitch? It's simple - you need to multiply the probabilities of success for all steps. And then the law of the watermelon crust is turned on: the greater the number of steps, the more important is the role of borders, in our case, emergency situations. Dozens of steps are enough for 5% of the probability of error on each of them to increase to 50% of the probability of failure of the whole case! The same applies to complex systems with many parts, each of which may fail. In the simplest case, the probability of system failure is calculated from the probability of failure of each of its parts according to the same law of watermelon peel.
Our reasoning is extremely simple, and Murphy's law is more emotional than objective and seems like a truism, but still, it was from this observation that a new big science began in the forties or fifties of the twentieth century: the theory of reliability. She added time, interrelation of system elements, economics, as well as the human factor, and found application beyond engineering: in economics, control theory and, finally, in programming.
We will return to this topic when we study the law of the last day , which causes the printer to act up precisely on the day of the project. The law of Murphy with regard to time is truly a terrible force! For now, let us return to the topic of uniqueness and normality.
Happiness is finding friends with the same diagnosis as yours.
We are all different, this is understandable, but is it even possible to raise the question of compliance with a certain norm, are we trying to evaluate and compare? You ask, what's wrong with that? We all the time someone compare with someone, most often, ourselves with others, but sometimes we allow to evaluate someone else. However, from the point of view of mathematics, everything is not so simple.
To compare is to determine the order relation. That is, to designate that one element of a certain set, in a sense, precedes the other. We learned this at school: 2 less than 20, an elephant is weaker than a whale, a contract is more valuable than money, etc. But here are some questions for you. What goes before Monday or Tuesday? Is it Sunday or Monday? And what Sunday is that before Monday, or that after Saturday? And which number is greater: 2 + 3i or 3 + 2i? We can call in order the colors of the rainbow and even associate all intermediate colors with a real number — the frequency of light, but apart from these colors there are many non-spectral colors, they form a color circle well known to printers and designers, is it possible to arrange all the colors visible to the eye in order? These examples show that there are difficulties with the attitude of order. For example, transitivity does not work on many days of the week (from
follows but for follows does not follow that always follows ). Attempting to introduce the concept of more / less in the field of complex numbers is inconsistent with the arithmetic of these numbers, and the colors have both of these disadvantages. And how can you compare people, books, dishes, programming languages and other objects that have many parameters, even if they are conventionally formalized? In principle, it is possible, but only first agreeing on definitions and metrics, otherwise it will be an endless, turbulent and meaningless argument. Alas, heated debates arise most often already at the stage of selecting metrics, since they themselves form a certain set, on which the order relation also needs to be determined.
However, it is possible to offer a quite sensible and unambiguous way of talking about the comparability of multidimensional objects, for example, people. In a multidimensional parameter space, each object can be represented by a vector — a set of numbers — the values of the criteria that characterize it. Considering the ensemble of vectors (for example, human society), we will see that some of them will be co-directed, or at least close in directions, so they can already be compared in length. At the same time, some vectors will be orthogonal (in a geometrical sense - perpendicular, in a wider sense - independent), and the people corresponding to them will be simply incomprehensible to each other: they will turn out in conjugate spaces in a number of parameters, like the notorious physicists and lyricists. It makes no sense to talk about that a good poet is better or worse than a talented engineer or nature-endowed athlete. The only thing that can be judged is the length of the vector - the degree of endowments, the distance from the average.
In this connection, a curious question may arise: what proportion of random vectors in the space of a given dimension will be co-directed, and what proportion will be orthogonal? How many will be able to find like-minded people or, at least, those with whom you can compare yourself?
In a two-dimensional world, each vector corresponds to a one-dimensional space of collinear (c) and one-dimensional space of orthogonal vectors. If we consider “almost” codirectional and “almost” orthogonal vectors, then they form sectors of the same area with the same choice of tolerance. That is, similar and unlike objects, when considering the two criteria, there will be the same number.
Almost collinear and almost orthogonal vectors in two-dimensional and three-dimensional space.
In the three-dimensional world, the picture will change. The codirectional vectors still form one-dimensional space, but the orthogonal vectors already fill the plane — two-dimensional space. Fixing the length of vectors
and allowing a slight deviation from the ideal directions at an angle , it is possible to compare the number of almost codirected vectors with the area of circular areas around the poles , and the number of almost orthogonal vectors - with an area of a strip around the equator: . Their attitude while reducing the deviation grows unlimited. In the four-dimensional world, orthogonal vectors form already three-dimensional space, while the co-directed vectors still lie in one-dimensional, and the difference in their number grows in proportion to the square of the deviation from the ideal. But at this stage it is better to turn to the theory of probability and find out what are the chances of getting orthogonal or codirectional vectors, taking at random two vectors from the space, dimension
? This will tell us the distribution of angles between random vectors. Fortunately, talking about the areas of multidimensional spheres, it can be calculated analytically and presented in the final form:
Is a gamma function, a generalization of factorial to real (and even complex) numbers.Now it is clear that for two-dimensional space the angles are distributed evenly, for three-dimensional - in proportion to the sinusoidal function, and as the dimension increases, the distribution tends to normal with constantly decreasing dispersion. For all dimensions above two, the mode of distribution is 90 degrees and the proportion of mutually orthogonal vectors increases as the number of parameters increases. The most important observation is that the co-directed vectors (having an angle of about 0 or 180 degrees practically do not remain at a sufficiently high dimension of space. Let's consider vectors more or less similar (co-directional, comparable) that have an angle less than 30 degrees (this is quite a small angle:
). Then, when comparing by two criteria similar to some selected vector, only one third of all random vectors will turn out. The use of three criteria will allow to compare with a given vector only of the whole set, for the four criteria - already , and each subsequent addition of the dimension will halve this fraction. If we are stricter and limit ourselves to a smaller angle, the proportion of vectors considered similar will decrease even faster. Thus, we obtain the vector formulation of the law of watermelon peel:
In spaces of high dimension almost all vectors are orthogonal to each other.
or equivalent: the taste and color of comrades is not.
Compare reasonably, do not look for normality in life and do not be afraid of abnormality. Mathematics itself tells us that in a complex world of people one can only speak about the degree of similarity, but not about comparison. So there is no reason to carry on endless disputes, in search of truth, instead, you should listen and try to hear a different opinion, see the view from another, conjugate, space, thereby enriching your perception of the world.
The sages are right: we are all unique and in their uniqueness are absolutely the same.
I invite you, the first readers of this book, to questions, additions and comments that, no doubt, make it more accurate, richer and more interesting.