Ease of observation, atop
Good afternoon, community,
Habré has already spoken about all kinds of TOP-new utilities, this time, I want to try to take a closer look at atop utility . I will try to compare it a little with the existing performance monitoring utilities and learn to read the conclusions of this command.
System administrators have the task of monitoring performance almost every day, and of course I would like to do all this within the framework of one utility and without any special dances with a tambourine, as it seems to me most convenient in this case to use the atop command.
We will give a brief overview on the functionality of the most popular productivity viewing utilities. Linux has a rich set of utilities for monitoring the system, but each of them has certain limitations and their inherent flaws. Let's try to describe the main parameters that the administrator wants to read from his system:
If we take a good look at these requirements and try to apply them to well-known monitoring systems, we will see the following:
sar - shows more than enough information about the four resources of the system that we need, knows how to “return to the past”, but does not know how to focus on processes.
vmstat and iostat - can monitor the CPU, memory and disk usage only at the system level, but not at the process level, they also do not know how to "return to the past."
top - as by far the most popular utility, monitors the CPU and memory at the system level and at the process level. But, like many others, it shows only the current situation, the main drawback in my opinion is that its readings are not always accurate, using the top utility we can encounter such a problem: the system will tell us what to take 90% of the CPU, but in fact the amount of CPU utilization at the process level will be 40% (a difference of 50% percent indicates that the system shows us information between the previous and current snapshot, although the system is basically free already). That is, the reliability and information content is a little lame.
The table below compares these systems by characteristics.
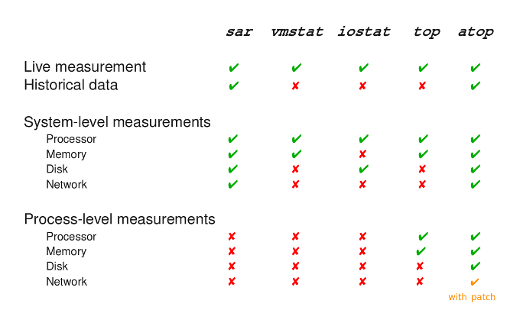
The atop utility by default can show loading by processor, memory, disks and network. A patch is also available that will show network usage by process. By default, the standard output of the command is the following information:
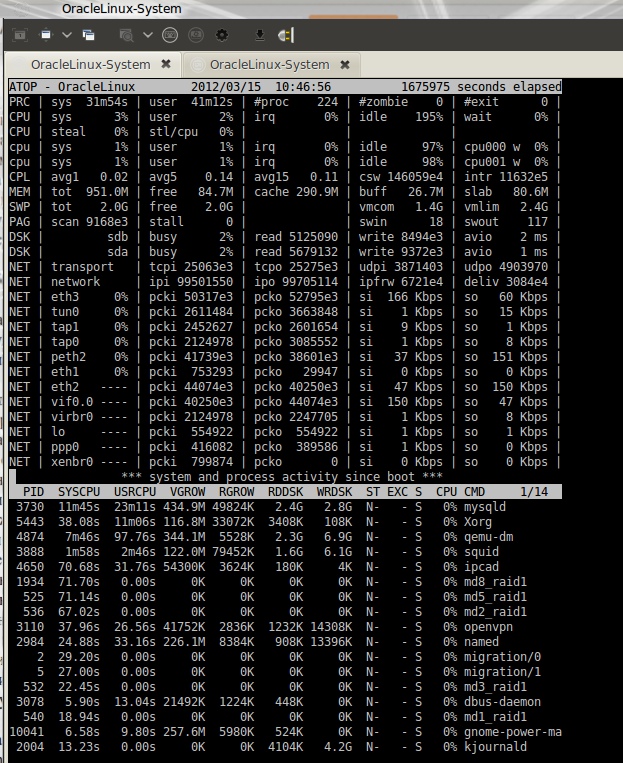
As in the standard output of top, the screen is divided into two halves, the first of them shows data about the system, and the second contains data on processes.
In the upper half, not only information on the processor and memory is visible as in the standard top output, but also information regarding the network and disks. If we pay attention to the 2nd line of this conclusion, summing up the values (3 + 2 + 0 + 195 + 0) we get 200% - this means that the system is 2 processor, and each of them has 100%, the division below is given by to each processor how busy one or the other is. Below these lines are indicated RAM, information on disks, and network interfaces.
A more detailed description of each column can be found in the man page for this utility, by the way an extremely detailed description.
Naturally, we can change its appearance as we want using hot keys, below I have indicated the most interesting of them,
m - will build processes according to the occupied memory
d - build processes for using the drive
n - build processes for using the network (available only with the patch installed)
v - show more detailed information about the processes (user, date and time the process started)
u - build a table for the most voracious users
Using shift + (d , m, n) will build the current list according to the above parameters.
i - change the scan time, by default 10 seconds.
g - will return everything to default output.
Now let's see how to still use the "return to the past" function, the atop utility has a useful feature during standard installation, which includes nightly logging of system performance. The default utility takes readings every 10 minutes and resets them to the / var / log / atop-YYYYMMDD log. I have this case disabled by default, not such an important server is simple:
In the future, to analyze or view the log, you can use atop itself with the -r switch, or if you like reports like sar, you can use the atopsar utility. By the way, it’s important to clarify that data is collected in binary format.
Thus, we can say that at the moment there is a better utility than atop? which was able to combine practically all the necessary functionality for the system administrator, no. Well, at least that's my personal opinion.
Disclaimers in the comments are welcome!
Habré has already spoken about all kinds of TOP-new utilities, this time, I want to try to take a closer look at atop utility . I will try to compare it a little with the existing performance monitoring utilities and learn to read the conclusions of this command.
System administrators have the task of monitoring performance almost every day, and of course I would like to do all this within the framework of one utility and without any special dances with a tambourine, as it seems to me most convenient in this case to use the atop command.
We will give a brief overview on the functionality of the most popular productivity viewing utilities. Linux has a rich set of utilities for monitoring the system, but each of them has certain limitations and their inherent flaws. Let's try to describe the main parameters that the administrator wants to read from his system:
- the utility must necessarily show the situation "on-line", but since problems rarely occur at the time of observation, it should include functionality for viewing the status for a certain past period.
- must demonstrate the performance of 4 main resources: CPU, memory, disk I / O and the network.
- since downloading each of the four resources is definitely a merit of a particular process, the utility should show the dependence of resource loading on the process.
- should be able to receive snapshots of the system, with a certain interval.
If we take a good look at these requirements and try to apply them to well-known monitoring systems, we will see the following:
sar - shows more than enough information about the four resources of the system that we need, knows how to “return to the past”, but does not know how to focus on processes.
vmstat and iostat - can monitor the CPU, memory and disk usage only at the system level, but not at the process level, they also do not know how to "return to the past."
top - as by far the most popular utility, monitors the CPU and memory at the system level and at the process level. But, like many others, it shows only the current situation, the main drawback in my opinion is that its readings are not always accurate, using the top utility we can encounter such a problem: the system will tell us what to take 90% of the CPU, but in fact the amount of CPU utilization at the process level will be 40% (a difference of 50% percent indicates that the system shows us information between the previous and current snapshot, although the system is basically free already). That is, the reliability and information content is a little lame.
The table below compares these systems by characteristics.
The atop utility by default can show loading by processor, memory, disks and network. A patch is also available that will show network usage by process. By default, the standard output of the command is the following information:
As in the standard output of top, the screen is divided into two halves, the first of them shows data about the system, and the second contains data on processes.
In the upper half, not only information on the processor and memory is visible as in the standard top output, but also information regarding the network and disks. If we pay attention to the 2nd line of this conclusion, summing up the values (3 + 2 + 0 + 195 + 0) we get 200% - this means that the system is 2 processor, and each of them has 100%, the division below is given by to each processor how busy one or the other is. Below these lines are indicated RAM, information on disks, and network interfaces.
A more detailed description of each column can be found in the man page for this utility, by the way an extremely detailed description.
Naturally, we can change its appearance as we want using hot keys, below I have indicated the most interesting of them,
m - will build processes according to the occupied memory
d - build processes for using the drive
n - build processes for using the network (available only with the patch installed)
v - show more detailed information about the processes (user, date and time the process started)
u - build a table for the most voracious users
Using shift + (d , m, n) will build the current list according to the above parameters.
i - change the scan time, by default 10 seconds.
g - will return everything to default output.
Now let's see how to still use the "return to the past" function, the atop utility has a useful feature during standard installation, which includes nightly logging of system performance. The default utility takes readings every 10 minutes and resets them to the / var / log / atop-YYYYMMDD log. I have this case disabled by default, not such an important server is simple:
[root @ OracleLinux ~] # chkconfig --list | grep atop
atop 0: off 1: off 2: off 3: off 4: off 5: off 6: off
In the future, to analyze or view the log, you can use atop itself with the -r switch, or if you like reports like sar, you can use the atopsar utility. By the way, it’s important to clarify that data is collected in binary format.
Thus, we can say that at the moment there is a better utility than atop? which was able to combine practically all the necessary functionality for the system administrator, no. Well, at least that's my personal opinion.
Disclaimers in the comments are welcome!