Workshop on using Shekhart control charts
Recently I published my slidecast here with a story about 6-sigma, Shekhart control charts and people snowflakes , where in a simple enough language, sometimes abusing bad language, under the 20-minute laughter of the audience I talked about how to separate system variations from variations caused by special reasons .
Now I want to analyze in detail the example of constructing a Shekhart control card based on real data. As real data, I took historical information about completed personal tasks. I have this information thanks to adapting David Allen’s personal effectiveness model for Getting Things (about this I also have an old slidecast in three parts: Part 1 , Part 2 , Part 3 +Excel-plate with macros for analyzing tasks from Outlook ).
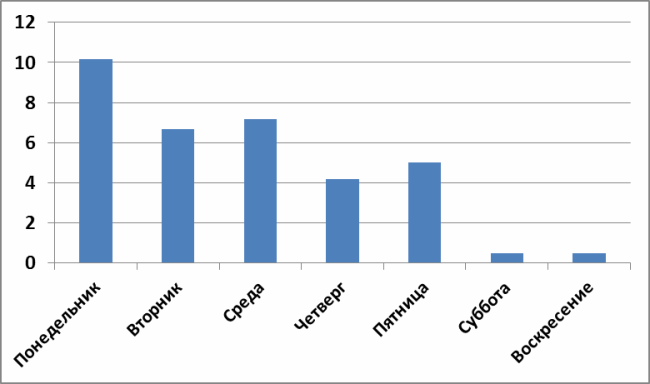
The problem statement looks like this. I have a distribution of the average number of completed tasks depending on the day of the week (below on the chart) and I need to answer the question: “is there anything special on Mondays or is this just a system error?”
We will answer this question with the help of a Shekhart control card - The main tool of statistical process control.
So, the Schuhart criterion for the presence of a special reason for the variation is quite simple: if some point goes beyond the control limits calculated in a special way, then it indicates a special reason. If the point lies within these limits, then the deviation is due to the general properties of the system itself. Roughly speaking, it is a measurement error.
The formula for calculating control limits is as follows:

Where
 is the average value of the average values for the subgroup,
 is the average range,
 is a certain engineering coefficient, depending on the size of the subgroup.
All formulas and tabular coefficients can be found, for example, in GOST 50779.42-99 , which outlines the approach to statistical management (honestly, I myself did not expect that there is such a GOST. The topic of statistical management and its place in business optimization is described in more detail in book by D. Wheeler ).
In our case, we group the number of completed tasks by day of the week - this will be the subgroups of our sample. I took data on the number of completed tasks for 5 weeks of work, that is, the size of the subgroup is 5. Using table 2 from GOST, we find the value of the engineering coefficient:

Calculation of the average value and range (the difference between the minimum and maximum values) for the subgroup (in our case by the day of the week) the task is quite simple, in my case the results are as follows:
The central line of the control card will be the average of group averages, that is: We

also calculate the average range:

Now we know that the lower control limit for the number of completed tasks will be:

That is, those days on which I finish on average a smaller number of tasks, in terms of systems are special.
Similarly, we get the upper control limit:
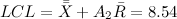
Now we plot the center line (red), the upper control limit (green) and the lower control limit (purple):
And, oh, miracle! We see three clearly distinct groups that go beyond the control limits, in which there are clearly not systemic reasons for the variations!
Saturdays and Sundays I do not work. Fact. And Monday turned out to be a really special day. And now you can think and look for what is really really special on Mondays.
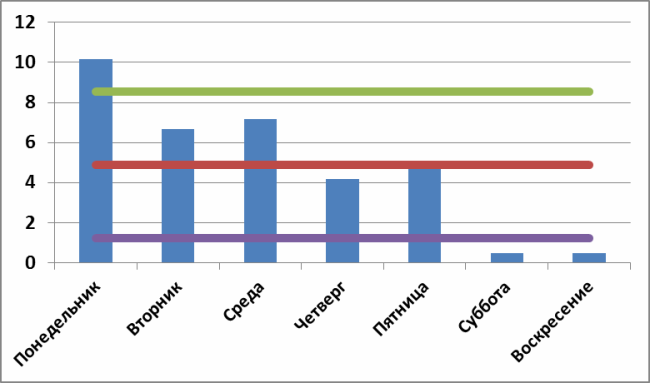
However, if the average number of tasks performed on Monday was within the control limits and even stood out from the rest of the points, then from the point of view of Schuhart and Deming it would be pointless to look for some specifics on Mondays, since such behavior is determined solely by common reasons . For example, I built a control card for the other 5 weeks at the end of last year:
And it seems like there is some feeling that Monday somehow stands out, but according to the Shekhart criterion - this is just a fluctuation or an error in the system itself. According to Shuhart, in this case, you can investigate the special causes of Mondays for as long as you like - they simply do not exist. From the point of view of the statistical office, on this data, Monday is no different from any other working day (even Sunday).
Now I want to analyze in detail the example of constructing a Shekhart control card based on real data. As real data, I took historical information about completed personal tasks. I have this information thanks to adapting David Allen’s personal effectiveness model for Getting Things (about this I also have an old slidecast in three parts: Part 1 , Part 2 , Part 3 +Excel-plate with macros for analyzing tasks from Outlook ).
The problem statement looks like this. I have a distribution of the average number of completed tasks depending on the day of the week (below on the chart) and I need to answer the question: “is there anything special on Mondays or is this just a system error?”
We will answer this question with the help of a Shekhart control card - The main tool of statistical process control.
So, the Schuhart criterion for the presence of a special reason for the variation is quite simple: if some point goes beyond the control limits calculated in a special way, then it indicates a special reason. If the point lies within these limits, then the deviation is due to the general properties of the system itself. Roughly speaking, it is a measurement error.
The formula for calculating control limits is as follows:
Where
is the average value of the average values for the subgroup, is the average range, is a certain engineering coefficient, depending on the size of the subgroup. All formulas and tabular coefficients can be found, for example, in GOST 50779.42-99 , which outlines the approach to statistical management (honestly, I myself did not expect that there is such a GOST. The topic of statistical management and its place in business optimization is described in more detail in book by D. Wheeler ).
In our case, we group the number of completed tasks by day of the week - this will be the subgroups of our sample. I took data on the number of completed tasks for 5 weeks of work, that is, the size of the subgroup is 5. Using table 2 from GOST, we find the value of the engineering coefficient:
Calculation of the average value and range (the difference between the minimum and maximum values) for the subgroup (in our case by the day of the week) the task is quite simple, in my case the results are as follows:
| Day of the week | Group average | Scope |
|---|---|---|
| Monday | 10.2 | 8 |
| Tuesday | 6.7 | 10 |
| Wednesday | 7.2 | eleven |
| Thursday | 4.2 | 9 |
| Friday | 5.0 | 10 |
| Saturday | 0.5 | 2 |
| Sunday | 0.5 | 3 |
The central line of the control card will be the average of group averages, that is: We
also calculate the average range:
Now we know that the lower control limit for the number of completed tasks will be:
That is, those days on which I finish on average a smaller number of tasks, in terms of systems are special.
Similarly, we get the upper control limit:
Now we plot the center line (red), the upper control limit (green) and the lower control limit (purple):
And, oh, miracle! We see three clearly distinct groups that go beyond the control limits, in which there are clearly not systemic reasons for the variations!
Saturdays and Sundays I do not work. Fact. And Monday turned out to be a really special day. And now you can think and look for what is really really special on Mondays.
However, if the average number of tasks performed on Monday was within the control limits and even stood out from the rest of the points, then from the point of view of Schuhart and Deming it would be pointless to look for some specifics on Mondays, since such behavior is determined solely by common reasons . For example, I built a control card for the other 5 weeks at the end of last year:
And it seems like there is some feeling that Monday somehow stands out, but according to the Shekhart criterion - this is just a fluctuation or an error in the system itself. According to Shuhart, in this case, you can investigate the special causes of Mondays for as long as you like - they simply do not exist. From the point of view of the statistical office, on this data, Monday is no different from any other working day (even Sunday).