Doping for analytics: why pay attention to Apache Zeppelin
All sooner or later come to the analyst for the data. In large multiplayer games (and singleplayer) without this, there’s nowhere else. How many users prefer the new mode; where are the weak points of monetization; where to look game designers to increase the involvement of players; and a million more things - everything is calculated. And all this affects the decisions that developers then make.
But they are implementing the analytics in different ways: someone buys third-party solutions (simply, but inflexible), someone writes for themselves (long and expensive), while others just consider several basic metrics by programmers and do not bother.
Therefore, I will talk about a tool that will be useful for everyone. Anyone who is just starting to build analytics will be able to create a system from scratch “on the knee”, and companies with ready-made solutions will “boost” their approach.

It's about Apache Zeppelin . This is a multifunctional interactive shell that allows you to perform queries to various data sources, process and visualize the results.
A fairly close analogue is Jupyter Notebook, but Zeppelin is a bit more geared towards working with databases. It uses the concept of "interpreters" - plug-ins that provide a backend for any language and / or database.
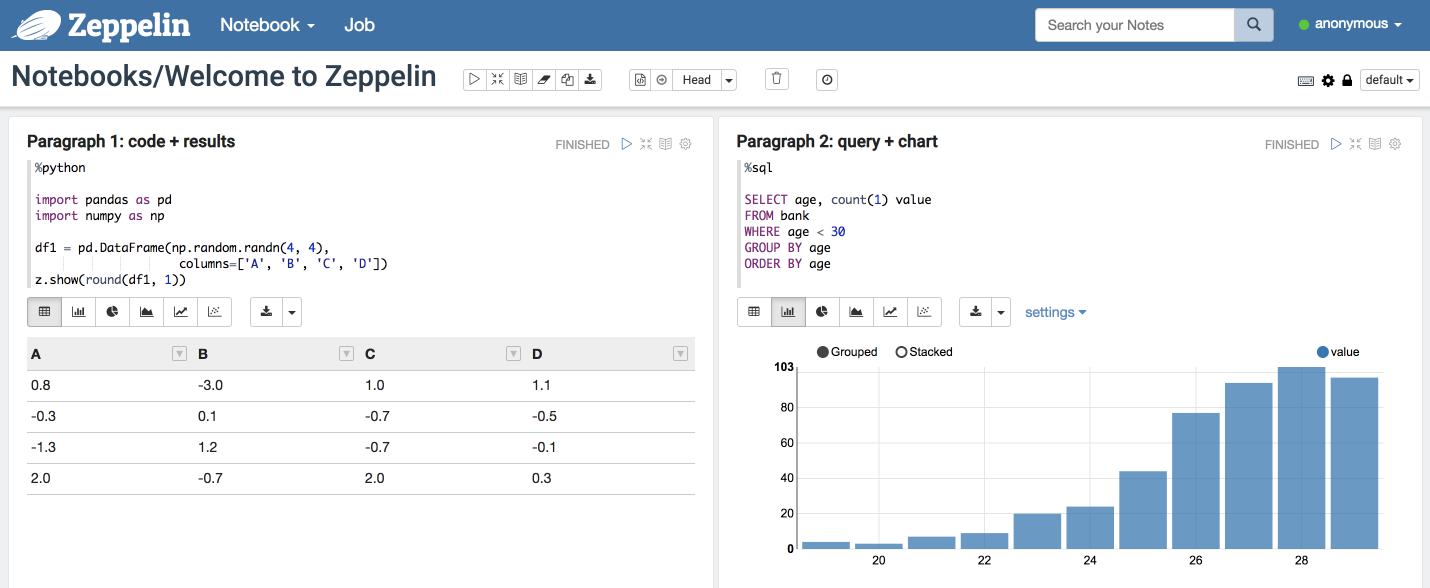
Zeppelin, like Jupyter, for the user looks like a set of laptop files, consisting of paragraphs in which requests are written and executed. With the help of built-in visualizers, a laptop with a set of queries can be easily turned into a full-fledged dashboard with data.
Intentionally we will not deal with installation and configuration issues - this is also in the documentation on the site, and on the network you can find several tutorials for different databases. The purpose of the article is to talk about the user side of the issue, interesting applications of the tool (including not the most obvious ones) and the benefits that analysts can extract from it, regardless of what solution they are already using.
As examples, I will tell you why we use it in Pixonic (just the case when the company already has its own productive analytics system).
So let's go in order.
Combining various data sources - within one dashboard
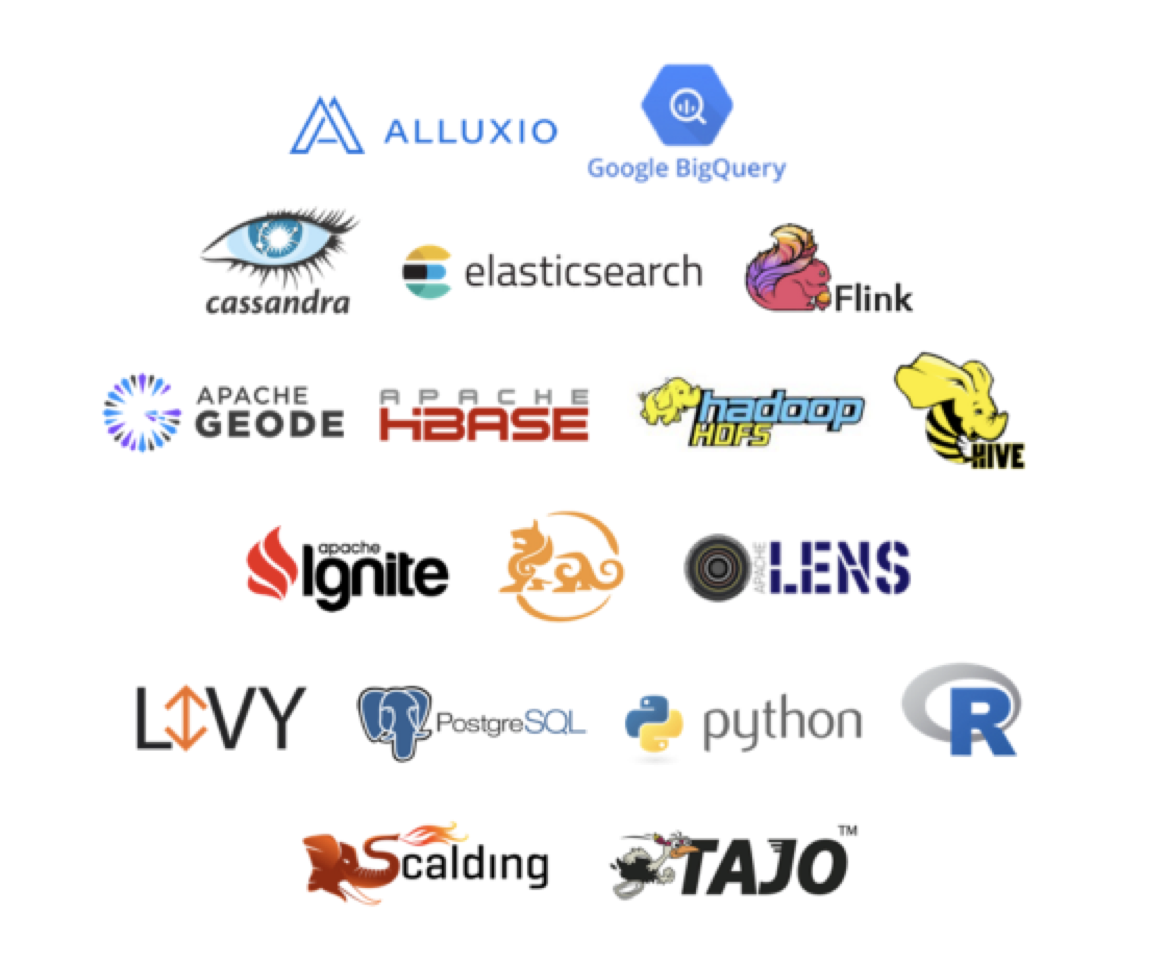
is one of its key advantages. As part of the standard assembly included an impressive set of interpreters (for NoSQL and relational databases).
In practice, this gives the following:
Zeppelin is not only a web interface for various databases, but can also act as an interactive shell for running scripts in programming languages. It includes interpreters for R and Python, so it may well be an alternative to the usual RStudio and Jupyter. Yes, it provides fewer features than specialized IDEs (for example, there is no auto-substitution), but this is offset by the advantages, which we will discuss below.
In conjunction with the same Python, the power of Zeppelin increases many times: here you can get data via API from third-party services (hello to the previous item), and the ability to process data in addition to normal database queries, as well as automate these processes. Zeppelin supports updating dashboards on the crown without any extra gestures (again, a quick glance at the decisions of colleagues shows that this seemingly trivial task sometimes has to be solved in very clever ways). Well, for sweetness: it has a built-in version control system - a primitive one, but sufficient for most of the tasks of analysts.
We in the company actively use Python along with AppMetr (internal analytics system) for complex data processing. Therefore, the idea to try Zeppelin appeared precisely in relation to our scripts - we saw in this the potential to simplify a number of routines associated, for example, with visualization of results.
Zeppelin can display the data displayed in a paragraph in the form of several basic visualizers, which work according to the principle of summary diagrams: in the interface, fields are selected by which axes will be built and how the displayed values will be aggregated. The resulting diagrams are clickable and make it easy to see the data in different sections.
This, seemingly modest, functionality covers up to 95% of analysts' tasks on visualization of results. You can stop the endless export of uploads to Excel just for plotting, and even forget such scary words like matplotlib, bokeh and ggplot2 - the results of the scripts also turn into charts with a couple of clicks.
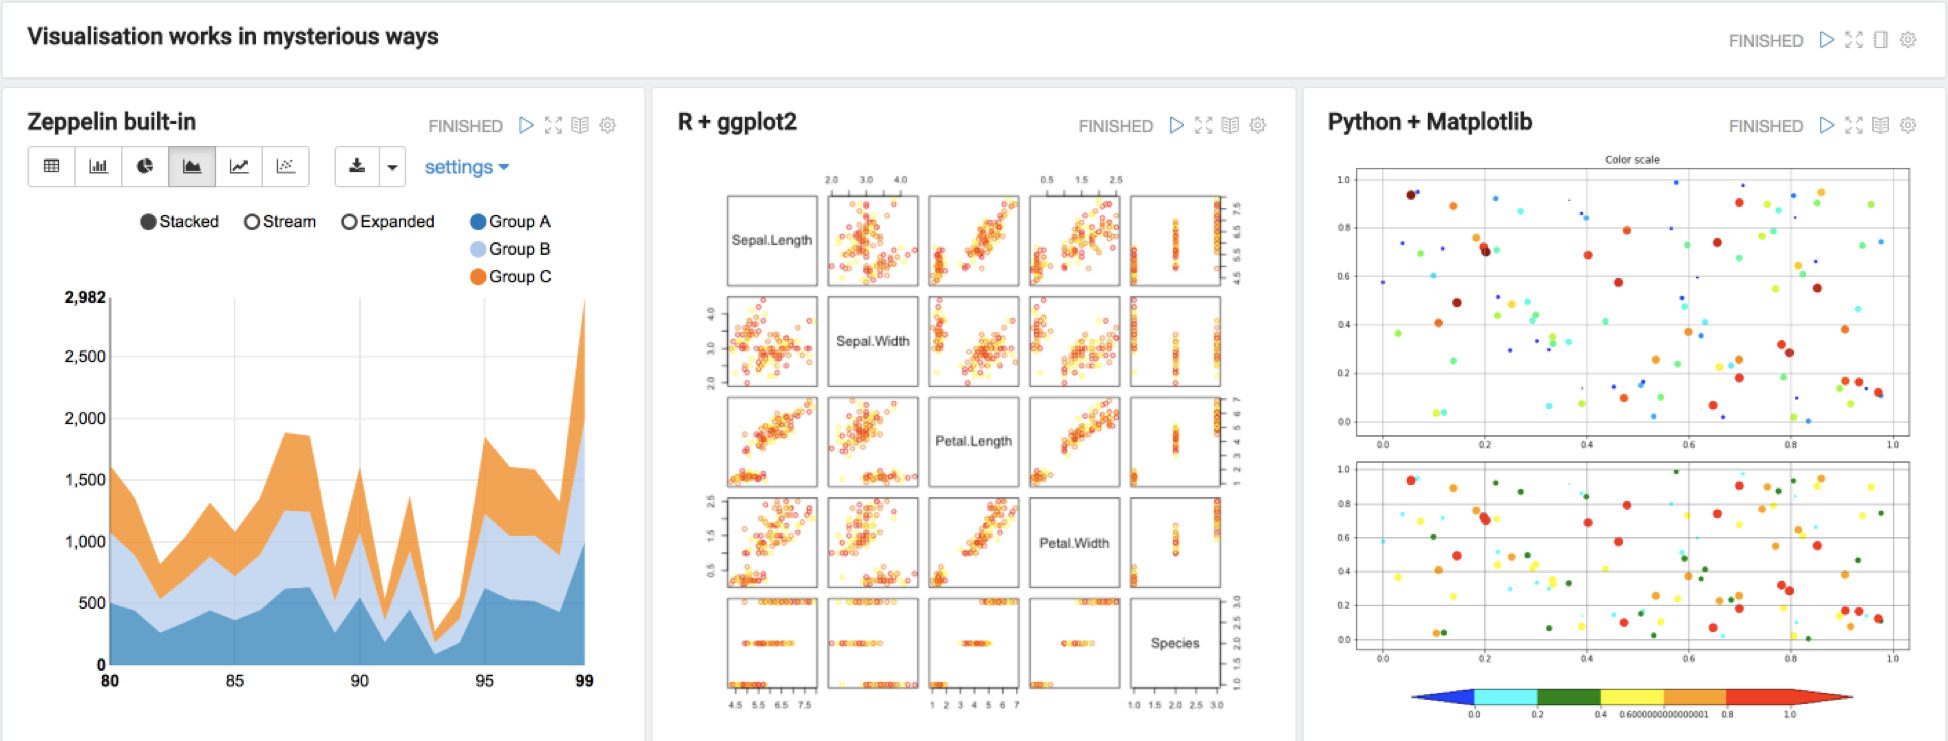
However, for more complex visualizations, the names of graphic libraries can be recalled again - Zeppelin has built-in integration with the most popular graphic libraries for Python and R:
Zeppelin can work locally and be used simply as an analytics tool, but if you deploy it on a server, you can, if you wish, turn it into a corporate analytic service with authorization via LDAP and access settings. Depending on the need for analytics, it can act as a set of dashboards on project metrics, as well as a common repository of scripts and uploads, or, for example, a space for analysts to work together. A nice bonus: the need to share some files or start a new dock in Confluence disappears - you can simply drop the link to the dashboard.
In this aspect, an important role is played by the flexibility in setting up the interface and the ability to generate simple forms for entering values. Of course, analysts feel comfortable at the sight of SQL queries and code on R, but for untrained users this can drive into a stupor. Therefore, in the Zeppelin dashboard, you can hide the code (which, for example, is a problem for Jupyter), make fields for entering dates and other changing parameters and give the customer a neat and understandable form.
In our company, many processes are tied to analytics, so different departments periodically need some kind of specific unloading, for example, recalculate the balance sheet according to fresh data. For such things we have long written scripts, but they still have someone to run. Have you ever tried to teach 20 game designers to use Jupyter? As a result, we elegantly solved this problem by shifting the scripts to Zeppelin, where, for example, the HD can get the data they need by simply pressing one button. Or not one:
What is very important in this moment is the fact that all the preparation of interfaces and configuration is done solely by the analysts themselves, without involving programmers (or, God forbid, UX-ditch).
Zeppelin works in several processes, which results in an interesting bonus - it allows you to run a separate Python instance both for each laptop and for each user. Thus, without tricky settings, you can run several bulk processing scripts in parallel - just by doing it in different laptops, and continue working without waiting for completion. This also works in the case of a local copy, and when deployed on a server, so in general it is possible to carry out part of the calculations from local computers by performing them on the server.

If you have Zeppelin deployed on the server, you can get a link to any of your paragraphs (with the results of the query or schedule) and publish it as an iframe on the site (this is done very simply, there is a tutorial on the site). In the practice of analysts, it is not often necessary to publish any results on external resources, but this can be very convenient for adding visualizers in internal services (in the same Confluence). So you can create reports that have interactive forms and visualizers directly in the text.
Markdown support allows adding paragraphs with formatted text to dashboards, in addition to graphs and tables. As a result, you can make visual reports with descriptions, where the user can immediately see the data on some problem, see it all on the charts and read the interpretation of the results from analysts. Unlike Jupyter, which also has markdown support, Zeppelin makes interactive forms and visualizes the results much faster, and the result is more accurate and accessible to the end user, which is important.
Thus, it is a quick and visual alternative to conventional analyst research. As a rule, the work of analysts is built like this: analysts get the task to study some aspect of the game. They prepare data, test hypotheses, visualize confirmatory results, say, with diagrams, and write a report (for example, in confluence). This is a correct, but rather painstaking process. In our case, without spending too much time, you can sketch out a laptop with these same downloads and scripts, immediately illustrate the results with graphs, and describe your conclusions in the next paragraphs:

Of course, Zeppelin has something to scold you for, it still does not always work stably (it’s still an open source), the web interface eats up a lot of RAM, some people may not have enough full-featured IDE functions. But there are already a number of interesting user cases where it can be useful - because it definitely deserves the attention of analysts ( and, of course, the more the community is, the better it can become in the future ).
For small companies, it can become the main tool, as it allows you to build a full-featured analytics system over the database. For larger companies with already established analytical tools - a useful addition that will not replace the main system, but will have several useful advantages.
But they are implementing the analytics in different ways: someone buys third-party solutions (simply, but inflexible), someone writes for themselves (long and expensive), while others just consider several basic metrics by programmers and do not bother.
Therefore, I will talk about a tool that will be useful for everyone. Anyone who is just starting to build analytics will be able to create a system from scratch “on the knee”, and companies with ready-made solutions will “boost” their approach.
It's about Apache Zeppelin . This is a multifunctional interactive shell that allows you to perform queries to various data sources, process and visualize the results.
A fairly close analogue is Jupyter Notebook, but Zeppelin is a bit more geared towards working with databases. It uses the concept of "interpreters" - plug-ins that provide a backend for any language and / or database.
Zeppelin, like Jupyter, for the user looks like a set of laptop files, consisting of paragraphs in which requests are written and executed. With the help of built-in visualizers, a laptop with a set of queries can be easily turned into a full-fledged dashboard with data.
Intentionally we will not deal with installation and configuration issues - this is also in the documentation on the site, and on the network you can find several tutorials for different databases. The purpose of the article is to talk about the user side of the issue, interesting applications of the tool (including not the most obvious ones) and the benefits that analysts can extract from it, regardless of what solution they are already using.
As examples, I will tell you why we use it in Pixonic (just the case when the company already has its own productive analytics system).
So let's go in order.
Omnivorous zeppelin
Combining various data sources - within one dashboard
is one of its key advantages. As part of the standard assembly included an impressive set of interpreters (for NoSQL and relational databases).
In practice, this gives the following:
- Most companies with already working databases and analytics systems can use it out of the box (as far as applicable to an open source product, heh). Enthusiasts with more exotic databases can write an interpreter on their own, which is the article on the product site .
- Small companies, if desired, can build their analytics system exclusively from the database and Zeppelin as an interface.
- As the experience of communication with colleagues shows, many data can be drained from different sources, stored in different databases (lee-e-egasi!), Someone else can use third-party analytics services. Accordingly, analysts sometimes have the task of “making friends” with such a menagerie. Zeppelin, on the other hand, allows you to use your own interpreter for each paragraph within a single laptop, which will allow you to display the results of queries to different sources in one place.
Zeppelin + Python / R
Zeppelin is not only a web interface for various databases, but can also act as an interactive shell for running scripts in programming languages. It includes interpreters for R and Python, so it may well be an alternative to the usual RStudio and Jupyter. Yes, it provides fewer features than specialized IDEs (for example, there is no auto-substitution), but this is offset by the advantages, which we will discuss below.
In conjunction with the same Python, the power of Zeppelin increases many times: here you can get data via API from third-party services (hello to the previous item), and the ability to process data in addition to normal database queries, as well as automate these processes. Zeppelin supports updating dashboards on the crown without any extra gestures (again, a quick glance at the decisions of colleagues shows that this seemingly trivial task sometimes has to be solved in very clever ways). Well, for sweetness: it has a built-in version control system - a primitive one, but sufficient for most of the tasks of analysts.
We in the company actively use Python along with AppMetr (internal analytics system) for complex data processing. Therefore, the idea to try Zeppelin appeared precisely in relation to our scripts - we saw in this the potential to simplify a number of routines associated, for example, with visualization of results.
Visualization of everything in the world - with one click
Zeppelin can display the data displayed in a paragraph in the form of several basic visualizers, which work according to the principle of summary diagrams: in the interface, fields are selected by which axes will be built and how the displayed values will be aggregated. The resulting diagrams are clickable and make it easy to see the data in different sections.
This, seemingly modest, functionality covers up to 95% of analysts' tasks on visualization of results. You can stop the endless export of uploads to Excel just for plotting, and even forget such scary words like matplotlib, bokeh and ggplot2 - the results of the scripts also turn into charts with a couple of clicks.
However, for more complex visualizations, the names of graphic libraries can be recalled again - Zeppelin has built-in integration with the most popular graphic libraries for Python and R:
Collaboration and configuration of interfaces
Zeppelin can work locally and be used simply as an analytics tool, but if you deploy it on a server, you can, if you wish, turn it into a corporate analytic service with authorization via LDAP and access settings. Depending on the need for analytics, it can act as a set of dashboards on project metrics, as well as a common repository of scripts and uploads, or, for example, a space for analysts to work together. A nice bonus: the need to share some files or start a new dock in Confluence disappears - you can simply drop the link to the dashboard.
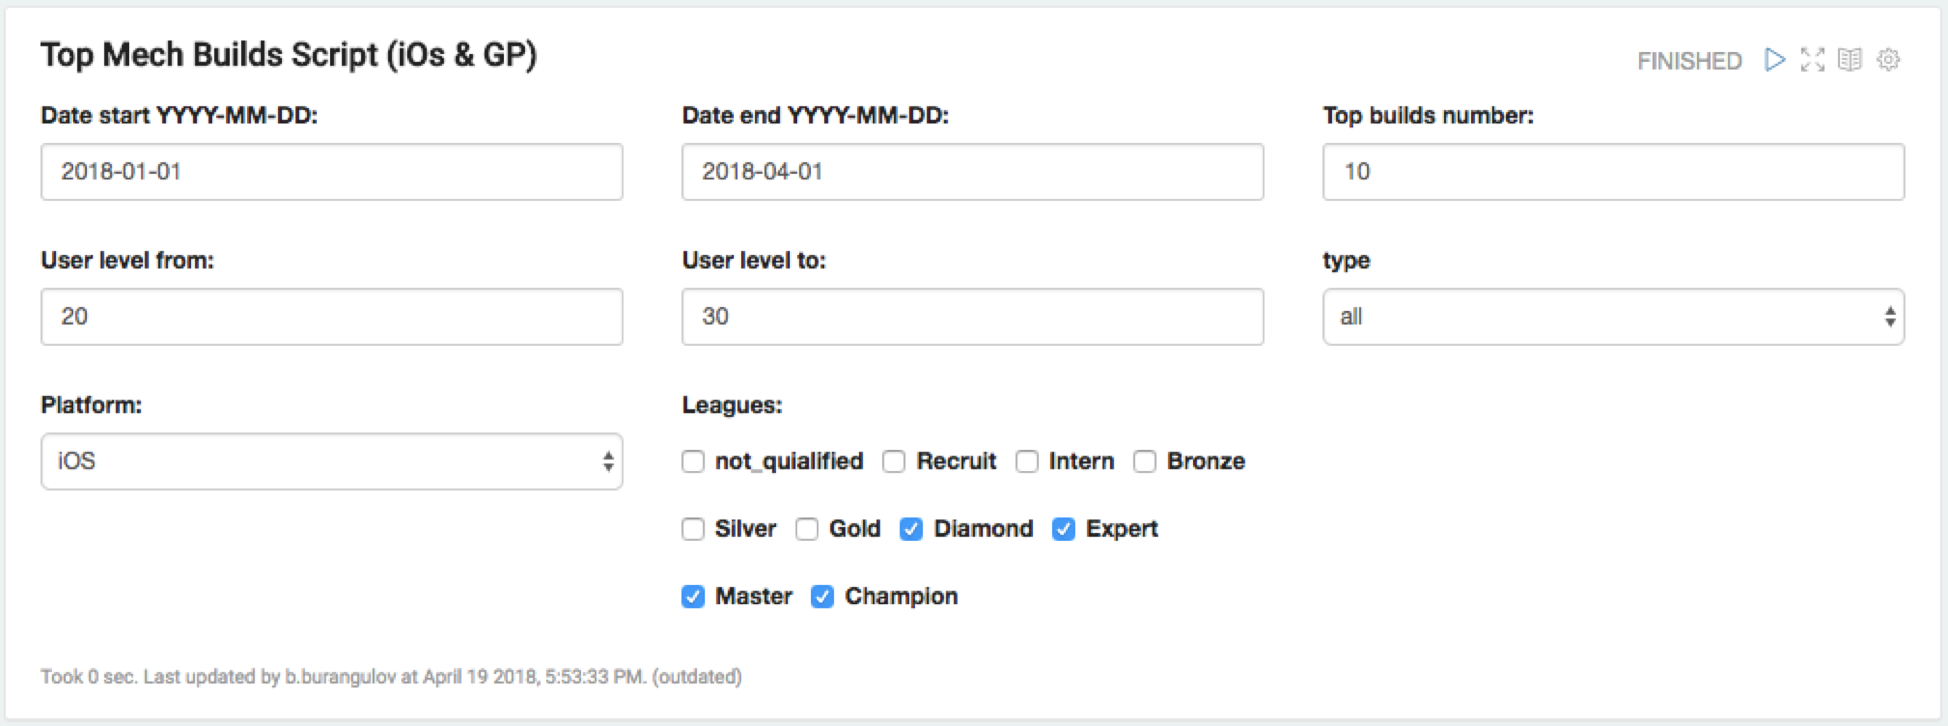
In this aspect, an important role is played by the flexibility in setting up the interface and the ability to generate simple forms for entering values. Of course, analysts feel comfortable at the sight of SQL queries and code on R, but for untrained users this can drive into a stupor. Therefore, in the Zeppelin dashboard, you can hide the code (which, for example, is a problem for Jupyter), make fields for entering dates and other changing parameters and give the customer a neat and understandable form.
In our company, many processes are tied to analytics, so different departments periodically need some kind of specific unloading, for example, recalculate the balance sheet according to fresh data. For such things we have long written scripts, but they still have someone to run. Have you ever tried to teach 20 game designers to use Jupyter? As a result, we elegantly solved this problem by shifting the scripts to Zeppelin, where, for example, the HD can get the data they need by simply pressing one button. Or not one:
What is very important in this moment is the fact that all the preparation of interfaces and configuration is done solely by the analysts themselves, without involving programmers (or, God forbid, UX-ditch).
The benefits of parallel processes
Zeppelin works in several processes, which results in an interesting bonus - it allows you to run a separate Python instance both for each laptop and for each user. Thus, without tricky settings, you can run several bulk processing scripts in parallel - just by doing it in different laptops, and continue working without waiting for completion. This also works in the case of a local copy, and when deployed on a server, so in general it is possible to carry out part of the calculations from local computers by performing them on the server.
Embedding paragraphs in sites
If you have Zeppelin deployed on the server, you can get a link to any of your paragraphs (with the results of the query or schedule) and publish it as an iframe on the site (this is done very simply, there is a tutorial on the site). In the practice of analysts, it is not often necessary to publish any results on external resources, but this can be very convenient for adding visualizers in internal services (in the same Confluence). So you can create reports that have interactive forms and visualizers directly in the text.
Self-describing reports
Markdown support allows adding paragraphs with formatted text to dashboards, in addition to graphs and tables. As a result, you can make visual reports with descriptions, where the user can immediately see the data on some problem, see it all on the charts and read the interpretation of the results from analysts. Unlike Jupyter, which also has markdown support, Zeppelin makes interactive forms and visualizes the results much faster, and the result is more accurate and accessible to the end user, which is important.
Thus, it is a quick and visual alternative to conventional analyst research. As a rule, the work of analysts is built like this: analysts get the task to study some aspect of the game. They prepare data, test hypotheses, visualize confirmatory results, say, with diagrams, and write a report (for example, in confluence). This is a correct, but rather painstaking process. In our case, without spending too much time, you can sketch out a laptop with these same downloads and scripts, immediately illustrate the results with graphs, and describe your conclusions in the next paragraphs:
Of course, Zeppelin has something to scold you for, it still does not always work stably (it’s still an open source), the web interface eats up a lot of RAM, some people may not have enough full-featured IDE functions. But there are already a number of interesting user cases where it can be useful - because it definitely deserves the attention of analysts ( and, of course, the more the community is, the better it can become in the future ).
For small companies, it can become the main tool, as it allows you to build a full-featured analytics system over the database. For larger companies with already established analytical tools - a useful addition that will not replace the main system, but will have several useful advantages.