ThunderX2 rating from Cavium: the dream of the Arm server came true (part 2)
- Transfer
The first part “ThunderX2 rating from Cavium: the dream of the Arm server came true” - here
To review ThunderX2, all our tests were performed on Ubuntu Server 17.10, Linux kernel 4.13 64 bits. We usually use the LTS version, but since Cavium comes with this version of Ubuntu, we did not risk changing the OS. The Ubuntu distribution includes the GCC 7.2 compiler.

You will notice that the DRAM volume varies in our server configurations. The reason is simple: the Intel system has 6 memory channels, and the Cavium ThunderX2 has 8 memory channels.
Typical BIOS settings can be seen below. It is worth noting that hyperthreading and Intel virtualization technology are included.
Other notes
Both servers are powered according to the European standard - 230 V (maximum 16 amps). The air temperature in the room is monitored and maintained at 23 ° C with our Airwell CRAC instruments.
It is worth mentioning that the Gigabyte "Saber" system consumed 500 watts if it simply worked under Linux (that is, it was mostly inactive). However, under load, the system consumes about 800 W, which, in principle, met our expectations, since we have two 180 W of TDP-chip inside. As is usually the case for early test systems, we cannot make accurate power comparisons.
In fact, Cavium claims that current systems from HP, Gigabyte and others will be much more efficient. The “Saber” testing system that was used had several problems with power management: improper fan firmware control, BMC error, and too high power supply (1600 W).
Measuring the full capacity of the system using the John McCalpin’s Stream bandwidth benchmark test on the latest processors becomes more difficult as the number of core and memory channels grows. As can be seen from the results below, estimating the throughput is not easy. The result strongly depends on the selected settings.
Theoretically, ThunderX2 has 33% more bandwidth than Intel Xeon, because SoC has 8 memory channels compared to six Intel channels. These high throughput figures are achieved only in very specific conditions, and require some tuning to avoid the use of remote memory. In particular, we must ensure that threads are not transferred from one socket to another.
To begin with, we tried to achieve the best results on both architectures. In the case of Intel, the ICC compiler always gave the best results with some low-level optimizations inside stream loops. In the case of Cavium, we followed the instructions of Cavium. Roughly speaking, the resulting picture is an idea of how much bandwidth these processors can reach at peaks. To be honest with Intel, with the ideal settings (AVX-512) you can achieve 200 GB / s.
Nevertheless, it is clear that the ThunderX2 system can provide from 15 to 28% more bandwidth to its processor cores. The result is 235 GB / s, or about 120 GB / s per slot. This, in turn, is about 3 times more than the original ThunderX.
Although bandwidth measurements refer only to a small part of the server market, almost every application depends heavily on the latency of the memory subsystem. In attempts to measure cache and memory latency, we used LMBench. The data we want to see in the end is “Delay at random load, step = 16 bytes”. Note that we express the L3 latency and DRAM time delay in nanoseconds, since we do not have accurate L3 cache clock values.
Access to the ThunderX2 L2 cache is done with a very low latency, and when using a single thread, the L3 cache looks like a competitor to Intel's integrated L3 cache. However, when we got to DRAM, Intel showed significantly less latency.
To gain a deeper understanding of the respective architectures, the TinyMemBench open-source test was used. The source code was compiled using GCC 7.2, and the optimization level was set to "-O3". Testing strategy is well described in the benchmark manual:
We tested one and two random reads (without huge pages), because we wanted to see how the memory system handled several read requests.
One of the main drawbacks of the original ThunderX was the inability to support multiple outstanding misses. Parallelism of the memory level is an important feature for any high-performance modern processor core: with its help it avoids cache misses, which can cause back-end “hunger”. Thus, non-blocking cache is a key feature for large kernels.
ThunderX2 does not suffer from this problem at all, thanks to non-blocking cache. Just like the Skylake core in Xeon 8176, the second reading increases the total wait time only by 15-30%, not 100%. According to TinyMemBench, the Skylake core has significantly better latency. The starting point of 512 KB is easy to explain: the core Skylake still extracts from its fast L2, and the core of ThunderX2 should get access to L3. But the numbers 1 and 2 MB show that Intel prefetchers offer a significant advantage, since the wait time is the average for the L2 and L3 cache. The latency figures are similar in the range of 8 to 16 MB, but as soon as we go beyond L3 (64 MB), Intel's Skylake offers lower memory latency.
Starting to measure the actual computing performance, we will start with the SPEC CPU2006 package. Knowledgeable readers will point out that SPEC CPU2006 is outdated when SPEC CPU2017 appeared. But due to limited testing time and the fact that we could not retest ThunderX, we decided to stick with CPU2006.
Given that SPEC is almost as much a compiler's benchmark as the hardware, we think it would be appropriate to formulate our testing philosophy. It is necessary to evaluate the real indicators, and not to inflate the test results. Therefore, it is important to create, as far as possible, “as in the real world” conditions with the following settings (constructive criticism on this issue is welcome):
First, you need to measure performance in applications where, for some reason, a delay occurs due to the “unfriendly multithreaded environment” of the task. Secondly, it is necessary to understand how well the ThunderX LLC architecture works with one stream compared to Intel's Skylake architecture. Please note that in that particular Skylake model, you can overclock the frequency to 3.8 GHz. The chip will operate at a frequency of 2.8 GHz in almost all situations (28 threads are active) and will support 3.4 GHz with 14 active threads.
In general, Cavium positions ThunderX2 CN9980 ($ 1,795) as “better than 6148” ($ 3,072), a processor operating at 2.6 GHz (20 threads) and reaching 3.3 GHz without any problems (up to 16 streams are active ). On the other hand, the Intel-SKU will have a significant 30 percent clock advantage in many situations (3.3 GHz versus 2.5 GHz).
Cavium decided to compensate for the shortage of frequency with the number of cores, offering 32 cores - which is 60% more than the Xeon 6148 (20 cores). It is worth noting that a larger number of cores will lead to a decrease in recoil in many applications (for example, Amdahl). Therefore, if Cavium wants to shake Intel’s dominance with ThunderX2, each core must at least offer competitive performance in real use. Or in this case ThunderX2 should provide at least 66% (2.5 vs. 3.8) of Skylake single-stream performance.
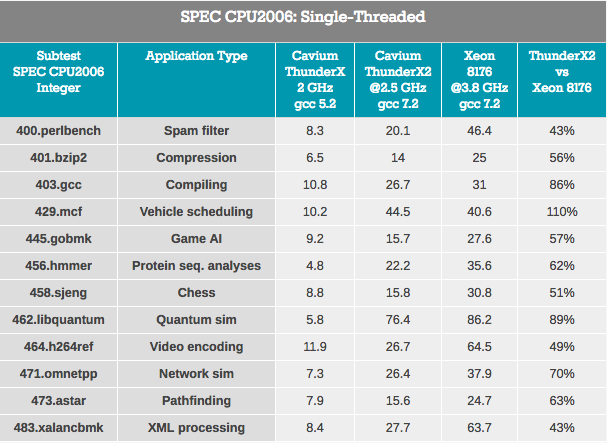
The results are blurred because ThunderX2 works with ARMv8 code (AArch64), and Xeon uses x86-64 code.
Pointer tracking tests — XML processing (also large OoO buffers) and path searching, which usually depend on a large L3 cache to reduce the impact of access latency, are the worst for ThunderX2. It can be assumed that the higher latency of the DRAM system degrades performance.
Workloads in which the impact of branch prediction is higher (at least on x86-64: a higher percentage of erroneous branch choices) - gobmk, sjeng, hmmer - are not the best loads for ThunderX2.
It is also worth noting that perlbench, gobmk, hmmer and h264ref instructions are known to benefit from the larger L2-cache (512 KB) Skylake. We show you just a few pieces of the puzzle, but together they can help put the picture together.
On the positive side, ThunderX2 has worked well for gcc, which operates mainly inside the L1 and L2 cache (thus relying on low latency L2), and the influence of the performance of the branch predictor is minimal. In general, the best subtest for TunderX2 is mcf (distribution of vehicles in public transport), which, as you know, almost completely misses the L1 data cache, relying on the L2 cache, and this is the strength of ThunderX2. Mcf is also demanding memory bandwidth. Libquantum - test, who has the greatest need for memory bandwidth. The fact that Skylake offers a rather mediocre single-threaded bandwidth is probably also the reason why ThunderX2 showed itself so well on libquantum and mcf.
Going beyond single-threaded performance, multi-threaded performance within a single core should also be considered. The Vulcan processor architecture was originally designed to use SMT4 to keep its cores loaded and increase overall throughput, and we'll talk about that now.
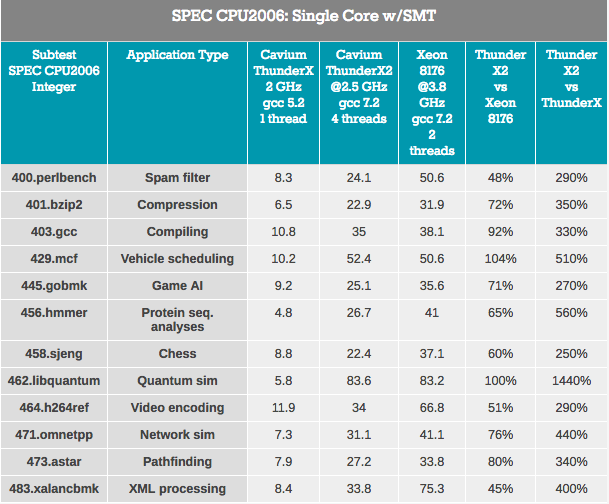
First of all, the ThunderX2 core has “undergone” many significant improvements over the first ThunderX core. Even with libquantum, this test can easily run 3 times faster on the older ThunderX kernel after some improvements and compiler optimizations. Well, the new ThunderX2 is no less than 3.7 times faster than its older brother. This superior IPC eliminates any advantages of the previous ThunderX.
Considering the impact of SMT, on average, we see that 4-way SMT improves ThunderX2 performance by 32%. This ranges from 8% for video encoding to 74% for Pathfinding. Intel, meanwhile, gains an increase of 18% from its 2-way SMT, from 4% to 37% in the same scenarios.
Overall, the ThunderX2's performance boost is 32%, which is pretty good. But then the obvious question arises: how is it different from other SMT4 architectures? For example, IBM POWER8, which also supports SMT4, shows a 76% increase in the same scenario.
However, this is not exactly a comparison of similar with similar, since the IBM chip has a much wider back-end: it can handle 10 instructions, while the ThunderX2 core is limited to 6 instructions per cycle. The POWER8 core is more gluttonous: the processor could accommodate only 10 of these “ultra-wide” cores in a 190-watt power budget with a 22 nm process. Most likely, a further increase in performance from using SMT4 will require even larger cores and, in turn, will seriously affect the number of cores available inside ThunderX2. Nevertheless, it is interesting to look at this 32% increase in the future.
In the following (3) part:
Thank you for staying with us. Do you like our articles? Want to see more interesting materials? Support us by placing an order or recommending to friends, 30% discount for Habr users on a unique analogue of the entry-level servers that we invented for you: The whole truth about VPS (KVM) E5-2650 v4 (6 Cores) 10GB DDR4 240GB SSD 1Gbps from $ 20 or how to share the server? (Options are available with RAID1 and RAID10, up to 24 cores and up to 40GB DDR4).
Dell R730xd 2 times cheaper? Only we have 2 x Intel Dodeca-Core Xeon E5-2650v4 128GB DDR4 6x480GB SSD 1Gbps 100 TV from $ 249 in the Netherlands and the USA! Read about How to build an infrastructure building. class c using servers Dell R730xd E5-2650 v4 worth 9000 euros for a penny?
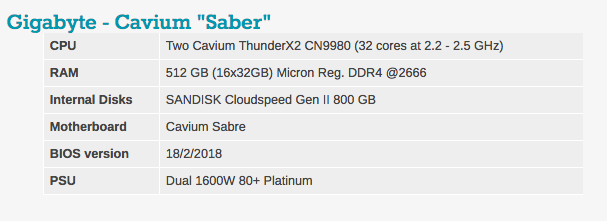
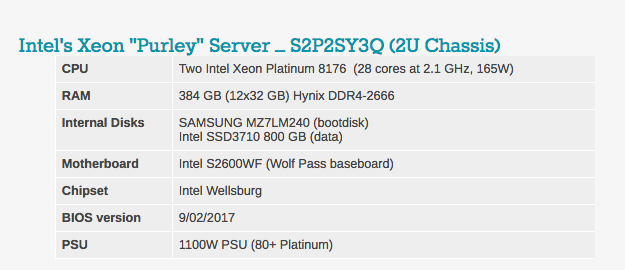
Test Configuration and Methodology
To review ThunderX2, all our tests were performed on Ubuntu Server 17.10, Linux kernel 4.13 64 bits. We usually use the LTS version, but since Cavium comes with this version of Ubuntu, we did not risk changing the OS. The Ubuntu distribution includes the GCC 7.2 compiler.
You will notice that the DRAM volume varies in our server configurations. The reason is simple: the Intel system has 6 memory channels, and the Cavium ThunderX2 has 8 memory channels.
Typical BIOS settings can be seen below. It is worth noting that hyperthreading and Intel virtualization technology are included.
Other notes
Both servers are powered according to the European standard - 230 V (maximum 16 amps). The air temperature in the room is monitored and maintained at 23 ° C with our Airwell CRAC instruments.
Power consumption
It is worth mentioning that the Gigabyte "Saber" system consumed 500 watts if it simply worked under Linux (that is, it was mostly inactive). However, under load, the system consumes about 800 W, which, in principle, met our expectations, since we have two 180 W of TDP-chip inside. As is usually the case for early test systems, we cannot make accurate power comparisons.
In fact, Cavium claims that current systems from HP, Gigabyte and others will be much more efficient. The “Saber” testing system that was used had several problems with power management: improper fan firmware control, BMC error, and too high power supply (1600 W).
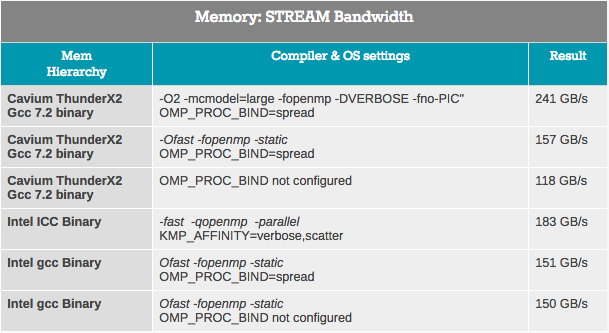
Memory subsystem: bandwidth
Measuring the full capacity of the system using the John McCalpin’s Stream bandwidth benchmark test on the latest processors becomes more difficult as the number of core and memory channels grows. As can be seen from the results below, estimating the throughput is not easy. The result strongly depends on the selected settings.
Theoretically, ThunderX2 has 33% more bandwidth than Intel Xeon, because SoC has 8 memory channels compared to six Intel channels. These high throughput figures are achieved only in very specific conditions, and require some tuning to avoid the use of remote memory. In particular, we must ensure that threads are not transferred from one socket to another.
To begin with, we tried to achieve the best results on both architectures. In the case of Intel, the ICC compiler always gave the best results with some low-level optimizations inside stream loops. In the case of Cavium, we followed the instructions of Cavium. Roughly speaking, the resulting picture is an idea of how much bandwidth these processors can reach at peaks. To be honest with Intel, with the ideal settings (AVX-512) you can achieve 200 GB / s.
Nevertheless, it is clear that the ThunderX2 system can provide from 15 to 28% more bandwidth to its processor cores. The result is 235 GB / s, or about 120 GB / s per slot. This, in turn, is about 3 times more than the original ThunderX.
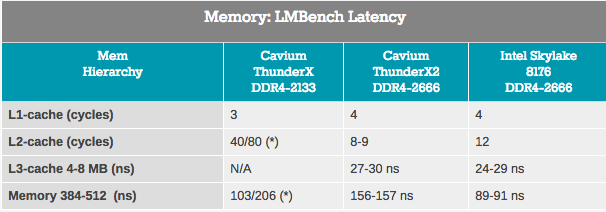
Memory subsystem: delay
Although bandwidth measurements refer only to a small part of the server market, almost every application depends heavily on the latency of the memory subsystem. In attempts to measure cache and memory latency, we used LMBench. The data we want to see in the end is “Delay at random load, step = 16 bytes”. Note that we express the L3 latency and DRAM time delay in nanoseconds, since we do not have accurate L3 cache clock values.
Access to the ThunderX2 L2 cache is done with a very low latency, and when using a single thread, the L3 cache looks like a competitor to Intel's integrated L3 cache. However, when we got to DRAM, Intel showed significantly less latency.
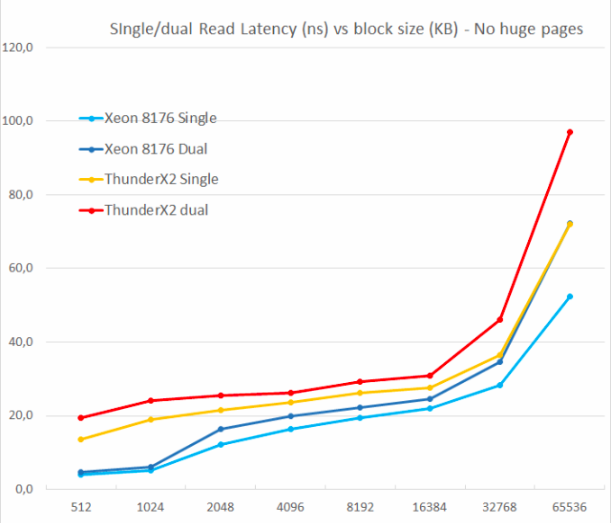
Memory subsystem: TinyMemBench
To gain a deeper understanding of the respective architectures, the TinyMemBench open-source test was used. The source code was compiled using GCC 7.2, and the optimization level was set to "-O3". Testing strategy is well described in the benchmark manual:
Average time is measured for random memory accesses in buffers of different sizes. The larger the buffer, the greater the relative contribution of TLB cache misses, L1 / L2 and DRAM calls. All numbers represent the extra time that needs to be added to the L1 cache latency (4 cycles).
We tested one and two random reads (without huge pages), because we wanted to see how the memory system handled several read requests.
One of the main drawbacks of the original ThunderX was the inability to support multiple outstanding misses. Parallelism of the memory level is an important feature for any high-performance modern processor core: with its help it avoids cache misses, which can cause back-end “hunger”. Thus, non-blocking cache is a key feature for large kernels.
ThunderX2 does not suffer from this problem at all, thanks to non-blocking cache. Just like the Skylake core in Xeon 8176, the second reading increases the total wait time only by 15-30%, not 100%. According to TinyMemBench, the Skylake core has significantly better latency. The starting point of 512 KB is easy to explain: the core Skylake still extracts from its fast L2, and the core of ThunderX2 should get access to L3. But the numbers 1 and 2 MB show that Intel prefetchers offer a significant advantage, since the wait time is the average for the L2 and L3 cache. The latency figures are similar in the range of 8 to 16 MB, but as soon as we go beyond L3 (64 MB), Intel's Skylake offers lower memory latency.
Single threaded performance: SPEC CPU2006
Starting to measure the actual computing performance, we will start with the SPEC CPU2006 package. Knowledgeable readers will point out that SPEC CPU2006 is outdated when SPEC CPU2017 appeared. But due to limited testing time and the fact that we could not retest ThunderX, we decided to stick with CPU2006.
Given that SPEC is almost as much a compiler's benchmark as the hardware, we think it would be appropriate to formulate our testing philosophy. It is necessary to evaluate the real indicators, and not to inflate the test results. Therefore, it is important to create, as far as possible, “as in the real world” conditions with the following settings (constructive criticism on this issue is welcome):
- 64 bit gcc: the most used compiler in Linux, a good compiler that does not try to “interrupt” tests (libquantum ...)
- -Ofast: compiler optimization that many developers can use
- -fno-strict-aliasing: required to compile some subtests
- base run: each subtest is compiled equally
First, you need to measure performance in applications where, for some reason, a delay occurs due to the “unfriendly multithreaded environment” of the task. Secondly, it is necessary to understand how well the ThunderX LLC architecture works with one stream compared to Intel's Skylake architecture. Please note that in that particular Skylake model, you can overclock the frequency to 3.8 GHz. The chip will operate at a frequency of 2.8 GHz in almost all situations (28 threads are active) and will support 3.4 GHz with 14 active threads.
In general, Cavium positions ThunderX2 CN9980 ($ 1,795) as “better than 6148” ($ 3,072), a processor operating at 2.6 GHz (20 threads) and reaching 3.3 GHz without any problems (up to 16 streams are active ). On the other hand, the Intel-SKU will have a significant 30 percent clock advantage in many situations (3.3 GHz versus 2.5 GHz).
Cavium decided to compensate for the shortage of frequency with the number of cores, offering 32 cores - which is 60% more than the Xeon 6148 (20 cores). It is worth noting that a larger number of cores will lead to a decrease in recoil in many applications (for example, Amdahl). Therefore, if Cavium wants to shake Intel’s dominance with ThunderX2, each core must at least offer competitive performance in real use. Or in this case ThunderX2 should provide at least 66% (2.5 vs. 3.8) of Skylake single-stream performance.
The results are blurred because ThunderX2 works with ARMv8 code (AArch64), and Xeon uses x86-64 code.
Pointer tracking tests — XML processing (also large OoO buffers) and path searching, which usually depend on a large L3 cache to reduce the impact of access latency, are the worst for ThunderX2. It can be assumed that the higher latency of the DRAM system degrades performance.
Workloads in which the impact of branch prediction is higher (at least on x86-64: a higher percentage of erroneous branch choices) - gobmk, sjeng, hmmer - are not the best loads for ThunderX2.
It is also worth noting that perlbench, gobmk, hmmer and h264ref instructions are known to benefit from the larger L2-cache (512 KB) Skylake. We show you just a few pieces of the puzzle, but together they can help put the picture together.
On the positive side, ThunderX2 has worked well for gcc, which operates mainly inside the L1 and L2 cache (thus relying on low latency L2), and the influence of the performance of the branch predictor is minimal. In general, the best subtest for TunderX2 is mcf (distribution of vehicles in public transport), which, as you know, almost completely misses the L1 data cache, relying on the L2 cache, and this is the strength of ThunderX2. Mcf is also demanding memory bandwidth. Libquantum - test, who has the greatest need for memory bandwidth. The fact that Skylake offers a rather mediocre single-threaded bandwidth is probably also the reason why ThunderX2 showed itself so well on libquantum and mcf.
SPEC CPU2006 Cont: kernel-based performance with SMT
Going beyond single-threaded performance, multi-threaded performance within a single core should also be considered. The Vulcan processor architecture was originally designed to use SMT4 to keep its cores loaded and increase overall throughput, and we'll talk about that now.
First of all, the ThunderX2 core has “undergone” many significant improvements over the first ThunderX core. Even with libquantum, this test can easily run 3 times faster on the older ThunderX kernel after some improvements and compiler optimizations. Well, the new ThunderX2 is no less than 3.7 times faster than its older brother. This superior IPC eliminates any advantages of the previous ThunderX.
Considering the impact of SMT, on average, we see that 4-way SMT improves ThunderX2 performance by 32%. This ranges from 8% for video encoding to 74% for Pathfinding. Intel, meanwhile, gains an increase of 18% from its 2-way SMT, from 4% to 37% in the same scenarios.
Overall, the ThunderX2's performance boost is 32%, which is pretty good. But then the obvious question arises: how is it different from other SMT4 architectures? For example, IBM POWER8, which also supports SMT4, shows a 76% increase in the same scenario.
However, this is not exactly a comparison of similar with similar, since the IBM chip has a much wider back-end: it can handle 10 instructions, while the ThunderX2 core is limited to 6 instructions per cycle. The POWER8 core is more gluttonous: the processor could accommodate only 10 of these “ultra-wide” cores in a 190-watt power budget with a 22 nm process. Most likely, a further increase in performance from using SMT4 will require even larger cores and, in turn, will seriously affect the number of cores available inside ThunderX2. Nevertheless, it is interesting to look at this 32% increase in the future.
In the following (3) part:
- Java performance
- Java performance: huge pages
- Apache Spark 2.x Benchmarking
- Total
Thank you for staying with us. Do you like our articles? Want to see more interesting materials? Support us by placing an order or recommending to friends, 30% discount for Habr users on a unique analogue of the entry-level servers that we invented for you: The whole truth about VPS (KVM) E5-2650 v4 (6 Cores) 10GB DDR4 240GB SSD 1Gbps from $ 20 or how to share the server? (Options are available with RAID1 and RAID10, up to 24 cores and up to 40GB DDR4).
Dell R730xd 2 times cheaper? Only we have 2 x Intel Dodeca-Core Xeon E5-2650v4 128GB DDR4 6x480GB SSD 1Gbps 100 TV from $ 249 in the Netherlands and the USA! Read about How to build an infrastructure building. class c using servers Dell R730xd E5-2650 v4 worth 9000 euros for a penny?