Master parts chart using Highcharts and jQuery UI
In the presence of a large amount of statistical data, such as, for example, quotes of currencies (and other data related to financial topics), the consumption of something (water, etc.), generally speaking, any data that can somehow be presented in in the form of a pair “date - value”, it is convenient to present them in graphical form. Since the data can be collected over a sufficiently long period of time, it makes sense to present them as a pair of graphs: a “master” graph on which all points will be displayed, and a “detail” graph where points will be displayed for the required period. In this article I will try to tell how to build a graph of this type using standard tools of the HighCharts and jQuery UI libraries.
The solution below is basically a bicycle, as with the advent of a new product from HighCharts developers, which was called HighStock, there is no need to implement it in this way. However, HighStock is still in beta state.
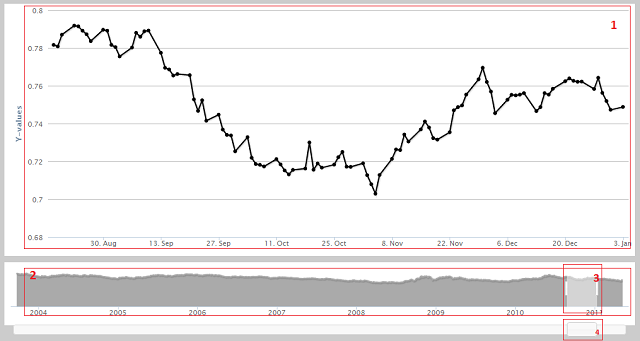
In the figure above, 4 zones are selected that correspond to what will be necessary to implement:
Obviously, HighCharts will be used to display charts, and jQuery UI Silder for sliders. HTML markup is nothing more than 4 consecutive DIVs, which are located in accordance with the list above. Not everything is so simple with JS, here the main problem is the synchronization of the scrollbar, slider and “details” graphics. There are no difficulties in creating and updating schedules; configuration can be easily dealt with using the documentation. Of the principal features, it is worth noting that on the “master” chart, you should leave only the X axis and its labels, and hide the remaining service elements.
Sliders are created as follows:
The limiting values of the slider and scrollbar are the same: the left border corresponds to the minimum date, the right - to the maximum.
Range-slider (number 3 in the figure) allows you to change the right and left borders of the displayed period. In parallel with changing the borders, the width of the handle of slider No. 4, which is used as a scrollbar, should also change. For these purposes, the corresponding handlers are assigned to the slide event . The schedule update should be assigned to the stop event of the sliders in order to avoid brakes due to the constant redrawing when using any of the sliders.
Since chart No. 3 is a range slider, when updating it is only necessary to set the left and right borders, the rest of jQuery will do just fine. In the case of a scrollbar, the size of the handle must be changed manually, because such a feature is not provided by default (and indeed, why?). When doing this, do the following:
This measure will allow you not to leave the scrollbar handle visually half the body per container. In addition, since Since this slider takes a single value corresponding to the middle of the handle, the value of the scrollbar will be equal to the position of the left edge plus half its width. Also, when using a scrollbar, you need to monitor if it has reached the right or left edge, and stop it in this case (using preventDefault ).
Given the above, in my case, the handlers looked like this:
As a result, following the instructions, you can create something like this: a demo . Using CSS, you can make an appearance almost anything. It’s easy to add things to the resulting graph, such as dynamic loading and updating, data comparison, etc.
References:
The solution below is basically a bicycle, as with the advent of a new product from HighCharts developers, which was called HighStock, there is no need to implement it in this way. However, HighStock is still in beta state.
How will it look like
In the figure above, 4 zones are selected that correspond to what will be necessary to implement:
- Details chart
- Schedule "master"
- Period displayed
- Scrollbar for drag and drop period
First look
Obviously, HighCharts will be used to display charts, and jQuery UI Silder for sliders. HTML markup is nothing more than 4 consecutive DIVs, which are located in accordance with the list above. Not everything is so simple with JS, here the main problem is the synchronization of the scrollbar, slider and “details” graphics. There are no difficulties in creating and updating schedules; configuration can be easily dealt with using the documentation. Of the principal features, it is worth noting that on the “master” chart, you should leave only the X axis and its labels, and hide the remaining service elements.
Sliders
Sliders are created as follows:
function createSlider()
{
    var sliderId = "#" + _sliderContainerId;
    $(sliderId).slider({
        range: true,
        min: _minDate,
        max: _maxDate,
        values: [_minDate, _maxDate],
        stop: onSliderStop,
        slide: onSliderSlide
    });
    $(sliderId + " > .ui-widget-header").addClass(_sliderRangeClass);
    $(sliderId + " > .ui-slider-handle").addClass(_sliderHandleClass);
    $(sliderId).show();
    createScrollbar();
}
function createScrollbar()
{
    var scrollId = "#" + _scrollbarContainerId;
    $(scrollId).slider({
        min: _minDate,
        max: _maxDate,
        slide: onScrollbarSlide,
        stop: onScrollbarStop
    });
    $(scrollId + " > .ui-slider-handle").addClass(_scrollbarHandleClass);
    $(scrollId).show();
}
The limiting values of the slider and scrollbar are the same: the left border corresponds to the minimum date, the right - to the maximum.
Range-slider (number 3 in the figure) allows you to change the right and left borders of the displayed period. In parallel with changing the borders, the width of the handle of slider No. 4, which is used as a scrollbar, should also change. For these purposes, the corresponding handlers are assigned to the slide event . The schedule update should be assigned to the stop event of the sliders in order to avoid brakes due to the constant redrawing when using any of the sliders.
Since chart No. 3 is a range slider, when updating it is only necessary to set the left and right borders, the rest of jQuery will do just fine. In the case of a scrollbar, the size of the handle must be changed manually, because such a feature is not provided by default (and indeed, why?). When doing this, do the following:
scrollbar.css("margin-left", -1 * width / 2 - 1);
This measure will allow you not to leave the scrollbar handle visually half the body per container. In addition, since Since this slider takes a single value corresponding to the middle of the handle, the value of the scrollbar will be equal to the position of the left edge plus half its width. Also, when using a scrollbar, you need to monitor if it has reached the right or left edge, and stop it in this case (using preventDefault ).
Given the above, in my case, the handlers looked like this:
function updateSlider(from, to)
{
    _from = from;
    _to = to;
    var $slider = $("#" + _sliderContainerId);
    $slider.slider("values", 0, from);
    $slider.slider("values", 1, to);
}
function updateScrollbar(from, to)
{
    var range = to - from;
    var $scrollbar = $("." + _scrollbarHandleClass);
    var width = $("." + _sliderRangeClass).width();
    $scrollbar.width(width);
    $scrollbar.css("margin-left", -1 * width / 2 - 1);
    $scrollbar.attr("range", range);
    $("#" + _scrollbarContainerId).slider("value", from + range / 2);
}
function onSliderSlide(event, ui)
{
    var from = _from = ui.values[0];
    var to = _to = ui.values[1];
    var fromDate = new Date(from).toUTCString();
    var toDate = new Date(to).toUTCString();
    updateScrollbar(from, to);
}
function onSliderStop(event, ui)
{
    updateChart(ui.values[0], ui.values[1]);
}
function onScrollbarSlide(event, ui)
{
    var value = ui.value;
    var range = $("." + _scrollbarHandleClass).attr("range") * 1;
    var minReached = value - _minDate < range / 2;
    var maxReached = _maxDate - value < range / 2;
    if (minReached)
    {
        updateSlider(_minDate, _minDate + range);
        event.preventDefault();
        return;
    }
    if (maxReached)
    {
        updateSlider(_maxDate - range, _maxDate);
        event.preventDefault();
        return;
    }
    updateSlider(value - range / 2, value + range / 2);
}
function onScrollbarStop(event, ui)
{
    var value = ui.value;
    var range = $("." + _scrollbarHandleClass).attr("range") * 1;
    updateChart(value - range / 2, value + range / 2);
}
results
As a result, following the instructions, you can create something like this: a demo . Using CSS, you can make an appearance almost anything. It’s easy to add things to the resulting graph, such as dynamic loading and updating, data comparison, etc.
References: