Monitoring system and recording signals for Arduino and not only
Hello. Another attempt to make a normal system for displaying a graph of data values.
I present my development - software "SVisual" - monitoring signals online and recording the archive to disk. You can watch / record any signals, not only with arduino.
The idea began to soar about 7 years ago, when I was still engaged in automation. Forces appeared as in development at high gone.
The project is more than a year. Everything was written along the way and the presence of time, at first a monolith - a server and only a viewing, then an archive, a monitor ... So I got to arduinka.
I wanted to have a penny from this case at first, but promotion is another topic altogether, and even to a product for which it’s not a shame to take something, far away. Therefore, I decided to make a contribution to opensrc, a little bit at least to pay.
Software partially cross-platform - Windows and Linux (CentOS). Everything is written in C ++, visualization in Qt. Interface and manual in Russian. I started translating into English, yes ...
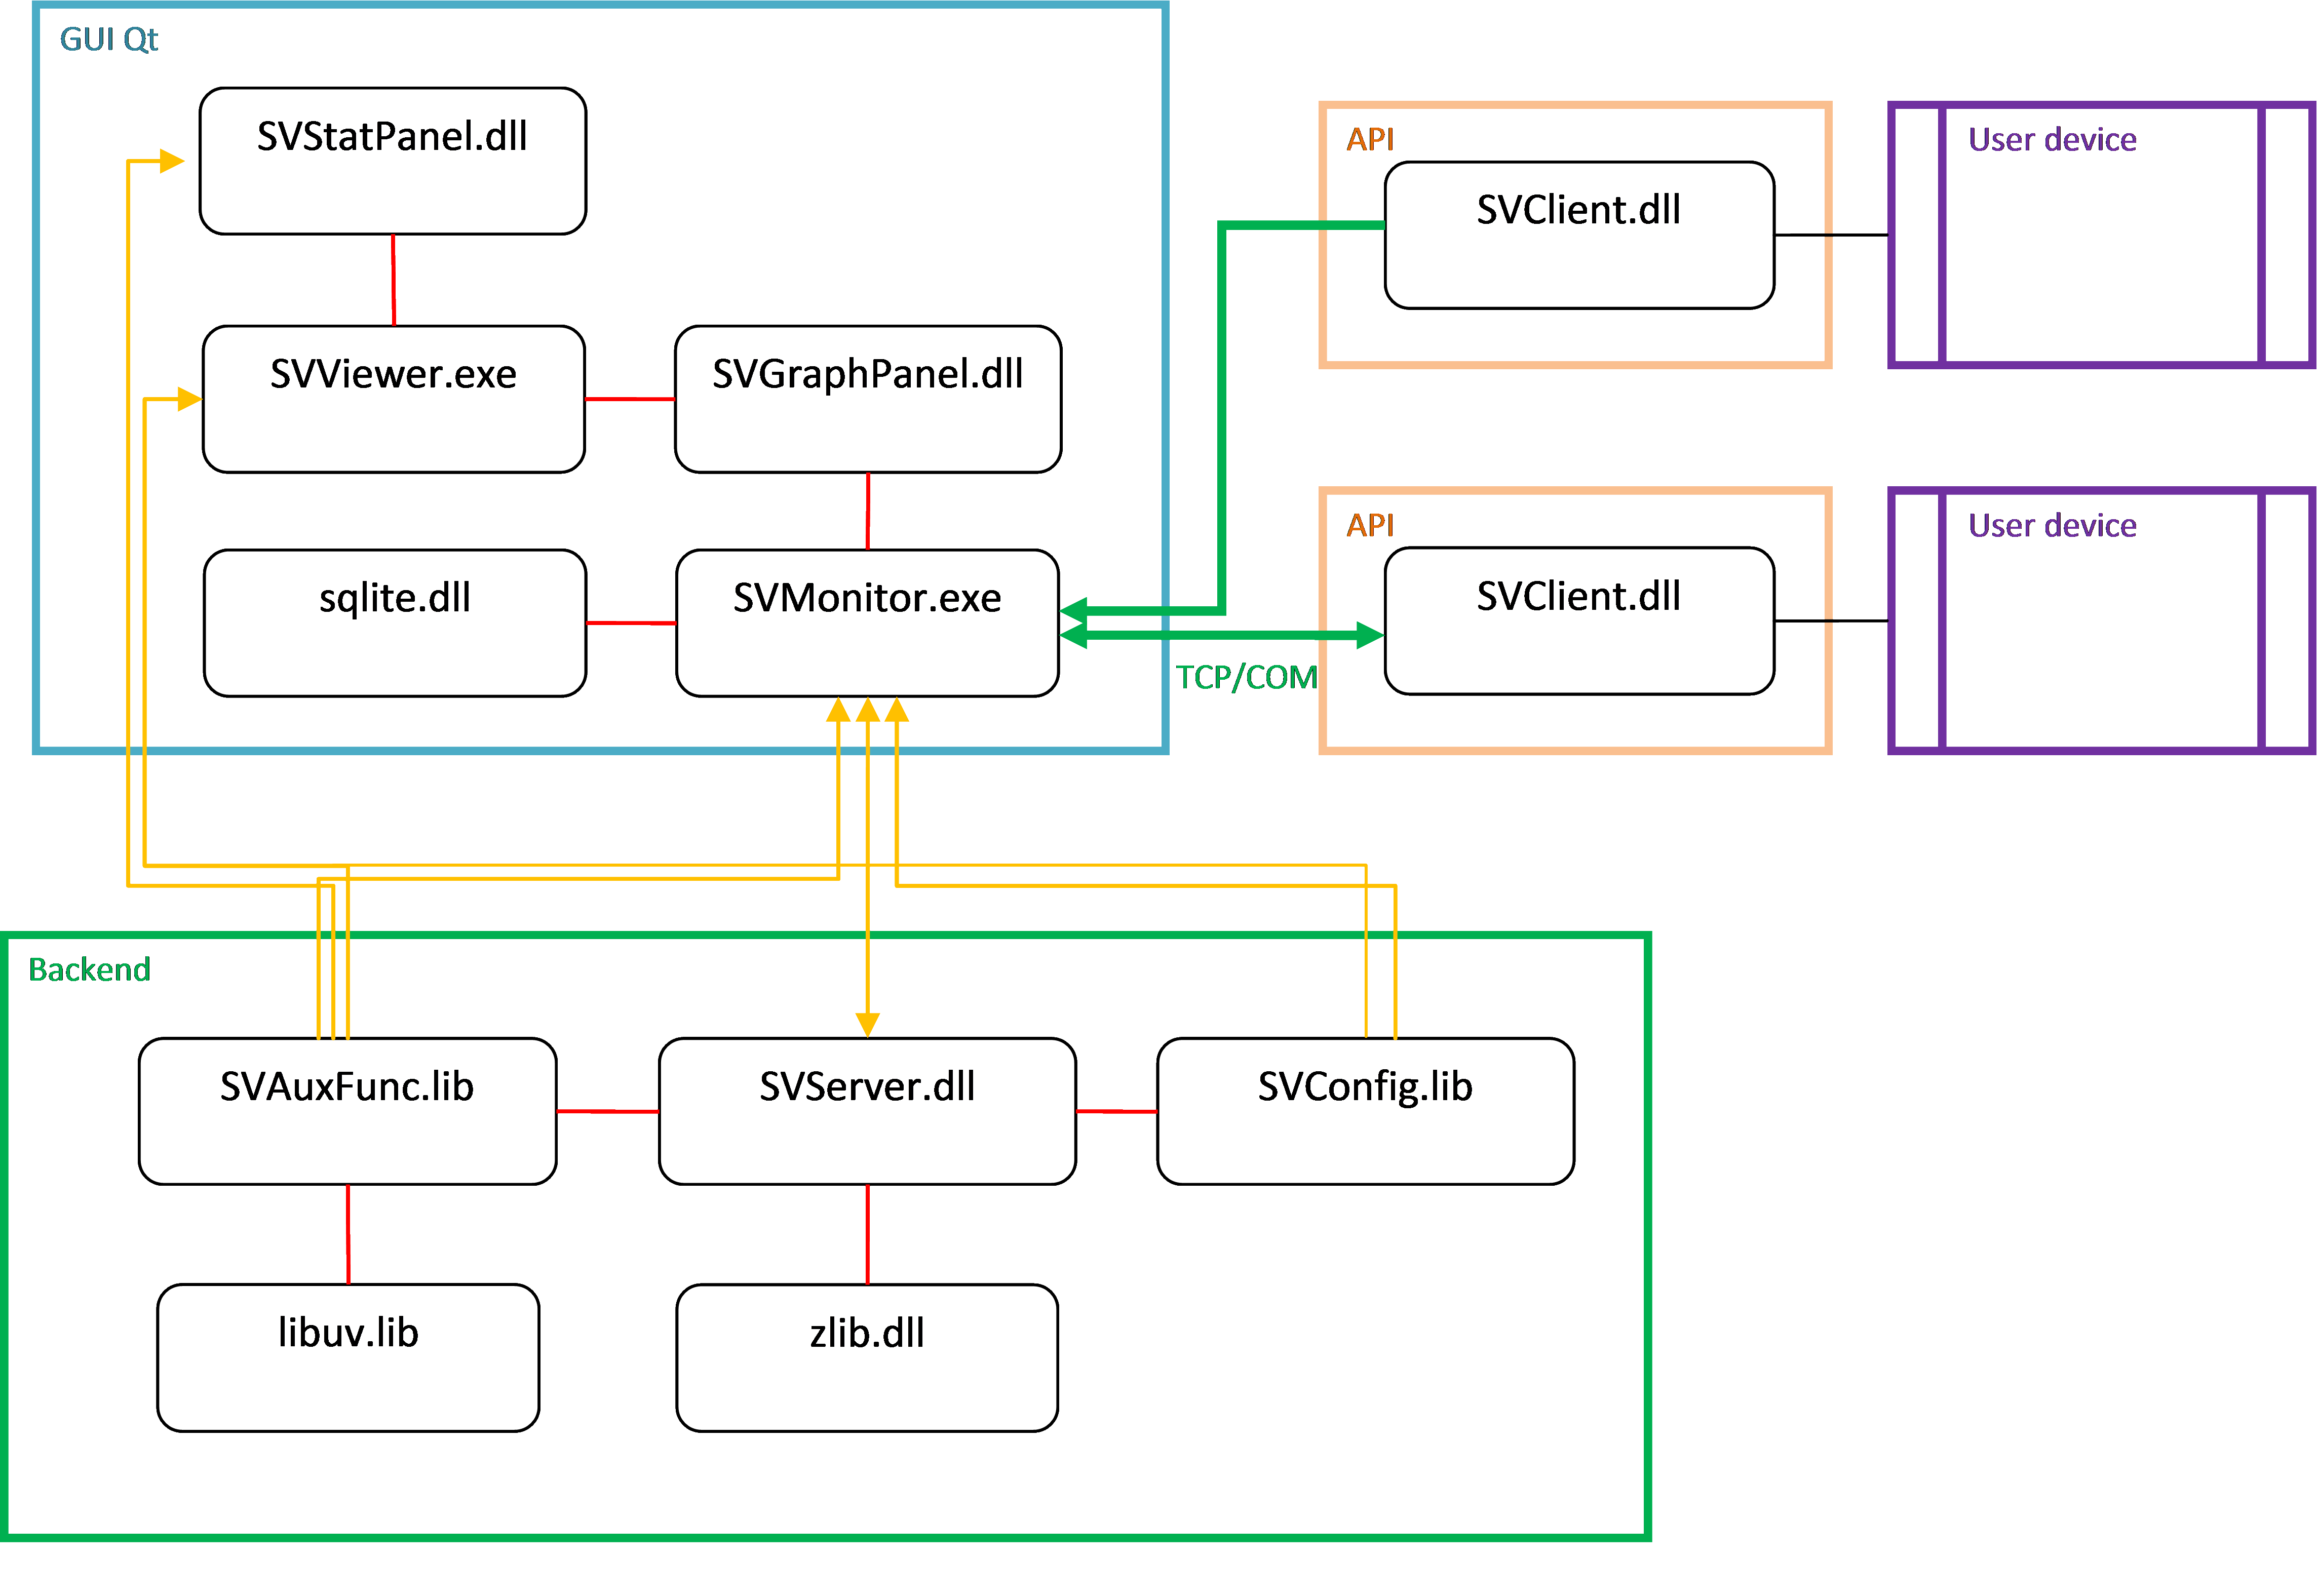
The SVisual system consists of three parts:
A bit of dry description of the possibilities.
- connection to MC via COM port (usb for arduino), via Ethernet or Wi-Fi TCP;
- polling the values of signals in real time with a frequency of 100 Hz (down, those 100 Hz - maximum, default 10 Hz), the number of devices and signals is selected by the user;
- the permissible number of signals for recording is 2048, the number of modules 8 (if you exceed anything terrible will happen, there will be only a warning, a reserve is provided);
- output values of the selected signals on the monitor screen in real time;
- recording the archive of signals on a PC hard disk;
- view the archive using additional software SVViewer;
- the ability to set alerts about the event (triggers), start the user process when the trigger is triggered;
- adding a signal for viewing / recording only by the client, no additional movements are required.
Here, in principle, I think everything is clear. I will say a few words.
Clients transmit data to the monitor, the monitor transfers to the data processing server (SVServer.dll). The server is engaged in buffering, writing to disk, processing triggers - user tags. Inside, everything is asynchronous.
Data gets to disk every 10 minutes, compressed using zlib. Archive files are obtained in hours, the default is 2 hours file.
The data processing server can be used independently of the monitor, for example, purely as a service for recording an archive.
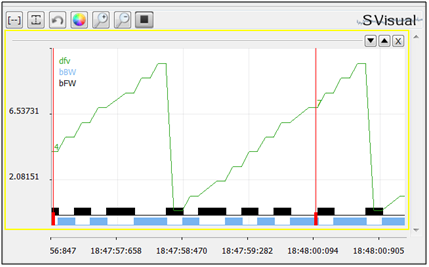
As a result, you will see:
software is distributed freely, MIT license.
Thank.
I present my development - software "SVisual" - monitoring signals online and recording the archive to disk. You can watch / record any signals, not only with arduino.
Immediately roller for priming
The idea began to soar about 7 years ago, when I was still engaged in automation. Forces appeared as in development at high gone.
The project is more than a year. Everything was written along the way and the presence of time, at first a monolith - a server and only a viewing, then an archive, a monitor ... So I got to arduinka.
I wanted to have a penny from this case at first, but promotion is another topic altogether, and even to a product for which it’s not a shame to take something, far away. Therefore, I decided to make a contribution to opensrc, a little bit at least to pay.
Software partially cross-platform - Windows and Linux (CentOS). Everything is written in C ++, visualization in Qt. Interface and manual in Russian. I started translating into English, yes ...
The SVisual system consists of three parts:
- SVMonitor - a graphical application for online viewing and recording of the archive;
- SVViewer - a graphical application for viewing archive records;
- SVClient is a user library for sending data. For arduino sketch.
A bit of dry description of the possibilities.
SVMonitor features:
- connection to MC via COM port (usb for arduino), via Ethernet or Wi-Fi TCP;
- polling the values of signals in real time with a frequency of 100 Hz (down, those 100 Hz - maximum, default 10 Hz), the number of devices and signals is selected by the user;
- the permissible number of signals for recording is 2048, the number of modules 8 (if you exceed anything terrible will happen, there will be only a warning, a reserve is provided);
- output values of the selected signals on the monitor screen in real time;
- recording the archive of signals on a PC hard disk;
- view the archive using additional software SVViewer;
- the ability to set alerts about the event (triggers), start the user process when the trigger is triggered;
- adding a signal for viewing / recording only by the client, no additional movements are required.
Software architecture
Here, in principle, I think everything is clear. I will say a few words.
Clients transmit data to the monitor, the monitor transfers to the data processing server (SVServer.dll). The server is engaged in buffering, writing to disk, processing triggers - user tags. Inside, everything is asynchronous.
Data gets to disk every 10 minutes, compressed using zlib. Archive files are obtained in hours, the default is 2 hours file.
The data processing server can be used independently of the monitor, for example, purely as a service for recording an archive.
Arduino example
#include<SVClient.h>voidsetup(){
	bool ok = svisual::connectOfCOM("test");
}
int cnt = 0;
voidloop(){
	svisual::addIntValue("dfv", cnt);
	++cnt;
	if (cnt > 10) cnt = 0;
	bool odd_cnt = cnt % 2;
        svisual::addBoolValue("bFW", odd_cnt );
        svisual::addBoolValue("bBW", !odd_cnt );
	delay(200);
}
As a result, you will see:
software is distributed freely, MIT license.
Thank.