STM32 + NetBeans =?

As is known, compatibility with the GNU toolkit and GDB support make virtually any popular development environment suitable for debugging a wide range of embedded platforms, most often free and legal. In theory.
What happens in practice when trying to make friends with STM32 and NetBeans, and is it possible in principle to get a workable system with the support of the latest stones - under the cut.
Spoiler
Yes. But no.
Some lyrics
I did not want to move off the microchip. However, after the company's purchase of Atmela, they first covered up perhaps one of the most promising families in the company's portfolio - PIC32MM, and then the entire MIPS line. It became obvious that in the foreseeable future, the transition to ARM was inevitable, and since the Microchip in two years did not integrate the support of the atmelovsky controllers into its ecosystem, "Stay with us" did not give any advantages. Rather, the opposite is true: upward-adjusted pricing policies and the traditional organizational difficulties of merging companies have made Atmelovo's automated workplaces less attractive. At the same time, the project turned up, on which the PIC32MZ just stumbled. The critical mass was gained.
Why STM: wide market coverage, budget debugging, free-of-charge, full-featured SW4STM32 environment based on the open source, and the political aspect - ST Microelectronics is supported by the French government as a strategic resource, so there is no threat of a sudden exit from the market or takeover.
Debugging - First Impressions
SW4STM32 was established in the traditional way - by pressing the Next> button several times (* hereinafter all experiments take place on Win7 x64). A demo project suitable for testing the necessary function was removed from the STM32Cube Firmware package, everything worked out more or less right out of the box. The first launch of the JTAG emulator left an impression: the whole cycle of entering debug mode, starting from the connection and ending with stopping at the beginning of main () with updating the context, it turns out, can take 1-2 seconds. Compared to microchip debuggers (even REAL ICE for half a thousand), the difference in speed is multiple!
And yet, something unpleasantly surprised.
What's wrong with Eclipse / SW4STM32
A myriad of settings and illogical organization, hidden menu items, perspectives, interface bugs and visual artifacts, missing frequently used hot buttons and functions on the toolbar, small clumsy unreadable icons and markers, the lack of “Find Usages” are partly subjective and can be adapted if desired . But: regularly forgets to save the modified files before the assembly, although all the check marks where necessary must be affixed; when forced manual saving does not see the changes, and the incremental assembly is irrelevant; there is no complete reassembly (Clean and Build) as a single command, while after a forced cleanup through the Clean Project, the assembly occurs with errors (file access?), and successfully completed only on the 4th attempt - this is no longer a reasonable explanation. Even in the early Beta releases of MPLAB X based on the ancient NetBeans 6.
In addition, with SW4STM32, 3 copies of typical IDEs are already typed in the system, since in addition to it there are still tightly nailed to NetBeans 8.0.1 and in some way fenced off MPLAB X (i.e. it cannot be used for other languages / platforms), and NetBeans 8.2 for Java and C / C ++.
It turns out that setting up NetBeans 8.2 for working with STM32 will eliminate the described practical problems of Eclipse, reduce the number of copies of the IDE, and reduce to one platform, albeit slightly different versions.
NetBeans 8.2 and GNU ARM Tools
NetBeans is better to use 32-bit, because in addition to double the memory consumption, it was not possible to detect differences of the 64-bit version.
Google quickly found a setup guide . The principal difference was only in the OS (they have Linux against Win7 x64), so the installation of the * MSI nix environment, which is included in the MinGW package, became a bonus game. The toolchain settings should look like this:
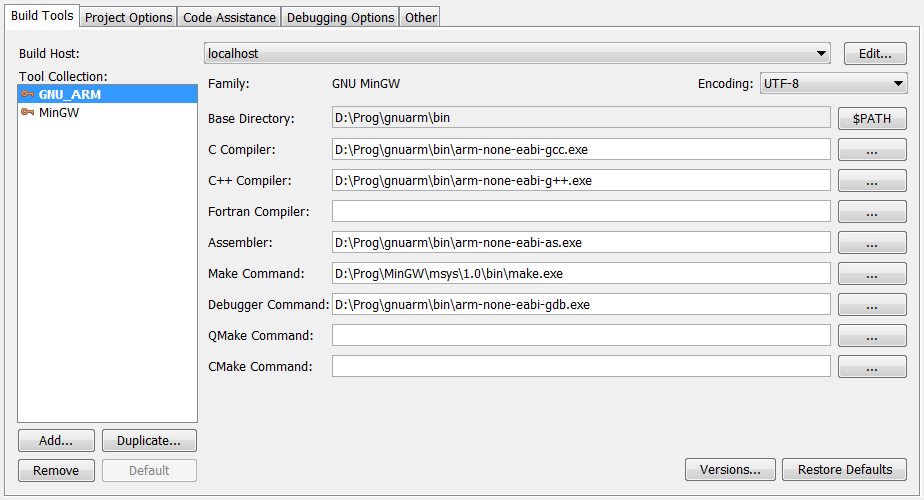
An important point is when adding a GNU ARM toolchain, select the “GNU MinGW” family, in which case NetBeans will correctly call MSYS. If Cygwin is already installed on the machine, it will be logical to use it, respectively, the GNU ARM family must select "GNU Cygwin".
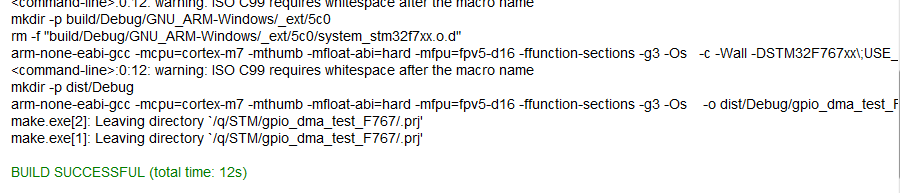
Successful compilation was not easy, but very simple. Since SW4STM32 uses the same compiler, having looked at the command line of the compiler call in SW4STM32 and copied the missing keys in Project Properties → C Compiler → Additional Options

we get exactly the same output, but with an important practical difference - everything is collected from the first, Clean and Build is and works great:
But this result can be improved by adding optional Post-Build processing. Open the Makefile, and in the section .build-post: .build-impl we add:
.build-post: .build-impl
	cp ${CND_DISTDIR}/${CONF}/${CND_ARTIFACT_NAME_${CONF}} ${CND_ARTIFACT_NAME_${CONF}}
	arm-none-eabi-objcopy -O ihex ${CND_ARTIFACT_NAME_${CONF}} ${CND_ARTIFACT_NAME_${CONF}}.hex
	arm-none-eabi-size ${CND_ARTIFACT_NAME_${CONF}}
(important - the indentation should be a single tab character, not spaces)
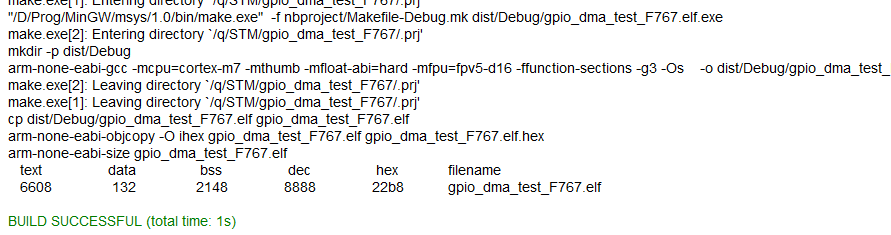
Line by line: 1 - copies the object file (.elf) from the output folder to the project root, for easy access; 2 - generates HEX from elf (can be commented out if HEX is not needed); 3 - displays the amount of memory used by segments.
Final result:
So far, so good.
OpenOCD - the first difficulties
In the above-mentioned online manuals, crystal programming through OpenOCD proceeds simply and routinely. The latest version (0.10.0) is installed, the configuration file is taken (from the OpenOCD bundle or from the SW4STM32 project folder), a command of the following type is entered into the Project Properties → Run:

and everything works right away. Indeed, this is the case for younger families of the type STM32F103 and F407, but I am interested in F7 and H7. With the first official version of OpenOCD 0.10.0 crashes with the errors "auto_probe failed" and "undefined debug reason 7"; the latter are not supported at all. Tried all available official assemblies 0.10.0 from January 2017 and January 2018 - the result is identical. A keyword search confirms the existence of the problem, although you cannot call it mass; parsing and no solution.
But there is a version that is guaranteed to work - from the set of SW4STM32. Naturally, it turns out to be improved and enhanced, with new scripts and support for the H7 family. It also changed the file structure, and the plug-in resources are stored in a separate module, therefore, in order for the utility consolidated in a single folder to see its scripts, the –s key was required.
Board.cfg for the NUCLEO-F767ZI, minus the comments, and compressed:
set CHIPNAME STM32F767ZITx
source [find interface/stlink-v2-1.cfg]
transport select hla_swd
source [find target/stm32f7x.cfg]
set WORKAREASIZE 0x10000set ENABLE_LOW_POWER 1set STOP_WATCHDOG 1
reset_config srst_only srst_nogate connect_assert_srst
set CONNECT_UNDER_RESET 1
Finally run through the Run Main Project:
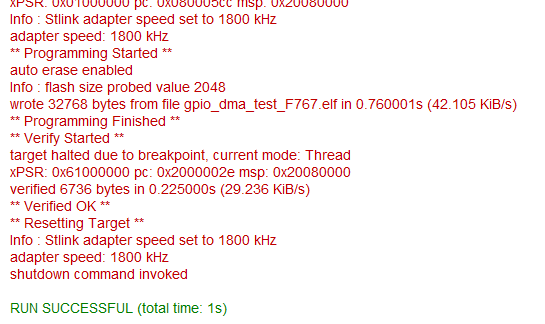
The firmware is successful, the code is being executed.
Debugging
The scheme is the most traditional: a local GDB server on OpenOCD, NetBeans connects to it via localhost: 3333 via TCP. Accordingly, NetBeans will require the Gdbserver plugin.
You can simplify the launch of OpenOCD through a bat-script, and since after the session is over it goes to the console, it makes sense to loop restart endlessly:
:start
openocd -f debug.cfg -s d:/Prog/openocd/scripts
goto start
Run:
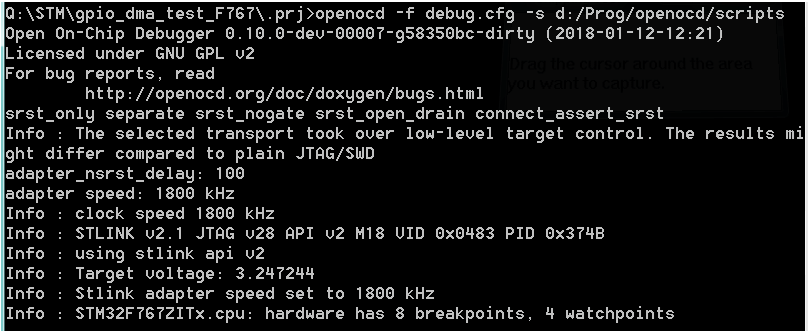
The version from SW4STM32 is not explicitly written, but the server is waiting for a TCP connection to port 3333. In NetBeans, you must select Debug → Attach Debugger ..., and install:
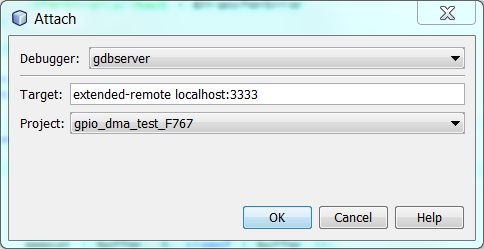
Session is active. OpenOCD terminal:
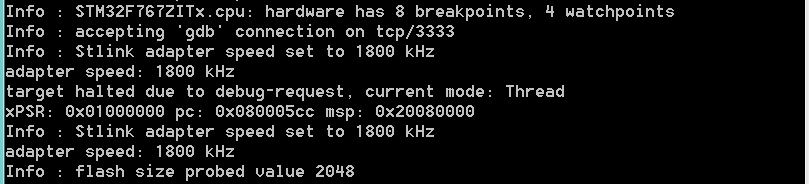
In appearance, everything looks good - the debugging session is active, the code is being executed. However, the problem still exists.
Problem
In free run mode, execution cannot be stopped.
If you set breakpoint before starting the session, when entering debugging, the context will be stopped with updating, step-by-step execution and viewing / changing of variables will work, i.e., in principle, all the basic functions necessary for full debugging:
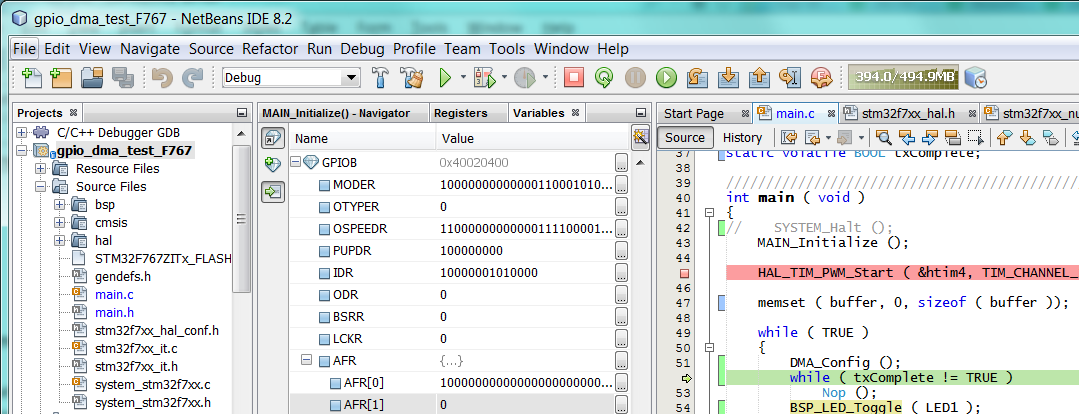
But only until the next free launch, after which it remains only to close and restart the session.
Another unpleasant trifle is related to software breakpoints: the SYSTEM_Halt () function is defined as __asm__ (“bkpt”), and its triggering results in displaying an unnecessary dialog:
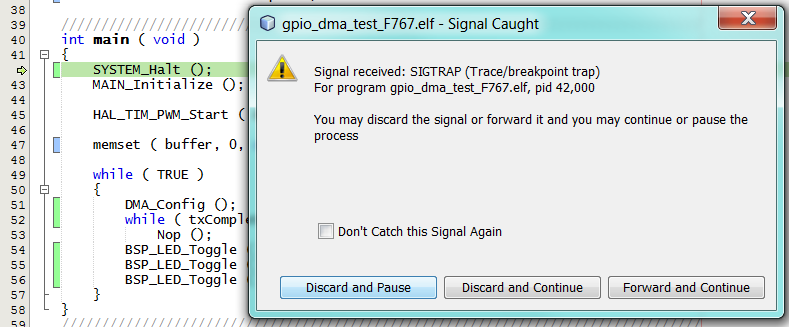
Pressing Discard and Pause works as required (i.e., stops execution), however it is not possible to set this option by default and disable the window display by standard means.
To heaps, I would like to automate the launch of OpenOCD and the connection of the debugger directly through NetBeans.
However, objectively, the only function that is not enough for more or less complete debugging is to stop the execution (it is also required for setting breakpoint on the fly).
Debug debugging
A Google search revealed that there were similar problems with a broken GDB stop on NetBeans, but were fixed a few years ago. In the absence of a better idea, the NetBeans sources were downloaded in the hope of running the debugger through live. Surprisingly, we rather quickly managed to localize the problem before calling the external utility GdbKillProc.exe, which is essentially a wrapper for DebugBreakProcess (pid) from WinAPI. The principle of operation of the utility is reduced to non-intrusive interruption of the process (similar to “kill -SIGINT [pid]” under * nix, or Ctrl + C in the console).
But it does not work.
What has been tested
In console mode, the GDB client (arm-none-eabi-gdb.exe) responds correctly to Ctrl + C, that is, it stops the execution of the code without closing the session, and waits for further instructions.
ps -W and Windows Process Explorer display the process correctly, and the PID matches the internal variable in NetBeans.
A manual call to "kill -SIGINT [pid]" from the MSYS package gives the error "No such process".
Checking through “taskkill / pid [pid]” produces “The process ... couldn’t be terminated ... This process can only be terminated forcefully ...”, which seems to indicate a system blocking. With the / f key, the process closes completely, which is also not suitable.
Along the way, it turned out that in Windows the situation with the generation of interrupt signals is unimportant, or rather, in no way: only the analogue SIGTERM is standardly supported, which corresponds to a rough cutting down of the process, and there is no generally accepted solution.
On the Internet, a windows-kill utility has been discovered, created to emulate Ctrl + C and Ctrl + Brk. The process finds, the interrupt sends without errors, but the GDB client still does not respond.
Experiments were conducted using all 32-bit versions (NetBeans, ARM Tools, MSYS 1.0), except for windows-kill, which 32-bit refused to start ("... unable to start correctly ..."). Perhaps this is the problem, because, according to the fragmentary data from the forums and bug trackers, the bitness of the utility and the process should be the same. The difficulty here is that ARM does not offer the x64 version of the toolchain under Windows, that is, the only way to eliminate the heterogeneity is to get the x32 version of windows-kill to work, which is also not clear if Win x64 is possible in principle.
In the middle of the process, the OS was reinstalled from scratch, and no changes in the experimental behavior were observed, that is, with great confidence, the features of a particular system can be excluded.
Hall assistance required
Actually, all of the above can be considered an introduction to this paragraph.
The last step remains to make debugging of STM32 under NetBeans real: you
need a working SIGINT interrupt signal transfer mechanism (Ctrl + C) to the Windows GDB client process.
Below is a recommendation for setting the minimum configuration sufficient to test / debug the above problem. If / when it is resolved, the article will be converted to a simple step-by-step guide to configuring NetBeans + OpenOCD for several different families and debugging boards. Further functionality can be finished at will, already having a workable basic solution.
Test setup
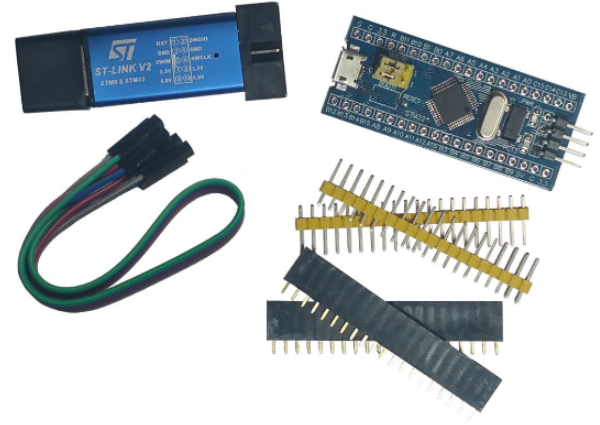
As a hardware platform, it is proposed to use Blue Pill based on STM32F103C8T6 and clone ST-Link V2.
It is necessary:
1. Install GNU Arm Embedded Toolchain
2. Install OpenOCD 0.10.0 ( build under Win )
3. Register the bin folders of both packages in PATH (Control Panel → System → Advanced System Settings → Environment Variables ... → Path).
4. In a convenient place to create a file board.cfg, copy the contents:
source [find interface/stlink-v2.cfg]
source [find target/stm32f1x.cfg]
transport select "hla_swd"
reset_config none separate
setWORKAREASIZE0x5000setCHIPNAMESTM32F103C8T6setENABLE_LOW_POWER1setSTOP_WATCHDOG1setCLOCK_FREQ4000setCONNECT_UNDER_RESET1
5. Choose a suitable test firmware (test.elf), the main criterion - so that the execution and the stop are clearly distinguishable. Copy to a convenient place.
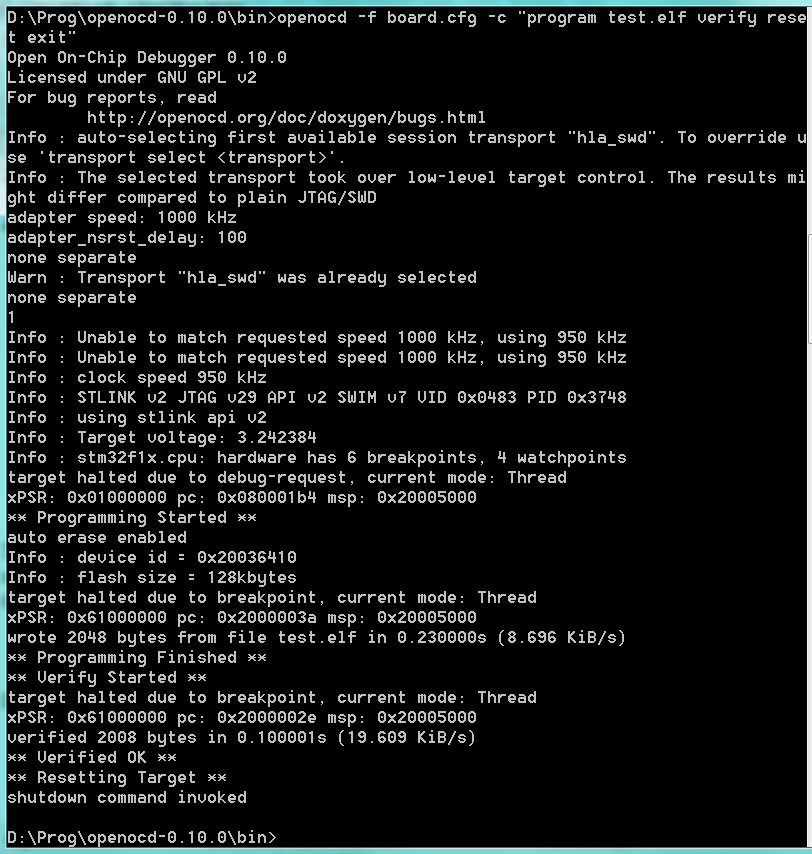
6. From the convenient place to flash the board: The
openocd -f board.cfg -c "program test.elf verify reset exit"firmware should start. Approximate output of OpenOCD to the console:
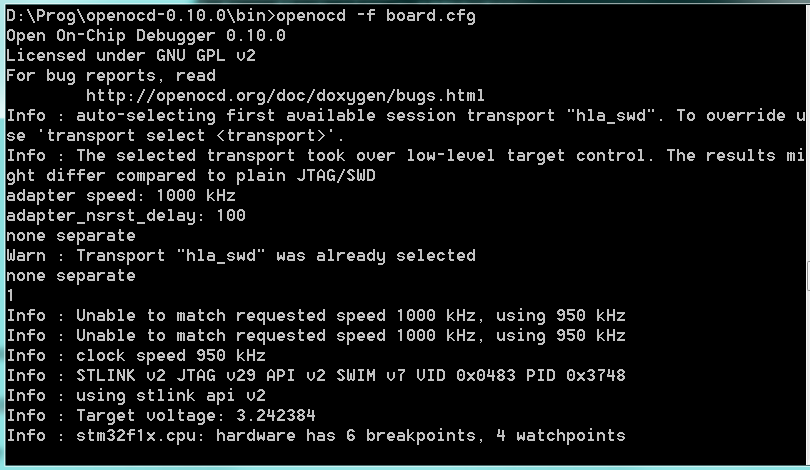
7. From a convenient place to run the OpenOCD GDB server:
openocd -f board.cfgThe code is still running; approximate output (console remains locked by OpenOCD):
8. In another console or directly launch arm-none-eabi-gdb.exe from the GNU ARM Embedded Toolchain package and execute the commands:
target extended-remote localhost:3333(the code is still running) continue(code is running, the console is locked) Ctrl+C(code is stopped, the console is active) continue(running again , the console is locked)The task is to bring the GDB client out of the running state (that is, in essence, to emulate Ctrl + C) programmatically.
To find out Process ID, use "ps -W" from * nix-environment, or Windows Process Explorer (optional).
It is possible that debugging will work correctly for someone right after the initial configuration of NetBeans - such information will also be useful, especially with a detailed description of the system and possible features.
Please share ideas in the comments, and I hope that by joint efforts we will be able to turn a bold experiment into a useful guide to setting up an even more useful tool.