iPhone in the phone market: 5% of volume, 20% of revenue, 55% of profit
Finnish analytical company Asymco has published a number of impressive charts that clearly reflect the current situation in the mobile phone market. In fact, manufacturers statistics for the I quarter. 2011 is known to everyone, but when infographics are correctly applied to these dry numbers, then everything becomes clear as God's day.
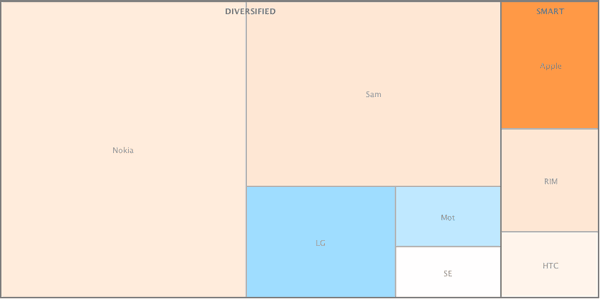
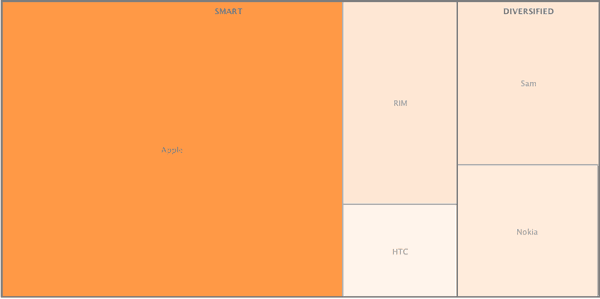
The first diagram shows the distribution of the market by the number of devices sold (the warmth of the color corresponds to the profit margin) The second diagram shows the distribution of profit. As you can see, here the picture changes dramatically. And this is a graph of the distribution of profits among the eight largest manufacturers in dynamics over three years.
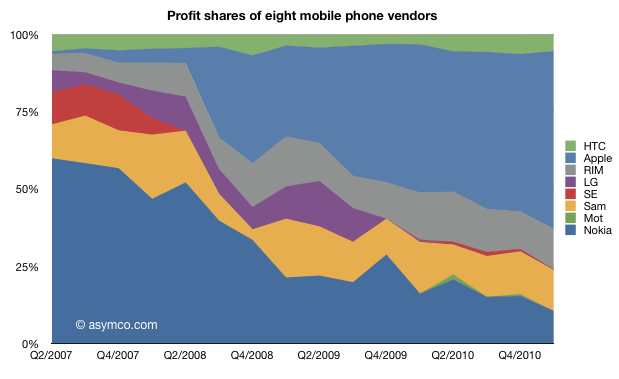
Three years ago, Nokia received more than half the profit, now Apple takes its place. But this is not a complete picture; market growth must also be taken into account. Three years ago, Nokia’s 47% stake was $ 2.35 billion, and now Apple’s 57% stake is $ 5.23 billion.
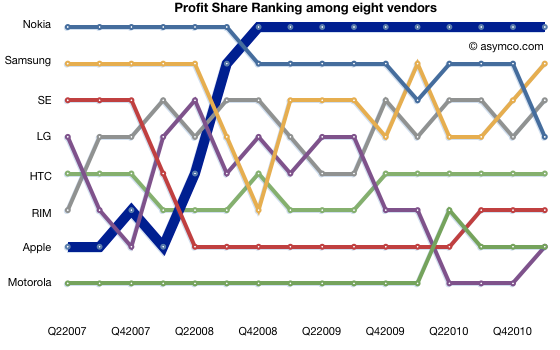
Even worse, Nokia has fallen to fourth place in terms of profit margin in the last quarter.
The first diagram shows the distribution of the market by the number of devices sold (the warmth of the color corresponds to the profit margin) The second diagram shows the distribution of profit. As you can see, here the picture changes dramatically. And this is a graph of the distribution of profits among the eight largest manufacturers in dynamics over three years.


Three years ago, Nokia received more than half the profit, now Apple takes its place. But this is not a complete picture; market growth must also be taken into account. Three years ago, Nokia’s 47% stake was $ 2.35 billion, and now Apple’s 57% stake is $ 5.23 billion.
Even worse, Nokia has fallen to fourth place in terms of profit margin in the last quarter.