How do datagrid work and why
I think it’s no secret to anyone that tasks that include displaying something in the form of a grid ( datagrid ) or tables are very common. Moreover, if there is a lot of data, then displaying the results (in HTML) becomes a very non-trivial task, which is usually solved by pagination.
Let's see what other ways exist to show the user a large pile of data, moreover it is desirable with filtering the results and searching, and even so that it does not slow down too much :).
As a rule, if you display the result in the form of an HTML table, then we run into display performance - the entire result is rendered at once. As practice shows, in Mozilla Firefox and Internet Explorer, the time spent on the initial rendering of a large table is very large, and I would like to somehow solve this problem.
Usually this problem is bypassed by pagination and rendering only a small part of the table at a time, but the user must switch pages manually, which is not very convenient. If you use pagination, then probably the speed of data sampling is much faster than its rendering, and this fact is used to create grids.
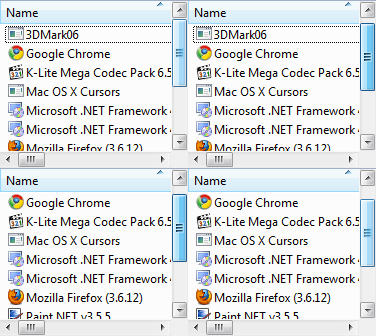
If we have the height of the rows that we want to show is fixed, then there are many ready-made solutions, for example SlickGrid , and all of them use a very simple idea that you can calculate the height of the resulting table in advance and draw the rows as needed when the user scrolls to the appropriate area.
Similar grids exist in almost all GUI libraries and frameworks, for example, Cocoa, WPF, Swing, etc. In some implementations, scrolling is allowed only line by line (most solutions for Windows); in others, you can scroll to the middle of the line (Cocoa)
Be that as it may, existing solutions do a pretty good job of this.
Let's now consider a more interesting option - let's say that the height of the lines can be variable, and we can find out the height of each line only after it is rendered. In some cases, the height can be known to us even without rendering, but in any case, the fact that the height of the cells can change is important. So that life does not seem raspberry, we also set the condition that the height is forbidden to be cached, since we can also change the width of the columns in the table, which, together with the word wrap, means variable height :).
There are 2 approaches here, one of which is used in Numbers.app from iWork, and the other in OpenOffice.org Calc and Microsoft Excel. Let's look at both and analyze the advantages and disadvantages.
With full rendering of the table, we do 3 things:
1. Render the whole table, determine its height and draw a real scroll for the user
2. All the time we recount the height of the edited row and update the state of the scroll
3. If the width of the column (s) changes, recount the height of all rows and we update the state of the scroll
Numbers.app chose this path for itself and the same path is used when rendering the usual HTML table in browsers (with some additions, since browsers also try to fit the table in the width of the container).
Why this approach is bad, I think you can easily understand by trying to open a fairly large table (say, 10,000 records with 10 columns) in a browser or in Numbers.app. Everything loads and works terribly slowly and tightly hangs the application when working with content, as well as when loading a table.
The approach is good in that scrolling by content can be done very quickly (since all content has already been rendered) and smoothly, and the scroll height that is shown to the user corresponds to the actual height of the displayed content.
As you might have guessed, there is another way:
The idea is that, if there is a lot of data in the table, the user is unlikely to notice the fact that the scroll height does not correspond slightly to the sum of the heights of all cells. What does this mean, and how can we use it? But it’s very simple:
We won’t render anything at all to find out the height of the scroll - we will calculate it, as well as in the case of a fixed row height, using this simple formula:
Where SCROLL_HEIGHT is the height of the scroll (that is, the height of the “content” that we scroll with the scroll), N is the number of lines, ROW_HEIGHT is the height of one line (for example 30px)
A logical question arises - how do we understand what we should draw at a given value of the scroll position (SCROLL_TOP), because it does not correspond to the actual height of the content? The answer follows from the formula we used to calculate the height:
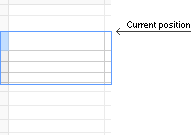 Where [...] means the integer part of the number, CURRENT_POSITION is the index of the first line currently visible, if the numbering is from zero
What should we do with this number :)? We need to draw all the visible lines, starting with CURRENT_POSITION. That is, we draw line by line all the lines, starting with CURRENT_POSITION and until we go beyond the borders of the cells.
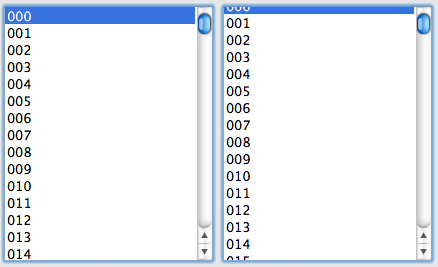
This way of scrolling corresponds to line-by-line scrolling , that is, we will not be able to scroll to the middle of the line, because we always draw from a certain line, and not from the middle. This will mean that if the height of the line exceeds the height of the area in which we draw, then we will see only part of the line without the ability to see the rest of the content! When you try to scroll in this case, we immediately get to the next line, and the previous cell is completely hidden from the scope. You can check this behavior, say, in Microsoft Excel, if you do not believe it :).
After the user has released the scroll, you can align it, according to the first formula:
In fact, determining the current line number can be done in different ways, this is just one of the methods that does not lead to unnecessary “twitching” of the scroll.
In Microsoft Excel and OpenOffice.org Calc, the exact same rendering mechanism is used not only for rows, but also for columns - in this case, rendering is not done line by line, but according to a more complex algorithm, which I did not go into details about
I used these rendering mechanisms myself in several projects, including in my file manager, whose site is now disabled for non-payment :). In any case, if someone wants to implement the above algorithm on their own, here are some practical tips:
1. The easiest way to draw a grid with a virtual scroll is to make it absolutely positioned
Let's see what other ways exist to show the user a large pile of data, moreover it is desirable with filtering the results and searching, and even so that it does not slow down too much :).
Usually brakes "view", but not "model"
As a rule, if you display the result in the form of an HTML table, then we run into display performance - the entire result is rendered at once. As practice shows, in Mozilla Firefox and Internet Explorer, the time spent on the initial rendering of a large table is very large, and I would like to somehow solve this problem.
Usually this problem is bypassed by pagination and rendering only a small part of the table at a time, but the user must switch pages manually, which is not very convenient. If you use pagination, then probably the speed of data sampling is much faster than its rendering, and this fact is used to create grids.
The most common case is a fixed row height
If we have the height of the rows that we want to show is fixed, then there are many ready-made solutions, for example SlickGrid , and all of them use a very simple idea that you can calculate the height of the resulting table in advance and draw the rows as needed when the user scrolls to the appropriate area.
Similar grids exist in almost all GUI libraries and frameworks, for example, Cocoa, WPF, Swing, etc. In some implementations, scrolling is allowed only line by line (most solutions for Windows); in others, you can scroll to the middle of the line (Cocoa)
 |  |
Be that as it may, existing solutions do a pretty good job of this.
A less typical and more complex case is variable row heights.
Let's now consider a more interesting option - let's say that the height of the lines can be variable, and we can find out the height of each line only after it is rendered. In some cases, the height can be known to us even without rendering, but in any case, the fact that the height of the cells can change is important. So that life does not seem raspberry, we also set the condition that the height is forbidden to be cached, since we can also change the width of the columns in the table, which, together with the word wrap, means variable height :).
There are 2 approaches here, one of which is used in Numbers.app from iWork, and the other in OpenOffice.org Calc and Microsoft Excel. Let's look at both and analyze the advantages and disadvantages.
The easy way. Full table rendering
With full rendering of the table, we do 3 things:
1. Render the whole table, determine its height and draw a real scroll for the user
2. All the time we recount the height of the edited row and update the state of the scroll
3. If the width of the column (s) changes, recount the height of all rows and we update the state of the scroll
Numbers.app chose this path for itself and the same path is used when rendering the usual HTML table in browsers (with some additions, since browsers also try to fit the table in the width of the container).
Why this approach is bad, I think you can easily understand by trying to open a fairly large table (say, 10,000 records with 10 columns) in a browser or in Numbers.app. Everything loads and works terribly slowly and tightly hangs the application when working with content, as well as when loading a table.
The approach is good in that scrolling by content can be done very quickly (since all content has already been rendered) and smoothly, and the scroll height that is shown to the user corresponds to the actual height of the displayed content.
As you might have guessed, there is another way:
The tricky way. Rendering the visible part with a fake scroll
The idea is that, if there is a lot of data in the table, the user is unlikely to notice the fact that the scroll height does not correspond slightly to the sum of the heights of all cells. What does this mean, and how can we use it? But it’s very simple:
We won’t render anything at all to find out the height of the scroll - we will calculate it, as well as in the case of a fixed row height, using this simple formula:
SCROLL_HEIGHT = N * ROW_HEIGHT
Where SCROLL_HEIGHT is the height of the scroll (that is, the height of the “content” that we scroll with the scroll), N is the number of lines, ROW_HEIGHT is the height of one line (for example 30px)
A logical question arises - how do we understand what we should draw at a given value of the scroll position (SCROLL_TOP), because it does not correspond to the actual height of the content? The answer follows from the formula we used to calculate the height:
CURRENT_POSITION = [SCROLL_TOP / ROW_HEIGHT]
Where [...] means the integer part of the number, CURRENT_POSITION is the index of the first line currently visible, if the numbering is from zero What should we do with this number :)? We need to draw all the visible lines, starting with CURRENT_POSITION. That is, we draw line by line all the lines, starting with CURRENT_POSITION and until we go beyond the borders of the cells.
This way of scrolling corresponds to line-by-line scrolling , that is, we will not be able to scroll to the middle of the line, because we always draw from a certain line, and not from the middle. This will mean that if the height of the line exceeds the height of the area in which we draw, then we will see only part of the line without the ability to see the rest of the content! When you try to scroll in this case, we immediately get to the next line, and the previous cell is completely hidden from the scope. You can check this behavior, say, in Microsoft Excel, if you do not believe it :).
After the user has released the scroll, you can align it, according to the first formula:
SCROLL_TOP = CURRENT_POSITION * ROW_HEIGHT
In fact, determining the current line number can be done in different ways, this is just one of the methods that does not lead to unnecessary “twitching” of the scroll.
In Microsoft Excel and OpenOffice.org Calc, the exact same rendering mechanism is used not only for rows, but also for columns - in this case, rendering is not done line by line, but according to a more complex algorithm, which I did not go into details about
Beginner's Guide
I used these rendering mechanisms myself in several projects, including in my file manager, whose site is now disabled for non-payment :). In any case, if someone wants to implement the above algorithm on their own, here are some practical tips:
1. The easiest way to draw a grid with a virtual scroll is to make it absolutely positioned
, which will be displayed on top of any container whose position can be easily determined using the offset () method in jQuery
2. Themselves
2. Themselves
You can make 2 's - one with the content, the other exclusively with the scroll, so that the browser does not try to scroll
with the content yourself, otherwise it leads to unpleasant effects when redrawing. You can also try using position: fixed, but it works weirdly in IE 7
3. It’s best not to align the scroll position at all, because browsers do not give much control over scroll
4. The maximum element height in IE 7 is about 1 million pixels, therefore, if you take 30px for the virtual line height, you get a limit of about 30,000 lines. To deal with this, you can reduce the virtual row height with an increase in the number of entries, if the browser is IE
5. In order to scroll the lines when scrolling with the mouse wheel, you can handle the DOMMouseScroll event in Gecko-based browsers and mousewheel in all others
6. If you do a smarter redrawing than redrawing a completely visible area (ie, for example, dynamically deleting and adding new lines when scrolling to a small number of lines), please tell me about the results :)
Well, if you still implement your grid, see the documentation for the grid API, say, in Cocoa - this will help you better understand how to make a well-scalable solution.
I don’t want to post my decisions, everything was written in a hurry and for specific tasks, so it’s unlikely that any of you will fit. Thank you for reading to the end :))