The struggle for performance or who took CPU time
It all started with Tumbler Dolls. About what it is and why it was needed is described here: http://habrahabr.ru/company/oktell/blog/108726/ . That is, we had four working call center servers, equally configured and with approximately the same configuration of external and internal lines, users and setting up the internal database. The telecom operator received a uniform ring load on each server, but the servers reacted differently to this!
N Server Configuration and Operating System
1 T1300 @ 1.66 1 GB RAM, Windows 2003 Standard Ed. R2 SP1 32 bit
2 Intel Core Duo E8400 @ 3000 4 GB RAM, Windows 2003 Standard Ed. SP1 32 bit
3 Intel Pentium 4 3GHz 2 GB RAM, Windows 2003 Standard Ed. SP2 32 bit
4 E3400 @ 2.60 2 GB RAM, Windows 2003 Standard Ed. R2 SP2 32 bit
Faced with complaints about the quality of communication. Moreover, they complained not about every call, but about "some." They complained about the “kwaki,” very characteristic of VoIP telephony. Quite quickly it was found out that the reason for the appearance of “Quaks” was an unpredictable increase in processor employment on one (first) of the call center servers with increasing load. And this despite the fact that other servers did not notice such a load at all, and there was no increase in CPU load with the same number of calls. Even despite the fact that the first server was significantly weaker than all the others, such a picture - growth in processor utilization to 100% - should not have been observed.
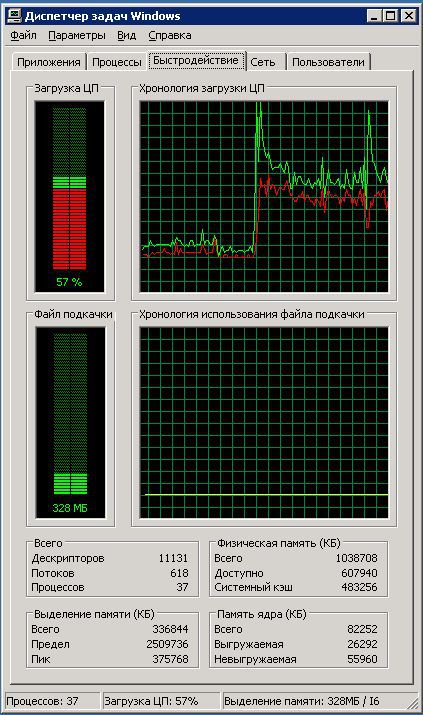
It’s probably not worth saying that we went the standard way of “wiping the headlights”, “kicking the wheels”, etc. Finally, we came to the conclusion that neither the settings of the call center itself, nor its DBMS, affect the server behavior. The starting point for understanding the essence of the problem was the fact that in the task manager in the process list, none of the processes took up processor time, however, while monitoring the performance, the processor load history showed a continuous kernel processor load of 20%.

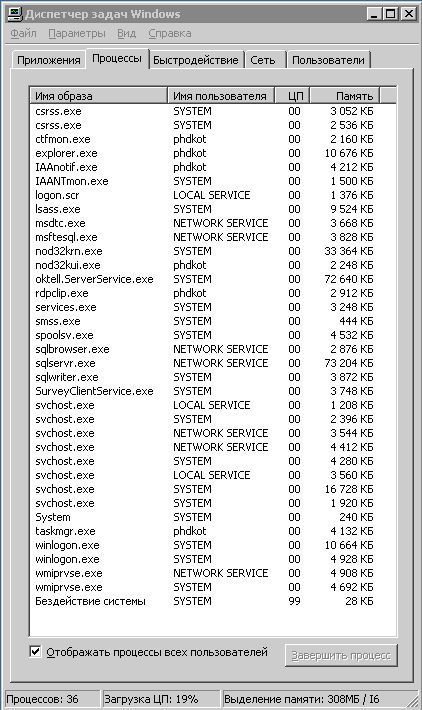
The goal was to get an answer to the question what is the core busy with when there are no loads on all other services. Process Explorer - a standard utility from Microsoft - suggested that the main consumer of resources is “Hardware Interrupts”. For further analysis of the reasons for such consumption, another standard Microsoft utility, “Kernrate View,” was downloaded. As described in the recommendations for use, the command line executed "C: \ Program Files \ KrView \ Kernrates \ Kernrate_i386_XP.exe >> log.txt" and, after some time, pressing Ctrl-C, stopped it. We received a log.txt file containing information of the form:
/ =============================== \
\ ======= ======================== /
Date: 2010/12/08 Time: 1:09:14
Machine Name: RESERVCC
Number of Processors: 1
PROCESSOR_ARCHITECTURE: x86
PROCESSOR_LEVEL: 6
PROCESSOR_REVISION: 0e08
Physical Memory: 1015 MB
Pagefile Total: 2450 MB
Virtual Total: 2047 MB
PageFile1: \ ?? \ C: \ pagefile.sys, 1524MB
OS Version: 5.2 Build 3790 Service-Pack: 1.0
WinDir : C: \ WINDOWS
Kernrate User-Specified Command Line:
Kernrate_i386_XP.exe
Kernel Profile (PID = 0): Source = Time,
Using Kernrate Default Rate of 25000 events / hit
------------ Overall Summary : --------------
P0 K 0: 00: 36.671 (28.5%) U 0: 00: 09.671 (7.5%) I 0: 01: 22.343 (64.0%) DPC 0:00 : 29.484 (22.9%) Interrupt 0: 00: 00.281 (0.2%)
Interrupts = 136809, Interrupt Rate = 1063 / sec.
Total Profile Time = 128687 msec
BytesStart BytesStop BytesDiff.
Available Physical Memory, 443772928, 407339008, -36433920
Available Pagefile (s), 2104172544, 2093707264, -10465280
Available Virtual, 2132660224, 2131611648, -1048576
Available Extended Virtual, 0, 0
Total Avg. Rate
Context Switches, 609407, 4736 / sec.
System Calls, 5078088, 39461 / sec.
Page Faults, 119817, 931 / sec.
I / O Read Operations, 11671, 91 / sec.
I / O Write Operations, 209479, 1628 / sec.
I / O Other Operations, 229216, 1781 / sec.
I / O Read Bytes, 39981700, 3426 / I / O
I / O Write Bytes, 19240135, 92 / I / O
I / O Other Bytes, 7130204725, 31107 / I / O
- Results for Kernel Mode:
- OutputResults: KernelModuleCount = 99
Percentage in the following table is based on the Total Hits for the Kernel
Time 44651 hits, 25000 events per hit - Module Hits msec% Total Events / Sec
intelppm 27457 128685 61% 5334149
hal 12284 128685 27% 2386447
ntkrnlpa 2868 128685 6% 557174
win32k 525 128685 1% 101993
alder9xp 427 128685 0% 82954
tcpip 254 128685 0% 49345
Ntfs 251 128685 0% 48762
afd 120 128685 0% 231128
128115
Rd115128 0% 21 175
iaStor 97 128 685 0% 18 844
NDIS 39 128 685 0% 7576
RDPWD 31 128 685 0% 6022
fltMgr 26 128 685 0% 5051
amon 12 128685 0% 2331
termdd 10 128685 0% 1942
CLASSPNP 10 128685 0% 1942
ftdisk 7 128685 0% 1359
ipsec 3 128685 0% 582
Npfs 2 128685 0% 388
USBPORT 2 128685 0% 388
volsnap 2 128685 0% 388
TDTCP 1 128685 0% 194
rdbss 1 128685 0% 194
ws2ifsl 1 128685 0% 194
netbt 1 128685 0% 194
watchdog 1 128685 0% 194
PartMgr 1 128685 0% 194
================ ================== END OF RUN =============================== ====
Next, we determine which driver loads the “Hardware Interrupts” process. It will be the top in the Kernrate View log list, and its percentage of core occupancy will be shown next to the percentage. It is worth noting that the percentages do not show the total percentage of the system load, but the percentage of load on the server core by the drivers.
We determined that this driver is Intelppm (Intel processor power manager). Next - google to help us. The Internet is large, powerful and unlimited. They quickly realized that a problem with Intelppm was occurring, not so often, however, we were not the only ones who faced such a disaster. The result was not slow to discover, there was an article that not only describes the problem itself, but also indicates the way to solve it (Permanent address of the original article here:http://www.osp.ru/text/print/302/5818429.html )
Further, following the recommendations of Stephen Dougherty, we understand that intelppm is a processor power management driver that is not needed on a server where battery power is not used at all . Several solutions were proposed: reinstalling, updating, or stopping a faulty driver. What options you choose - see for yourself, it is quite logical here to follow the original recommendations of Doherty.
We climbed into the registry. Intel processor driver data is located in the registry key HKEY_LOCAL_MACHINE / SYSTEM / Current Control Set / Services / intelppm. To disable the intelppm driver, the value of the Start parameter was changed from 1 to 4. Microsoft experts, of course, recommend that you make a backup copy of the registry, but we are Russian people, and change one parameter from 1 to 4.
Restart helped make sure that the download the processor is on average between 60-70% even with a full (!) load of the call center server with calls.
At the same time, the device manager looks very interesting:

Complains, sneaks, cries: “The driver for this device has been disabled. Perhaps the necessary functions are performed by another driver. (Code 32), Click the “Diagnostics” button to start the diagnostic wizard for this device. ”But this does not affect flight safety ;-)
N Server Configuration and Operating System
1 T1300 @ 1.66 1 GB RAM, Windows 2003 Standard Ed. R2 SP1 32 bit
2 Intel Core Duo E8400 @ 3000 4 GB RAM, Windows 2003 Standard Ed. SP1 32 bit
3 Intel Pentium 4 3GHz 2 GB RAM, Windows 2003 Standard Ed. SP2 32 bit
4 E3400 @ 2.60 2 GB RAM, Windows 2003 Standard Ed. R2 SP2 32 bit
Faced with complaints about the quality of communication. Moreover, they complained not about every call, but about "some." They complained about the “kwaki,” very characteristic of VoIP telephony. Quite quickly it was found out that the reason for the appearance of “Quaks” was an unpredictable increase in processor employment on one (first) of the call center servers with increasing load. And this despite the fact that other servers did not notice such a load at all, and there was no increase in CPU load with the same number of calls. Even despite the fact that the first server was significantly weaker than all the others, such a picture - growth in processor utilization to 100% - should not have been observed.
It’s probably not worth saying that we went the standard way of “wiping the headlights”, “kicking the wheels”, etc. Finally, we came to the conclusion that neither the settings of the call center itself, nor its DBMS, affect the server behavior. The starting point for understanding the essence of the problem was the fact that in the task manager in the process list, none of the processes took up processor time, however, while monitoring the performance, the processor load history showed a continuous kernel processor load of 20%.
The goal was to get an answer to the question what is the core busy with when there are no loads on all other services. Process Explorer - a standard utility from Microsoft - suggested that the main consumer of resources is “Hardware Interrupts”. For further analysis of the reasons for such consumption, another standard Microsoft utility, “Kernrate View,” was downloaded. As described in the recommendations for use, the command line executed "C: \ Program Files \ KrView \ Kernrates \ Kernrate_i386_XP.exe >> log.txt" and, after some time, pressing Ctrl-C, stopped it. We received a log.txt file containing information of the form:
/ =============================== \
\ ======= ======================== /
Date: 2010/12/08 Time: 1:09:14
Machine Name: RESERVCC
Number of Processors: 1
PROCESSOR_ARCHITECTURE: x86
PROCESSOR_LEVEL: 6
PROCESSOR_REVISION: 0e08
Physical Memory: 1015 MB
Pagefile Total: 2450 MB
Virtual Total: 2047 MB
PageFile1: \ ?? \ C: \ pagefile.sys, 1524MB
OS Version: 5.2 Build 3790 Service-Pack: 1.0
WinDir : C: \ WINDOWS
Kernrate User-Specified Command Line:
Kernrate_i386_XP.exe
Kernel Profile (PID = 0): Source = Time,
Using Kernrate Default Rate of 25000 events / hit
------------ Overall Summary : --------------
P0 K 0: 00: 36.671 (28.5%) U 0: 00: 09.671 (7.5%) I 0: 01: 22.343 (64.0%) DPC 0:00 : 29.484 (22.9%) Interrupt 0: 00: 00.281 (0.2%)
Interrupts = 136809, Interrupt Rate = 1063 / sec.
Total Profile Time = 128687 msec
BytesStart BytesStop BytesDiff.
Available Physical Memory, 443772928, 407339008, -36433920
Available Pagefile (s), 2104172544, 2093707264, -10465280
Available Virtual, 2132660224, 2131611648, -1048576
Available Extended Virtual, 0, 0
Total Avg. Rate
Context Switches, 609407, 4736 / sec.
System Calls, 5078088, 39461 / sec.
Page Faults, 119817, 931 / sec.
I / O Read Operations, 11671, 91 / sec.
I / O Write Operations, 209479, 1628 / sec.
I / O Other Operations, 229216, 1781 / sec.
I / O Read Bytes, 39981700, 3426 / I / O
I / O Write Bytes, 19240135, 92 / I / O
I / O Other Bytes, 7130204725, 31107 / I / O
- Results for Kernel Mode:
- OutputResults: KernelModuleCount = 99
Percentage in the following table is based on the Total Hits for the Kernel
Time 44651 hits, 25000 events per hit - Module Hits msec% Total Events / Sec
intelppm 27457 128685 61% 5334149
hal 12284 128685 27% 2386447
ntkrnlpa 2868 128685 6% 557174
win32k 525 128685 1% 101993
alder9xp 427 128685 0% 82954
tcpip 254 128685 0% 49345
Ntfs 251 128685 0% 48762
afd 120 128685 0% 231128
128115
Rd115128 0% 21 175
iaStor 97 128 685 0% 18 844
NDIS 39 128 685 0% 7576
RDPWD 31 128 685 0% 6022
fltMgr 26 128 685 0% 5051
amon 12 128685 0% 2331
termdd 10 128685 0% 1942
CLASSPNP 10 128685 0% 1942
ftdisk 7 128685 0% 1359
ipsec 3 128685 0% 582
Npfs 2 128685 0% 388
USBPORT 2 128685 0% 388
volsnap 2 128685 0% 388
TDTCP 1 128685 0% 194
rdbss 1 128685 0% 194
ws2ifsl 1 128685 0% 194
netbt 1 128685 0% 194
watchdog 1 128685 0% 194
PartMgr 1 128685 0% 194
================ ================== END OF RUN =============================== ====
Next, we determine which driver loads the “Hardware Interrupts” process. It will be the top in the Kernrate View log list, and its percentage of core occupancy will be shown next to the percentage. It is worth noting that the percentages do not show the total percentage of the system load, but the percentage of load on the server core by the drivers.
We determined that this driver is Intelppm (Intel processor power manager). Next - google to help us. The Internet is large, powerful and unlimited. They quickly realized that a problem with Intelppm was occurring, not so often, however, we were not the only ones who faced such a disaster. The result was not slow to discover, there was an article that not only describes the problem itself, but also indicates the way to solve it (Permanent address of the original article here:http://www.osp.ru/text/print/302/5818429.html )
Further, following the recommendations of Stephen Dougherty, we understand that intelppm is a processor power management driver that is not needed on a server where battery power is not used at all . Several solutions were proposed: reinstalling, updating, or stopping a faulty driver. What options you choose - see for yourself, it is quite logical here to follow the original recommendations of Doherty.
We climbed into the registry. Intel processor driver data is located in the registry key HKEY_LOCAL_MACHINE / SYSTEM / Current Control Set / Services / intelppm. To disable the intelppm driver, the value of the Start parameter was changed from 1 to 4. Microsoft experts, of course, recommend that you make a backup copy of the registry, but we are Russian people, and change one parameter from 1 to 4.
Restart helped make sure that the download the processor is on average between 60-70% even with a full (!) load of the call center server with calls.
At the same time, the device manager looks very interesting:
Complains, sneaks, cries: “The driver for this device has been disabled. Perhaps the necessary functions are performed by another driver. (Code 32), Click the “Diagnostics” button to start the diagnostic wizard for this device. ”But this does not affect flight safety ;-)