June 23, 2010 at 16:29
Blue ocean strategy
Recently I read the book “The Strategy of the Blue Ocean” by W. Chan Kim and Rene Moborn. In some instances it resembles TRIZ (Theory of Solving Inventive Problems), which of course was very pleased. After reading, a number of theses were formed.
0. We must move away from competition. Competition is the main indicator of the scarlet ocean (the ocean is stained with blood from fierce competition), the higher it is, the lower the potential profit and the greater the cost. The blue ocean is just leading away from competition, it is possible to create your own rules in it and not spend energy on the struggle, concentrating on business.
1. The balance.To minimize risks, the company’s portfolio should include both representatives of the blue and red oceans, as the red ocean, in spite of all its disadvantages, can nevertheless give a small, but constant profit, which just should go to search and create blue oceans.
2. At the junction of the spheres. It is worthwhile to carefully examine the space between the spheres, as a rule, there you can make the blue ocean. A good example from the book is Cirque de Soleil, who took the best from the circus and theater and created a new space for themselves without competition. Incidentally, they are one of the richest companies in Canada, and indeed the whole world.
3. Do not be afraid, but think.One should not be afraid to mix like immiscible. It often happens that an approach that is poorly or ineffectively applied in one area can revolutionize another. For example, no one could even think of assembling a Ford Model T on a conveyor with unskilled workers, because the car was a luxury of manual work at that time, and as a result, due to the conveyor, assembly time was reduced from a month to 4 days + Ford eliminated all that was superfluous, leaving essence (one model, one color) at the price of a carriage and made everyone.
4. Invention for the sake of invention. It is also important to understand that the invention can be applied, to make a business out of it, so that it does not remain an eternal prototype.
5. Search for a strategy.To search for the blue ocean, it is necessary to analyze the current players in the industry (or several industries at once, on the same chart), finding their main points of application of resources. For example, in the wine industry, they can be: price, use of special terminology, indirect marketing, exposure quality, history, richness of taste, assortment (X axis). Next, you need to understand who puts so much effort into these points, so you can get curves of competitor strategies (Y axis). This graph will help you understand where you don’t need to move, and through visualization it’s easier to understand how to work with these points further.
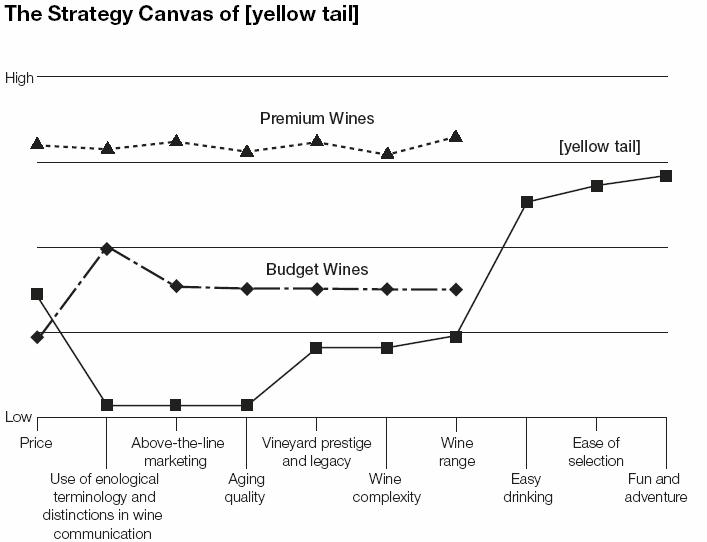
6. Strategic canvas.For the blue ocean, you need to make such a curve, and with such a set of resource application points so that it minimally or not overlap with competitors (the above is just an example of Casella Wines strategic canvas with the [yellow tail] brand ). Or, if we are talking about a junction of spheres, we must take the best from each sphere and eliminate the superfluous.
7. Focusing. Each strategy should have a focus on something specific, which is put in the center and to which maximum efforts are applied, which already pull the rest. For example, in model T, it was accessible to the widest possible masses. The focus essentially reflects the motto of the company or one of the businesses, and the motto should be as clear as possible and without ambiguity.
8. This is very interesting.A particularly steep blue ocean can happen when there are very few resources and you need to think about their dual use, about combining. For starters, you can try a simple search, this alone can give good ideas, since nobody tried it before, did not try to look at this resource from this side. Business in the direction of the blue ocean is like a good old-school quest.
9. Implementation and visualization.Successful implementation of the strategy is possible only when it is clear to the whole team, when everyone is as transparent as possible and everyone knows where the company is moving, what its goals are. It is also important that the team understands what steps need to be taken to implement it and what it will receive when the strategy is successfully implemented. In this case, visualization of the strategy is also very important, so that at any time you can compare / clarify whether resources are being spent correctly. To do this, you can make a modified strategic plan ( I already wrote in one of the posts about this ) by adding a curve to the strategic canvas.
Well, and probably the most important thing: doing the blue oceans is wildly interesting and cool.
0. We must move away from competition. Competition is the main indicator of the scarlet ocean (the ocean is stained with blood from fierce competition), the higher it is, the lower the potential profit and the greater the cost. The blue ocean is just leading away from competition, it is possible to create your own rules in it and not spend energy on the struggle, concentrating on business.
1. The balance.To minimize risks, the company’s portfolio should include both representatives of the blue and red oceans, as the red ocean, in spite of all its disadvantages, can nevertheless give a small, but constant profit, which just should go to search and create blue oceans.
2. At the junction of the spheres. It is worthwhile to carefully examine the space between the spheres, as a rule, there you can make the blue ocean. A good example from the book is Cirque de Soleil, who took the best from the circus and theater and created a new space for themselves without competition. Incidentally, they are one of the richest companies in Canada, and indeed the whole world.
3. Do not be afraid, but think.One should not be afraid to mix like immiscible. It often happens that an approach that is poorly or ineffectively applied in one area can revolutionize another. For example, no one could even think of assembling a Ford Model T on a conveyor with unskilled workers, because the car was a luxury of manual work at that time, and as a result, due to the conveyor, assembly time was reduced from a month to 4 days + Ford eliminated all that was superfluous, leaving essence (one model, one color) at the price of a carriage and made everyone.
4. Invention for the sake of invention. It is also important to understand that the invention can be applied, to make a business out of it, so that it does not remain an eternal prototype.
5. Search for a strategy.To search for the blue ocean, it is necessary to analyze the current players in the industry (or several industries at once, on the same chart), finding their main points of application of resources. For example, in the wine industry, they can be: price, use of special terminology, indirect marketing, exposure quality, history, richness of taste, assortment (X axis). Next, you need to understand who puts so much effort into these points, so you can get curves of competitor strategies (Y axis). This graph will help you understand where you don’t need to move, and through visualization it’s easier to understand how to work with these points further.
6. Strategic canvas.For the blue ocean, you need to make such a curve, and with such a set of resource application points so that it minimally or not overlap with competitors (the above is just an example of Casella Wines strategic canvas with the [yellow tail] brand ). Or, if we are talking about a junction of spheres, we must take the best from each sphere and eliminate the superfluous.
7. Focusing. Each strategy should have a focus on something specific, which is put in the center and to which maximum efforts are applied, which already pull the rest. For example, in model T, it was accessible to the widest possible masses. The focus essentially reflects the motto of the company or one of the businesses, and the motto should be as clear as possible and without ambiguity.
8. This is very interesting.A particularly steep blue ocean can happen when there are very few resources and you need to think about their dual use, about combining. For starters, you can try a simple search, this alone can give good ideas, since nobody tried it before, did not try to look at this resource from this side. Business in the direction of the blue ocean is like a good old-school quest.
9. Implementation and visualization.Successful implementation of the strategy is possible only when it is clear to the whole team, when everyone is as transparent as possible and everyone knows where the company is moving, what its goals are. It is also important that the team understands what steps need to be taken to implement it and what it will receive when the strategy is successfully implemented. In this case, visualization of the strategy is also very important, so that at any time you can compare / clarify whether resources are being spent correctly. To do this, you can make a modified strategic plan ( I already wrote in one of the posts about this ) by adding a curve to the strategic canvas.
Well, and probably the most important thing: doing the blue oceans is wildly interesting and cool.