Water meter reading: ESP8266 + Android
 Many now have water meters. And the majority are faced with the problem of taking readings from these meters and their timely delivery. I did not become an exception. I had to take readings conveniently, but now I constantly forgot them and recalled them at the most inopportune moment. It was decided to automate the process of taking testimony, so that you can view them at any time. Who cares how to get a picture on the left of my phone please ask for cat.
Introduction
The idea for the implementation came to me after reading this article. During the repair, I immediately put the pulse counters. The first version of the device was made on the basis of ESP-03. The code is written in LUA. Data was also transmitted to thingspeak.com .
First version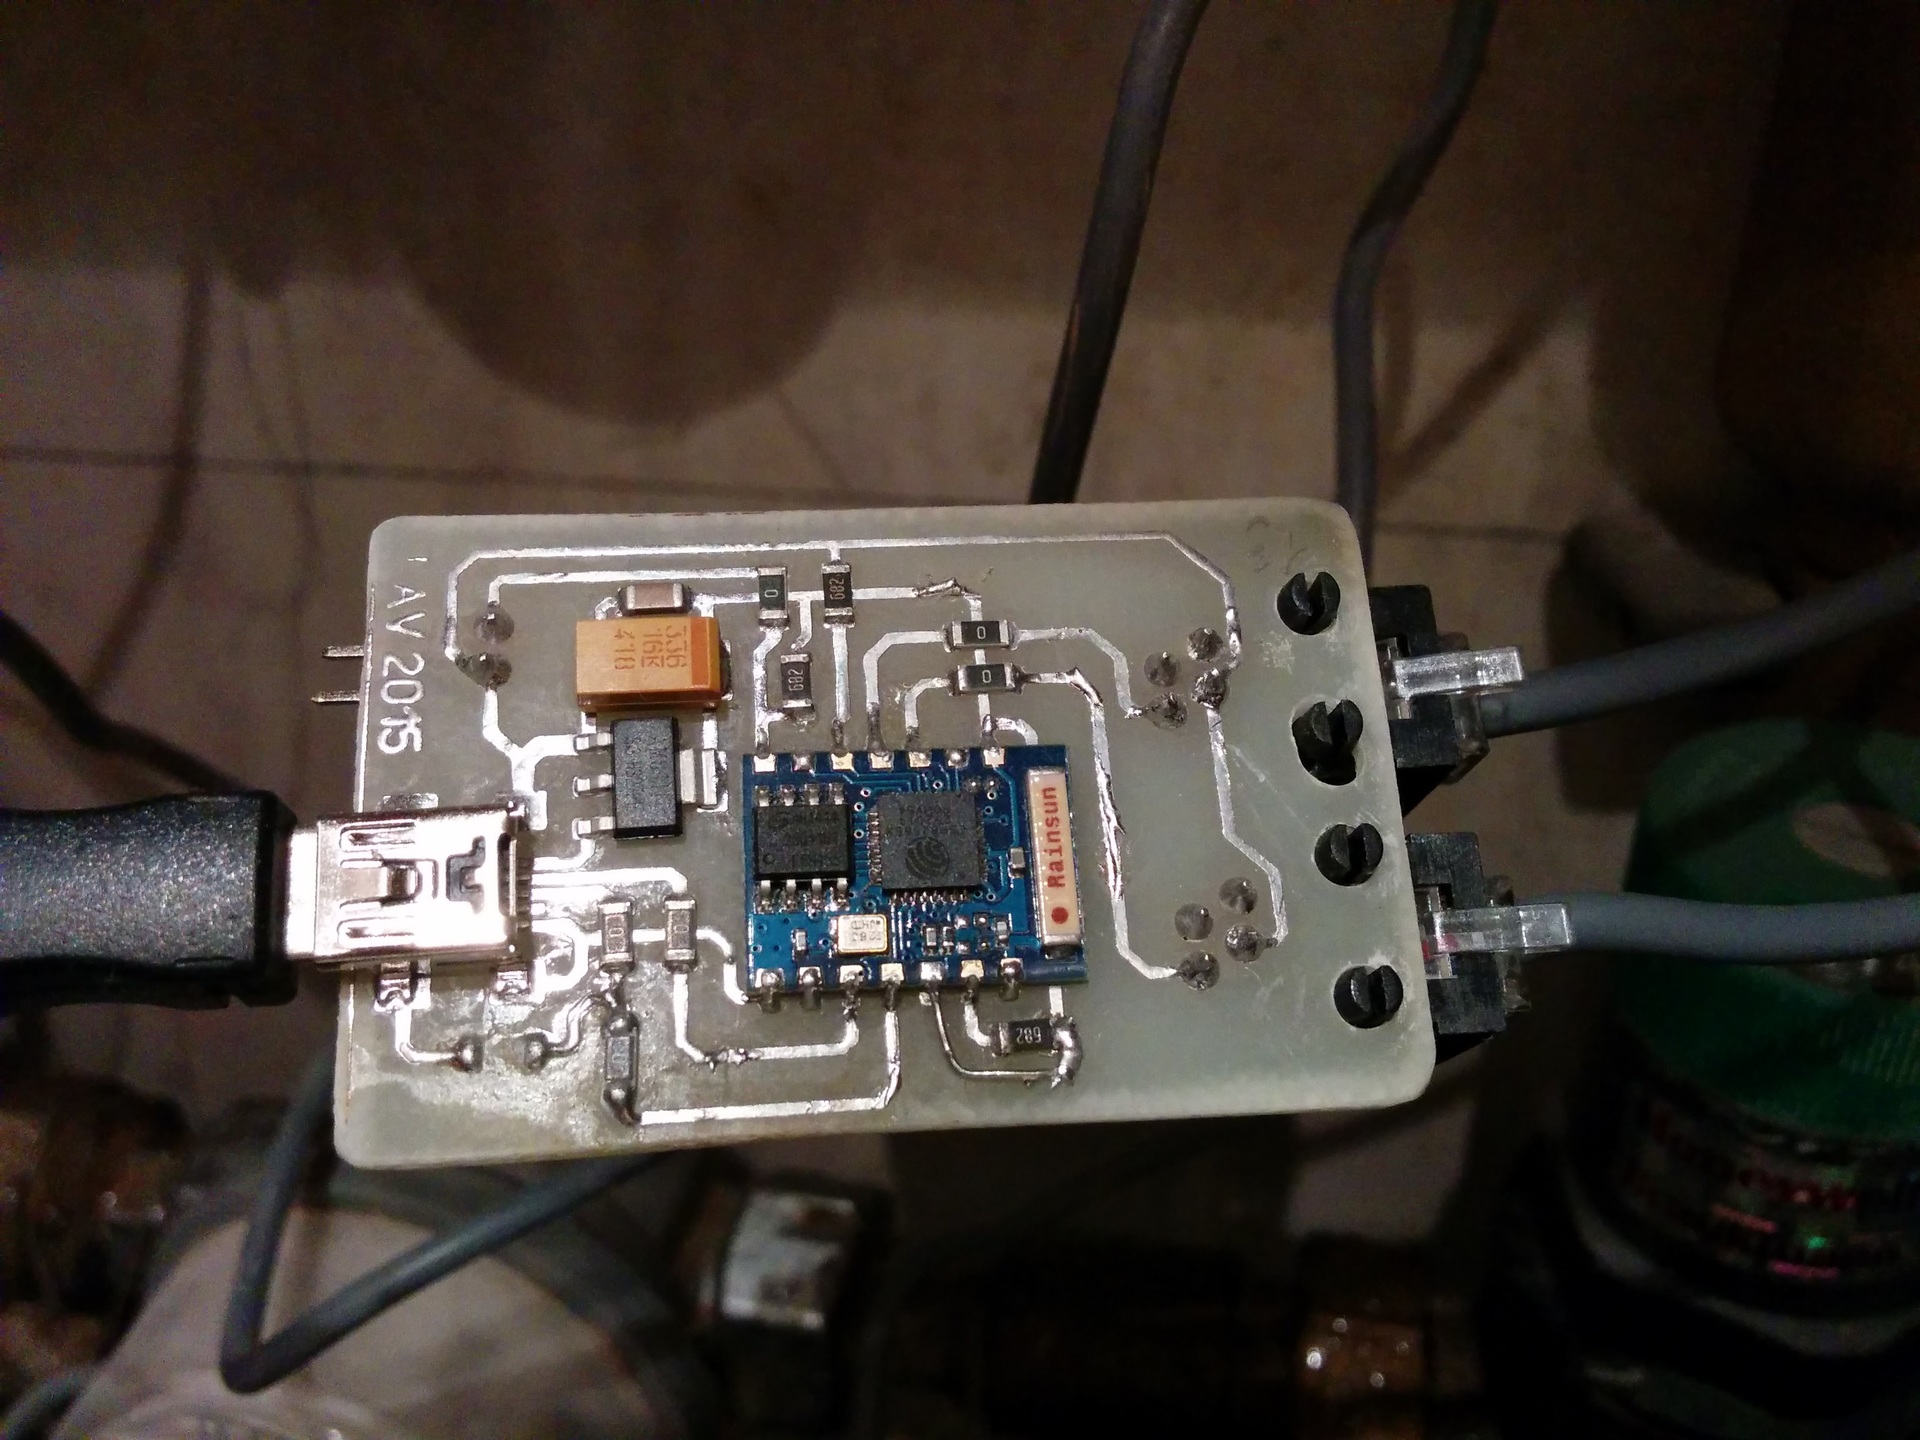
After 2 months of use, the following deficiencies were identified:
- There was no light indication of work, since the module was frozen a couple of times, it was important
- The complexity of the settings, because the settings were in the code
- A power cable with a miniUSB connector was needed for power. I had this only from Sony Playstation
- It is not convenient to view the results on thingspeak.com
- Relative complexity of implementation.
Therefore, it was decided to make a second version that will meet the following requirements:
- MicroUSB power connector
- Make settings connecting to the device via WiFi
- Work indication
- Ease of viewing information
- Ease of repetition
- Aesthetic appearance
- Small cost price
Pay
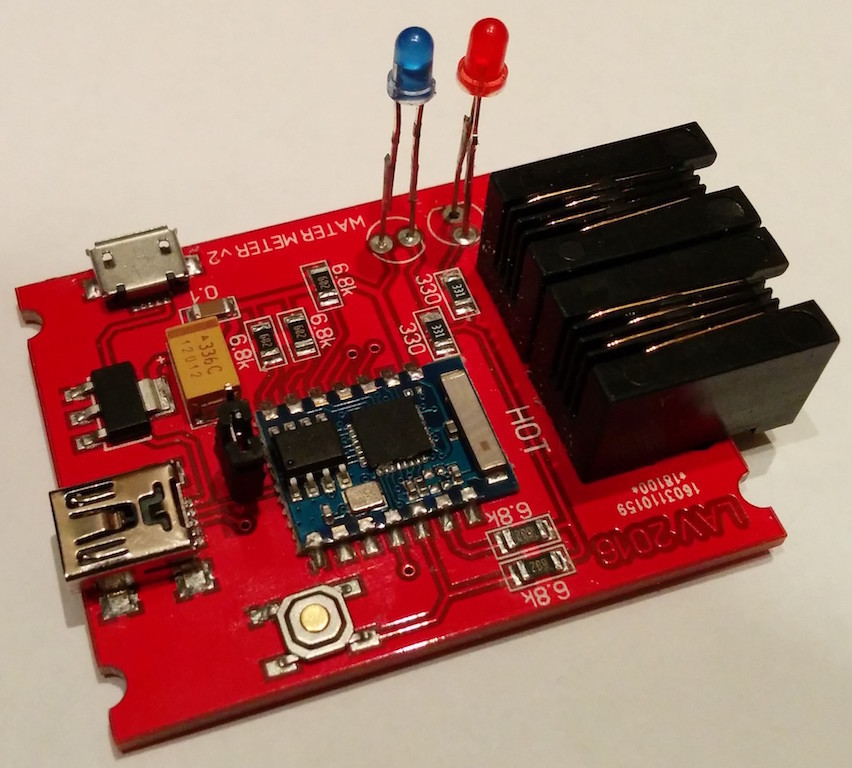
The circuit board is quite simple. It is based on the exact same ESP-03. The site esp8266.ru helped me with the main connection features .
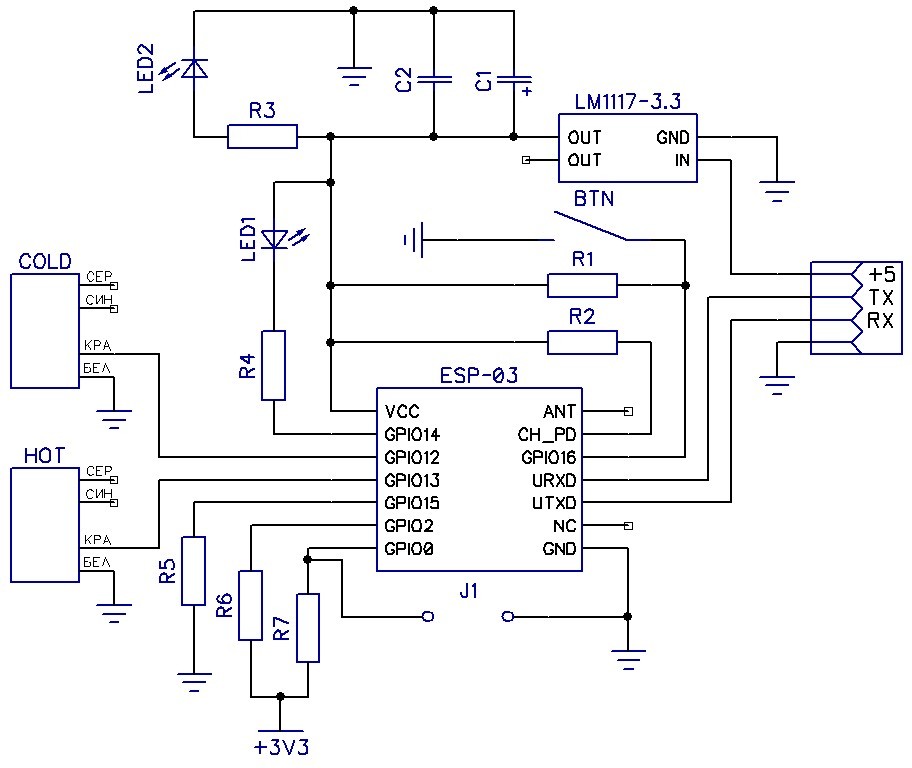
COLD, HOT - RJ9
LED1 sockets - serves to indicate the operation of the board (setup mode - permanently on, error - frequent blinking, normal operation - blinking once per second)
LED2 - indication of power supply
R3, R4 - 330Ω
R1, R2, R5, R6 , R7 - 6.8кОМ
С1 - tantalum capacitor at 33µF
C2 - ceramic capacitor at 0.1µF
LM1117 - for converting 5V to 3.3V
J1 - jumper for flashing ESP-03
BTN - for selecting the operating mode of the board
Added a miniUSB connector for flashing the module and writing scripts. A separate microUSB connector was added separately for power supply without connecting the RX and TX pins to it (it is not shown in the diagram). This is due to the fact that if you power the module through the miniUSB connector, where the RX and TX are connected, the module for some reason hung. I tried to pull up the RX and TX, but nothing helped. Therefore, I decided to leave it so, besides, I had a lot of microUSB cables.
The dimensions of the components make it easy to make a board using the LUT method, which was done for debugging scripts. Later, I ordered the manufacture of boards from the Chinese . The size of the board was adjusted to the existing case.
Photo before installation:
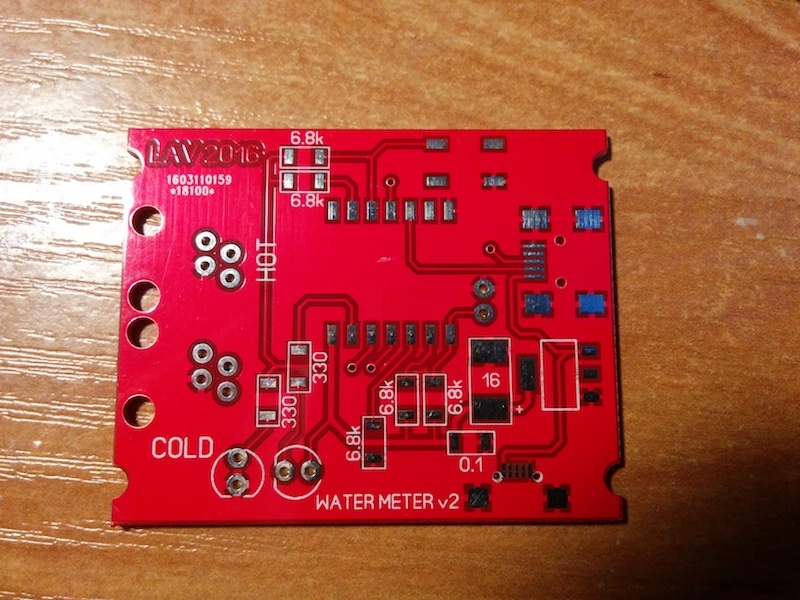
Photo after:
Firmware
Firmware assembled using online-designer . It allows you to generate NodeMCU firmware only with the necessary modules, which allows you to increase the amount of free memory. I did not experience the problem with the lack of memory, and as a result, about 30% of the free space was spent on my scripts and auxiliary files. Firmware flooded using nodemcu-flasher . For writing and uploading scripts I used ESPlorer .
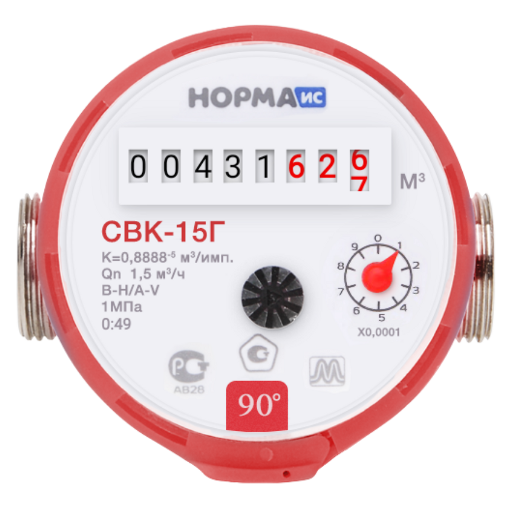
The operation of the pulse counter is similar to pressing a button. With the passage of certain values of the contacts are closed and open. My meter closed the contacts at number 7, and opened at number 2. I hung the counters on the ports GPIO12, GPIO13 and the ground with a power lift (using an internal resistor). Thus, when the port changes its value to 0, then we can assume that 10 liters of water were spent.
The device can operate in 2 modes: setup mode and reading mode. To enter configuration mode when powering up, you need to hold down the BTN button. It takes 2 seconds. In this mode, ESP starts working as an access point and is a simple web server. An available ESP network appears - ???????, where instead of characters? will be id esp. To configure, you need to connect to this network and go to 1.1.1.1 in the browser. The following page is displayed:
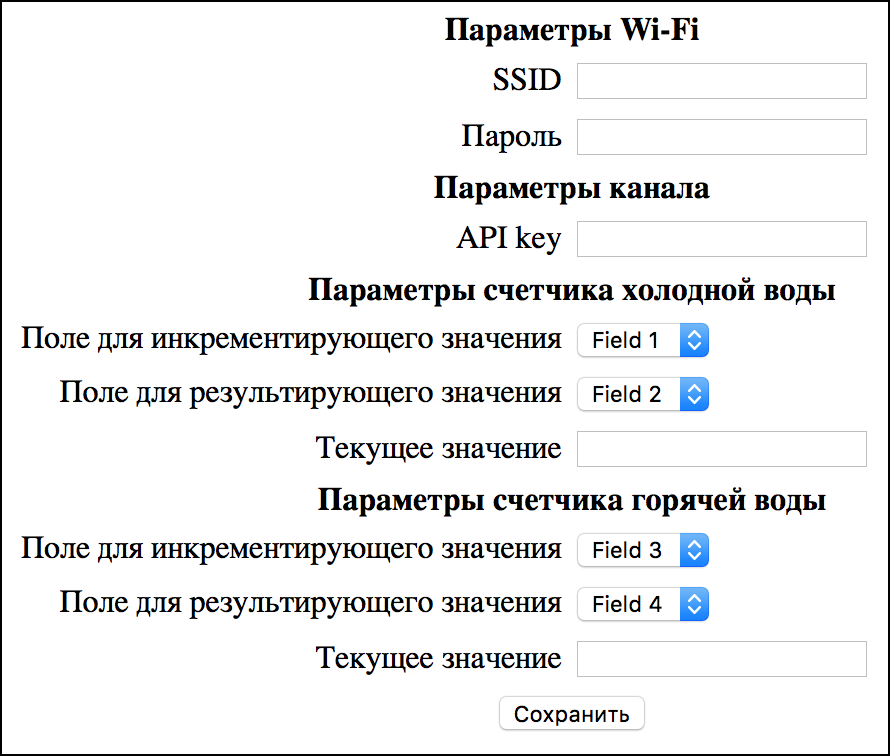
If during power-up the button was not clamped, then the reading mode starts. In this mode, the states of the ports GPIO12 and GPIO13 are checked every second. If 0 appears somewhere, the corresponding value increases. Initially, I did an interrupt-based check, but this method was not reliable (ESP hung up periodically). Every minute there is an attempt to send data to the server (if there were changes). For each counter, 2 values are transmitted: the current reading of the counter and the amount of change since the last data transfer.
Android app
As I said, on thingspeak.com I was uncomfortable to view the readings. I decided to write an Android application. The result was an application that allows you to:
- Build consumption graphs by hour, day, month
- Have access to offline data
- Add a widget with indicators
Thingspeak.com has an API that allows you to collect data. Using this API, the application each time it starts or before updating the widget requests the latest data and saves it to the local database. Further work is already underway with her. The application added 2 types of widgets: in the form of a counter and in the form of a consumption graph. It turned out quite convenient.
Application screenshots


I thought to implement automatic meter reading, but I did not find a ready API. It was possible to analyze the official application, but it is not reliable. For Moscow there is an EMP . I registered there and got access to their API, but it only allows you to see which readings were given, but this was not interesting for me.
Conclusion
The cost of the device, excluding the case, was approximately 450 rubles. Some of the components were bought in the well-known store. If everything is taken from the Chinese, the cost can be reduced to approximately 370 rubles. This version for 4 months has never hung and never failed. The resulting device is easy to repeat and modify. With his help, I learned that the toilet bowl was slowly but surely flowing.
Useful links: