Horizontal auto-scaling of Kubernetes and Prometheus hearths for high availability and availability of infrastructure
- Transfer
Salute, Khabrovites! The translation of the following article was prepared specifically for students of the Kubernetes-based Infrastructure Platform course , which will start classes tomorrow. Let's get started.

Auto-scaling allows you to automatically increase and decrease workloads depending on the use of resources.
Kubernetes autoscaling has two dimensions:
Cluster auto-scaling can be used in conjunction with horizontal hearth auto-scaling to dynamically control computing resources and the degree of system concurrency required to comply with service level agreements (SLAs).
Cluster autoscaling is highly dependent on the capabilities of the cloud infrastructure provider hosting the cluster, and HPA can operate independently of the IaaS / PaaS provider.
Horizontal hearth auto-scaling has undergone major changes since the introduction of Kubernetes v1.1. The first version of HPA scaled hearths based on measured CPU consumption, and later based on memory usage. Kubernetes 1.6 introduced a new API called Custom Metrics, which provided HPA access to custom metrics. Kubernetes 1.7 added an aggregation level that allows third-party applications to extend the Kubernetes API by registering as API add-ons.
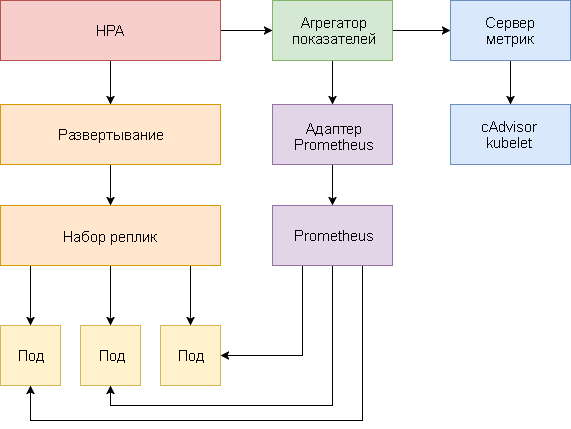
Thanks to the Custom Metrics API and aggregation level, monitoring systems such as Prometheus can provide application specific metrics to the HPA controller.
Horizontal hearth auto-scaling is implemented as a control loop that periodically queries the Resource Metrics API (resource metrics API) for key metrics, such as CPU and memory usage, and the Custom Metrics API (custom metrics API) for specific application metrics.
Below is a step-by-step guide for configuring HPA v2 for Kubernetes 1.9 and later.
Before you begin, you must install Go version 1.8 (or later) and clone the k8s-prom-hpa repository into
The Kubernetes Metric Server is the intra-cluster resource utilization data aggregator that replaces Heapster . The metrics server collects CPU and memory usage information for nodes and hearths from
In the first version of HPA, a Heapster aggregator was needed to get the CPU and memory. In HPA v2 and Kubernetes 1.8, only the metric server with it enabled is required
Deploy the metric server in the namespace
After 1 minute, it
View node metrics:
View heart rate indicators:
For testing hearth horizontal auto-scaling (HPA), you can use a small Golang-based web application.
Expand podinfo in the namespace
Refer to
Create HPA:
After a couple of seconds, the HPA controller will contact the metric server and receive information about CPU and memory usage:
To increase CPU usage, do a load test with rakyll / hey:
You can monitor HPA events as follows:
Remove podinfo temporarily (you will have to redeploy it in one of the next steps of this guide).
For scaling based on custom metrics, two components are needed. The first - the Prometheus time series database - collects application metrics and saves them. The second component, the k8s-prometheus-adapter , complements the Custom Metrics API Kubernetes with metrics provided by the builder.
A dedicated namespace is used to deploy Prometheus and the adapter.
Create a namespace
Expand Prometheus v2 in the namespace
Generate the TLS certificates required for the Prometheus adapter:
Deploy the Prometheus adapter for the Custom Metrics API:
Get a list of special metrics provided by Prometheus:
Then extract the file system usage data for all the pods in the namespace
Create a NodePort service
The application
Get the total number of queries per second from the Custom Metrics API:
The letter
Create an HPA that will expand the podinfo deployment if the number of requests exceeds 10 requests per second:
Deploy HPA
After a few seconds, the HPA will receive a value
Apply the load for the podinfo service with 25 requests per second:
After a few minutes, the HPA will begin to scale the deployment:
With the current number of requests per second, deployment will never reach a maximum of 10 pods. Three replicas are enough to ensure that the number of requests per second for each pod is less than 10.
After the load tests are completed, HPA will reduce the deployment scale to the original number of replicas:
You may have noticed that the auto-scaler does not immediately respond to changes in metrics. By default, they are synchronized every 30 seconds. In addition, scaling occurs only if there has not been an increase or decrease in workloads during the last 3-5 minutes. This helps prevent conflicting decisions and leaves time to connect the cluster auto-scaler.
Not all systems can enforce SLA compliance based solely on CPU or memory utilization (or both). Most web servers and mobile servers to handle traffic spikes need autoscaling based on the number of requests per second.
For ETL applications (from the Eng. Extract Transform Load - “extraction, transformation, loading”), auto-scaling can be triggered, for example, when the specified threshold length of the job queue is exceeded.
In all cases, instrumenting applications using Prometheus and highlighting the necessary indicators for autoscaling allow you to fine-tune applications to improve the processing of traffic spikes and ensure high availability of the infrastructure.
Ideas, questions, comments? Join the discussion at Slack !
Here is such a material. We are waiting for your comments and see you on the course !
Autoscaling in Kubernetes
Auto-scaling allows you to automatically increase and decrease workloads depending on the use of resources.
Kubernetes autoscaling has two dimensions:
- Cluster Autoscaler, which is responsible for scaling nodes;
- Horizontal Pod Autoscaler (HPA), which automatically scales the number of hearths in a deployment or replica set.
Cluster auto-scaling can be used in conjunction with horizontal hearth auto-scaling to dynamically control computing resources and the degree of system concurrency required to comply with service level agreements (SLAs).
Cluster autoscaling is highly dependent on the capabilities of the cloud infrastructure provider hosting the cluster, and HPA can operate independently of the IaaS / PaaS provider.
HPA Development
Horizontal hearth auto-scaling has undergone major changes since the introduction of Kubernetes v1.1. The first version of HPA scaled hearths based on measured CPU consumption, and later based on memory usage. Kubernetes 1.6 introduced a new API called Custom Metrics, which provided HPA access to custom metrics. Kubernetes 1.7 added an aggregation level that allows third-party applications to extend the Kubernetes API by registering as API add-ons.
Thanks to the Custom Metrics API and aggregation level, monitoring systems such as Prometheus can provide application specific metrics to the HPA controller.
Horizontal hearth auto-scaling is implemented as a control loop that periodically queries the Resource Metrics API (resource metrics API) for key metrics, such as CPU and memory usage, and the Custom Metrics API (custom metrics API) for specific application metrics.
Below is a step-by-step guide for configuring HPA v2 for Kubernetes 1.9 and later.
- Install the Metrics Server Add-in, which provides key metrics.
- Launch a demo application to see how hearth auto-scaling works based on CPU and memory usage.
- Deploy the Prometheus and custom API server. Register a custom API server at the aggregation level.
- Configure HPA using custom metrics provided by the demo application.
Before you begin, you must install Go version 1.8 (or later) and clone the k8s-prom-hpa repository into
GOPATH:cd $GOPATH
git clone https://github.com/stefanprodan/k8s-prom-hpa1. Setting up the metrics server
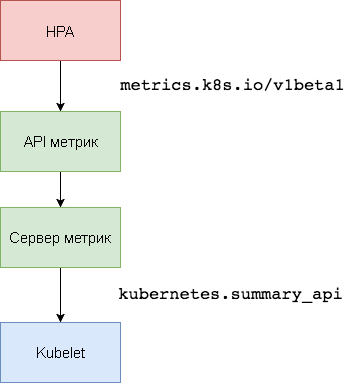
The Kubernetes Metric Server is the intra-cluster resource utilization data aggregator that replaces Heapster . The metrics server collects CPU and memory usage information for nodes and hearths from
kubernetes.summary_api. The Summary API is a memory-efficient API for transmitting Kubelet / cAdvisor data metrics to a server. In the first version of HPA, a Heapster aggregator was needed to get the CPU and memory. In HPA v2 and Kubernetes 1.8, only the metric server with it enabled is required
horizontal-pod-autoscaler-use-rest-clients. This option is enabled by default in Kubernetes 1.9. GKE 1.9 comes with a pre-installed metrics server. Deploy the metric server in the namespace
kube-system:kubectl create -f ./metrics-serverAfter 1 minute, it
metric-server will start transmitting data on the use of the CPU and memory by nodes and pods. View node metrics:
kubectl get --raw "/apis/metrics.k8s.io/v1beta1/nodes" | jq .View heart rate indicators:
kubectl get --raw "/apis/metrics.k8s.io/v1beta1/pods" | jq .2. Auto-scaling based on CPU and memory usage
For testing hearth horizontal auto-scaling (HPA), you can use a small Golang-based web application.
Expand podinfo in the namespace
default:kubectl create -f ./podinfo/podinfo-svc.yaml,./podinfo/podinfo-dep.yamlRefer to
podinfo using the NodePort service at .
Specify an HPA that will serve at least two replicas and scale to ten replicas if the average CPU utilization exceeds 80% or if memory consumption is above 200 MiB:http://:31198 apiVersion: autoscaling/v2beta1
kind: HorizontalPodAutoscaler
metadata:
name: podinfo
spec:
scaleTargetRef:
apiVersion: extensions/v1beta1
kind: Deployment
name: podinfo
minReplicas: 2
maxReplicas: 10
metrics:
- type: Resource
resource:
name: cpu
targetAverageUtilization: 80
- type: Resource
resource:
name: memory
targetAverageValue: 200MiCreate HPA:
kubectl create -f ./podinfo/podinfo-hpa.yamlAfter a couple of seconds, the HPA controller will contact the metric server and receive information about CPU and memory usage:
kubectl get hpa
NAME      REFERENCE            TARGETS                      MINPODS   MAXPODS   REPLICAS   AGE
podinfo   Deployment/podinfo   2826240 / 200Mi, 15% / 80%   2         10        2          5m
To increase CPU usage, do a load test with rakyll / hey:
#install hey
go get -u github.com/rakyll/hey
#do 10K requests
hey -n 10000 -q 10 -c 5 http://:31198/
You can monitor HPA events as follows:
$ kubectl describe hpa
Events:
  Type    Reason             Age   From                       Message
  ----    ------             ----  ----                       -------
  Normal  SuccessfulRescale  7m    horizontal-pod-autoscaler  New size: 4; reason: cpu resource utilization (percentage of request) above target
  Normal  SuccessfulRescale  3m    horizontal-pod-autoscaler  New size: 8; reason: cpu resource utilization (percentage of request) above target
Remove podinfo temporarily (you will have to redeploy it in one of the next steps of this guide).
kubectl delete -f ./podinfo/podinfo-hpa.yaml,./podinfo/podinfo-dep.yaml,./podinfo/podinfo-svc.yaml3. Custom Metrics Server Setup
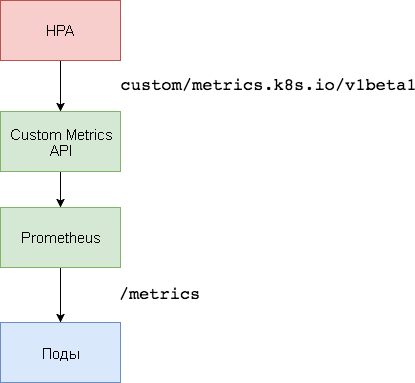
For scaling based on custom metrics, two components are needed. The first - the Prometheus time series database - collects application metrics and saves them. The second component, the k8s-prometheus-adapter , complements the Custom Metrics API Kubernetes with metrics provided by the builder.
A dedicated namespace is used to deploy Prometheus and the adapter.
Create a namespace
monitoring:kubectl create -f ./namespaces.yamlExpand Prometheus v2 in the namespace
monitoring:kubectl create -f ./prometheusGenerate the TLS certificates required for the Prometheus adapter:
make certsDeploy the Prometheus adapter for the Custom Metrics API:
kubectl create -f ./custom-metrics-apiGet a list of special metrics provided by Prometheus:
kubectl get --raw "/apis/custom.metrics.k8s.io/v1beta1" | jq .Then extract the file system usage data for all the pods in the namespace
monitoring:kubectl get --raw "/apis/custom.metrics.k8s.io/v1beta1/namespaces/monitoring/pods/*/fs_usage_bytes" | jq .4. Auto-scaling based on custom metrics
Create a NodePort service
podinfo and deploy in the namespace default:kubectl create -f ./podinfo/podinfo-svc.yaml,./podinfo/podinfo-dep.yamlThe application
podinfo will pass a custom metric http_requests_total. The Prometheus adapter will remove the suffix _total and mark this metric as a counter. Get the total number of queries per second from the Custom Metrics API:
kubectl get --raw "/apis/custom.metrics.k8s.io/v1beta1/namespaces/default/pods/*/http_requests" | jq .
{
  "kind": "MetricValueList",
  "apiVersion": "custom.metrics.k8s.io/v1beta1",
  "metadata": {
    "selfLink": "/apis/custom.metrics.k8s.io/v1beta1/namespaces/default/pods/%2A/http_requests"
  },
  "items": [
    {
      "describedObject": {
        "kind": "Pod",
        "namespace": "default",
        "name": "podinfo-6b86c8ccc9-kv5g9",
        "apiVersion": "/__internal"
      },
      "metricName": "http_requests",
      "timestamp": "2018-01-10T16:49:07Z",
      "value": "901m"    },
    {
      "describedObject": {
        "kind": "Pod",
        "namespace": "default",
        "name": "podinfo-6b86c8ccc9-nm7bl",
        "apiVersion": "/__internal"
      },
      "metricName": "http_requests",
      "timestamp": "2018-01-10T16:49:07Z",
      "value": "898m"
    }
  ]
}
The letter
m means milli-units, therefore, for example, 901m it is 901 millisequest. Create an HPA that will expand the podinfo deployment if the number of requests exceeds 10 requests per second:
apiVersion: autoscaling/v2beta1
kind: HorizontalPodAutoscaler
metadata:
  name: podinfo
spec:
  scaleTargetRef:
    apiVersion: extensions/v1beta1
    kind: Deployment
    name: podinfo
  minReplicas: 2
  maxReplicas: 10
  metrics:
  - type: Pods
    pods:
      metricName: http_requests
      targetAverageValue: 10
Deploy HPA
podinfo in the namespace default:kubectl create -f ./podinfo/podinfo-hpa-custom.yamlAfter a few seconds, the HPA will receive a value
http_requests from the metrics API:kubectl get hpa
NAME REFERENCE TARGETS MINPODS MAXPODS REPLICAS AGE
podinfo Deployment/podinfo 899m / 10 2 10 2 1mApply the load for the podinfo service with 25 requests per second:
#install hey
go get -u github.com/rakyll/hey
#do 10K requests rate limited at 25 QPS
hey -n 10000 -q 5 -c 5 http://:31198/healthz
After a few minutes, the HPA will begin to scale the deployment:
kubectl describe hpa
Name:                       podinfo
Namespace:                  default
Reference:                  Deployment/podinfo
Metrics:                    ( current / target )
  "http_requests" on pods:  9059m / 10<
Min replicas:               2
Max replicas:               10
Events:
  Type    Reason             Age   From                       Message
  ----    ------             ----  ----                       -------
  Normal  SuccessfulRescale  2m    horizontal-pod-autoscaler  New size: 3; reason: pods metric http_requests above target
With the current number of requests per second, deployment will never reach a maximum of 10 pods. Three replicas are enough to ensure that the number of requests per second for each pod is less than 10.
After the load tests are completed, HPA will reduce the deployment scale to the original number of replicas:
Events:
  Type    Reason             Age   From                       Message
  ----    ------             ----  ----                       -------
  Normal  SuccessfulRescale  5m    horizontal-pod-autoscaler  New size: 3; reason: pods metric http_requests above target
  Normal  SuccessfulRescale  21s   horizontal-pod-autoscaler  New size: 2; reason: All metrics below target
You may have noticed that the auto-scaler does not immediately respond to changes in metrics. By default, they are synchronized every 30 seconds. In addition, scaling occurs only if there has not been an increase or decrease in workloads during the last 3-5 minutes. This helps prevent conflicting decisions and leaves time to connect the cluster auto-scaler.
Conclusion
Not all systems can enforce SLA compliance based solely on CPU or memory utilization (or both). Most web servers and mobile servers to handle traffic spikes need autoscaling based on the number of requests per second.
For ETL applications (from the Eng. Extract Transform Load - “extraction, transformation, loading”), auto-scaling can be triggered, for example, when the specified threshold length of the job queue is exceeded.
In all cases, instrumenting applications using Prometheus and highlighting the necessary indicators for autoscaling allow you to fine-tune applications to improve the processing of traffic spikes and ensure high availability of the infrastructure.
Ideas, questions, comments? Join the discussion at Slack !
Here is such a material. We are waiting for your comments and see you on the course !