Practical application of ELK. Configure logstash
Introduction
Deploying the next system, faced with the need to process a large number of various logs. As the tool chosen ELK. This article will discuss our experience with tuning this stack.
We do not set a goal to describe all its possibilities, but we want to concentrate precisely on solving practical problems. This is caused by the fact that in the presence of a sufficiently large amount of documentation and ready-made images, there are a lot of pitfalls, at least we found them.
We deployed the stack via docker-compose. Moreover, we had a well-written docker-compose.yml, which allowed us to raise the stack with almost no problems. And it seemed to us that the victory was already near, now we’ll twist a bit to fit our needs and that’s it.
Unfortunately, an attempt to tune the system to receive and process logs from our application was not crowned with success. Therefore, we decided that it was worth exploring each component separately, and then return to their relationships.
So, we started with logstash.
Environment, deployment, launch Logstash in the container
For deployment, we use docker-compose, the experiments described here were conducted on MacOS and Ubuntu 18.0.4.
The logstash image that was registered with us in the original docker-compose.yml is docker.elastic.co/logstash/logstash:6.3.2
We will use it for experiments.
To run logstash, we wrote a separate docker-compose.yml. Of course, it was possible to launch the image from the command line, but we did solve a specific problem, where everything from docker-compose is launched.
Briefly about configuration files
As follows from the description, logstash can be run both for one channel, in this case, it needs to transfer the * .conf file or for several channels, in this case it needs to be transferred the pipelines.yml file, which, in turn, will link to the files .conf for each channel.
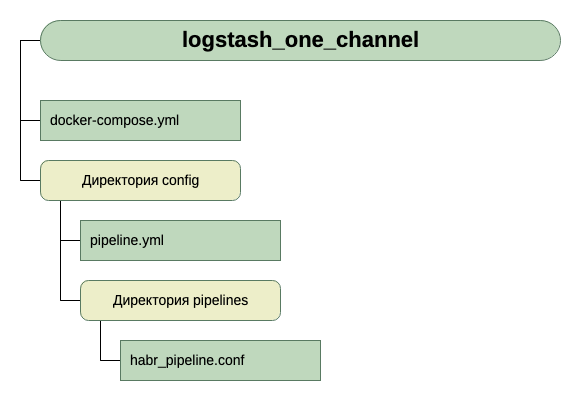
We went the second way. It seemed to us more universal and scalable. Therefore, we created pipelines.yml, and made the pipelines directory into which we will put the .conf files for each channel.
Inside the container there is another configuration file - logstash.yml. We do not touch it, use it as is.
So, the structure of our directories:
For now, we assume that it is tcp on port 5046 to obtain input, and we will use stdout for output.
Here is such a simple configuration for the first run. Since the initial task is to launch.
So, we have this docker-compose.yml
version: '3'
networks:
  elk:
volumes:
  elasticsearch:
    driver: local
services:
  logstash:
    container_name: logstash_one_channel
    image: docker.elastic.co/logstash/logstash:6.3.2
    networks:
      	- elk
    ports:
      	- 5046:5046
    volumes:
      	- ./config/pipelines.yml:/usr/share/logstash/config/pipelines.yml:ro
	- ./config/pipelines:/usr/share/logstash/config/pipelines:ro
What do we see here?
- Networks and volumes were taken from the original docker-compose.yml (the one where the entire stack is launched) and I think that they do not significantly affect the overall picture here.
- We create one logstash service from the docker.elastic.co/logstash/logstash:6.3.2 image and give it the name logstash_one_channel.
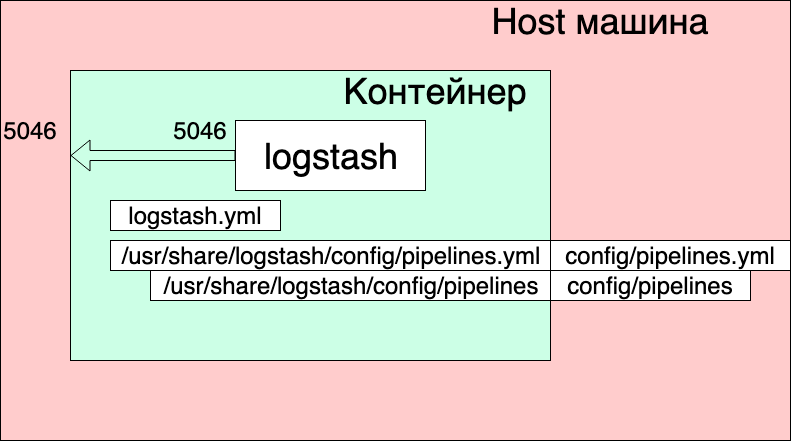
- We forward port 5046 inside the container to the same internal port.
- We map our channel settings file ./config/pipelines.yml to the file /usr/share/logstash/config/pipelines.yml inside the container, where logstash will pick it up and make it read-only, just in case.
- We display the ./config/pipelines directory, where we have the channel settings files, in the / usr / share / logstash / config / pipelines directory and also make it read-only.
Pipelines.yml file
- pipeline.id: HABR
  pipeline.workers: 1
  pipeline.batch.size: 1
  path.config: "./config/pipelines/habr_pipeline.conf"
Here, one channel with the HABR identifier and the path to its configuration file are described.
And finally the file “./config/pipelines/habr_pipeline.conf"
input {
  tcp {
    port => "5046"
   }
  }
filter {
  mutate {
    add_field => [ "habra_field", "Hello Habr" ]
    }
  }
output {
  stdout {
    }
  }
Let's not go into his description for now, try to run:
docker-compose up
What do we see?
The container started up. We can check its operation:
echo '13123123123123123123123213123213' | nc localhost 5046
And we see the answer in the console of the container:
But at the same time, we also see:
logstash_one_channel | [2019-04-29T11: 28: 59,790] [ERROR] [logstash.licensechecker.licensereader] Unable to retrieve license information from license server {: message => "Elasticsearch Unreachable: [http: // elasticsearch: 9200 /] [Manticore :: ResolutionFailure] elasticsearch ”, ...
logstash_one_channel | [2019-04-29T11: 28: 59,894] [INFO] [logstash.pipeline] Pipeline started successfully {: pipeline_id => ". Monitoring-logstash",: thread => "#
Logstash_one_channel | [2019-04-29T11: 28: 59,988] [INFO] [logstash.agent] Pipelines running {: count => 2,: running_pipelines => [: HABR,: ". Monitoring-logstash"],: non_running_pipelines => [ ]}
logstash_one_channel | [2019-04-29T11: 29: 00,015] [ERROR] [logstash.inputs.metrics] X-Pack is installed on Logstash but not on Elasticsearch. Please install X-Pack on Elasticsearch to use the monitoring feature. Other features may be available.
logstash_one_channel | [2019-04-29T11: 29: 00,526] [INFO] [logstash.agent] Successfully started Logstash API endpoint {: port => 9600}
logstash_one_channel | [2019-04-29T11: 29: 04,478] [INFO] [logstash.outputs.elasticsearch] Running health check to see if an Elasticsearch connection is working {: healthcheck_url => http: // elasticsearch: 9200 /,: path =>
logstash_one_channel | [2019-04-29T11: 29: 04,487] [WARN] [logstash.outputs.elasticsearch] Attempted to resurrect connection to dead ES instance, but got an error. {: url => “ elasticsearch : 9200 /”,: error_type => LogStash :: Outputs :: ElasticSearch :: HttpClient :: Pool :: HostUnreachableError,: error => “Elasticsearch Unreachable: [http: // elasticsearch: 9200 / ] [Manticore :: ResolutionFailure] elasticsearch »}
logstash_one_channel | [2019-04-29T11: 29: 04,704] [INFO] [logstash.licensechecker.licensereader] Running health check to see if an Elasticsearch connection is working {: healthcheck_url => http: // elasticsearch: 9200 /,: path => "/"}
logstash_one_channel | [2019-04-29T11: 29: 04,710] [WARN] [logstash.licensechecker.licensereader] Attempted to resurrect connection to dead ES instance, but got an error.elasticsearch : 9200 / ",: error_type => LogStash :: Outputs :: ElasticSearch :: HttpClient :: Pool :: HostUnreachableError,: error =>" Elasticsearch Unreachable: [http: // elasticsearch: 9200 /] [Manticore :: ResolutionFailure ] elasticsearch »}
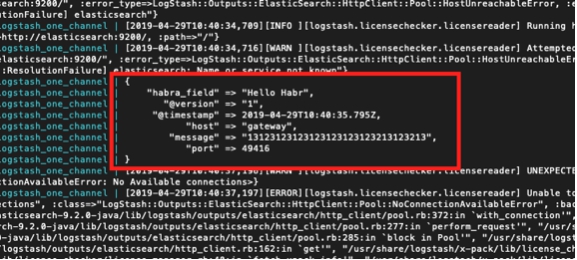
And our log keeps creeping up all the time.
Here I highlighted in green a message that the pipeline started successfully, red - an error message and yellow - a message about an attempt to contact elasticsearch : 9200.
This happens because the logstash.conf included in the image has a check for elasticsearch availability. After all, logstash assumes that it works as part of the Elk stack, and we separated it.
You can work, but not convenient.
The solution is to disable this check through the XPACK_MONITORING_ENABLED environment variable.
Make a change to docker-compose.yml and run it again:
version: '3'
networks:
  elk:
volumes:
  elasticsearch:
    driver: local
services:
  logstash:
    container_name: logstash_one_channel
    image: docker.elastic.co/logstash/logstash:6.3.2
    networks:
      - elk
    environment:
      XPACK_MONITORING_ENABLED: "false"
    ports:
      - 5046:5046
   volumes:
      - ./config/pipelines.yml:/usr/share/logstash/config/pipelines.yml:ro
      - ./config/pipelines:/usr/share/logstash/config/pipelines:ro
Now, everything is fine. The container is ready for experimentation.
We can again type in the next console:
echo '13123123123123123123123213123213' | nc localhost 5046
And see:
logstash_one_channel | {
logstash_one_channel |         "message" => "13123123123123123123123213123213",
logstash_one_channel |      "@timestamp" => 2019-04-29T11:43:44.582Z,
logstash_one_channel |        "@version" => "1",
logstash_one_channel |     "habra_field" => "Hello Habr",
logstash_one_channel |            "host" => "gateway",
logstash_one_channel |            "port" => 49418
logstash_one_channel | }
Work within one channel
So, we started. Now you can actually take the time to configure logstash directly. We will not touch the pipelines.yml file for now, we’ll see what you can get by working with one channel.
I must say that the general principle of working with the channel configuration file is well described in the official guide, here
If you want to read in Russian, we used this article (but the query syntax is old there, you have to take this into account).
Let's go sequentially from the Input section. We already saw work on tcp. What else could be of interest here?
Test messages using heartbeat
There is such an interesting opportunity to generate automatic test messages.
To do this, you need to include the heartbean plugin in the input section.
input {
  heartbeat {
    message => "HeartBeat!"
   }
  }
Turn on, start once a minute to receive
logstash_one_channel | {
logstash_one_channel |      "@timestamp" => 2019-04-29T13:52:04.567Z,
logstash_one_channel |     "habra_field" => "Hello Habr",
logstash_one_channel |         "message" => "HeartBeat!",
logstash_one_channel |        "@version" => "1",
logstash_one_channel |            "host" => "a0667e5c57ec"
logstash_one_channel | }
We want to get more often, we need to add the interval parameter.
This is how we will receive a message every 10 seconds.
input {
  heartbeat {
    message => "HeartBeat!"
    interval => 10
   }
  }
Retrieving data from a file
We also decided to see the file mode. If it works normally with the file, then it is possible that no agent will be needed, well, at least for local use.
According to the description, the operating mode should be similar to tail -f, i.e. reads new lines or, as an option, reads the entire file.
So what we want to get:
- We want to get lines that are appended to one log file.
- We want to receive data that is written to several log files, while being able to share what came from.
- We want to check that when restarting logstash it will not receive this data again.
- We want to check that if logstash is disabled, and the data continues to be written to files, then when we run it, we will get this data.
To conduct the experiment, add another line to docker-compose.yml, opening the directory in which we put the files.
version: '3'
networks:
  elk:
volumes:
  elasticsearch:
    driver: local
services:
  logstash:
    container_name: logstash_one_channel
    image: docker.elastic.co/logstash/logstash:6.3.2
    networks:
      - elk
    environment:
      XPACK_MONITORING_ENABLED: "false"
    ports:
      - 5046:5046
   volumes:
      - ./config/pipelines.yml:/usr/share/logstash/config/pipelines.yml:ro
      - ./config/pipelines:/usr/share/logstash/config/pipelines:ro
      - ./logs:/usr/share/logstash/input
And change the input section in habr_pipeline.conf
input {
  file {
    path => "/usr/share/logstash/input/*.log"
   }
  }
We start:
docker-compose up
To create and record log files, we will use the command:
echo '1' >> logs/number1.log
{
logstash_one_channel |            "host" => "ac2d4e3ef70f",
logstash_one_channel |     "habra_field" => "Hello Habr",
logstash_one_channel |      "@timestamp" => 2019-04-29T14:28:53.876Z,
logstash_one_channel |        "@version" => "1",
logstash_one_channel |         "message" => "1",
logstash_one_channel |            "path" => "/usr/share/logstash/input/number1.log"
logstash_one_channel | }
Yeah, it works!
At the same time, we see that we automatically added the path field. So in the future, we can filter records by it.
Let's try again:
echo '2' >> logs/number1.log
{
logstash_one_channel |            "host" => "ac2d4e3ef70f",
logstash_one_channel |     "habra_field" => "Hello Habr",
logstash_one_channel |      "@timestamp" => 2019-04-29T14:28:59.906Z,
logstash_one_channel |        "@version" => "1",
logstash_one_channel |         "message" => "2",
logstash_one_channel |            "path" => "/usr/share/logstash/input/number1.log"
logstash_one_channel | }
And now to another file:
echo '1' >> logs/number2.log
{
logstash_one_channel |            "host" => "ac2d4e3ef70f",
logstash_one_channel |     "habra_field" => "Hello Habr",
logstash_one_channel |      "@timestamp" => 2019-04-29T14:29:26.061Z,
logstash_one_channel |        "@version" => "1",
logstash_one_channel |         "message" => "1",
logstash_one_channel |            "path" => "/usr/share/logstash/input/number2.log"
logstash_one_channel | }
Excellent! The file was picked up, path was correct, everything is fine.
Stop logstash and restart. Let's wait. Silence. Those. We do not receive these records again.
And now the most daring experiment.
We put logstash and execute:
echo '3' >> logs/number2.log
echo '4' >> logs/number1.log
Run logstash again and see:
logstash_one_channel | {
logstash_one_channel |            "host" => "ac2d4e3ef70f",
logstash_one_channel |     "habra_field" => "Hello Habr",
logstash_one_channel |         "message" => "3",
logstash_one_channel |        "@version" => "1",
logstash_one_channel |            "path" => "/usr/share/logstash/input/number2.log",
logstash_one_channel |      "@timestamp" => 2019-04-29T14:48:50.589Z
logstash_one_channel | }
logstash_one_channel | {
logstash_one_channel |            "host" => "ac2d4e3ef70f",
logstash_one_channel |     "habra_field" => "Hello Habr",
logstash_one_channel |         "message" => "4",
logstash_one_channel |        "@version" => "1",
logstash_one_channel |            "path" => "/usr/share/logstash/input/number1.log",
logstash_one_channel |      "@timestamp" => 2019-04-29T14:48:50.856Z
logstash_one_channel | }
Hurrah! Everything was picked up.
But, we must warn about the following. If the container with logstash is deleted (docker stop logstash_one_channel && docker rm logstash_one_channel), then nothing will be picked up. Inside the container, the file position to which it was read was saved. If run from scratch, it will only accept new lines.
Read existing files
Suppose we run logstash for the first time, but we already have logs and we would like to process them.
If we run logstash with the input section that we used above, we won’t get anything. Only newlines will be processed by logstash.
In order to pull up lines from existing files, add an additional line to the input section:
input {
  file {
    start_position => "beginning"
    path => "/usr/share/logstash/input/*.log"
   }
  }
Moreover, there is a nuance, this only affects new files that logstash has not yet seen. For the same files that already fell into the field of view of logstash, he already remembered their size and now will only take new entries in them.
Let us dwell on the study of the input section. There are many more options, but for us, for further experiments for now is enough.
Routing and data conversion
Let's try to solve the following problem, let's say we have messages from one channel, some of them are informational, and partly an error message. Differ in tag. Some INFO, others ERROR.
We need to separate them at the output. Those. We write informational messages in one channel, and error messages in another.
To do this, go from the input section to filter and output.
Using the filter section, we will parse the incoming message, getting from it hash (key-value pairs), which you can already work with, i.e. disassemble by conditions. And in the output section, we select messages and send each to our channel.
Parsing a message using grok
In order to parse text strings and get a set of fields from them, there is a special plugin in the filter section - grok.
Not aiming to give here a detailed description here (for this I refer to the official documentation ), I will give my simple example.
To do this, you need to decide on the format of the input lines. I have them like this:
1 INFO message1
2 ERROR message2
i.e. The identifier comes first, then INFO / ERROR, then some word without spaces.
Not difficult, but enough to understand how it works.
So, in the filter section, in the grok plugin, we need to define a pattern for parsing our lines.
It will look like this:
filter {
  grok {
    match => { "message" => ["%{INT:message_id} %{LOGLEVEL:message_type} %{WORD:message_text}"] }
   }
  }
This is essentially a regular expression. Ready-made patterns are used, such as INT, LOGLEVEL, WORD. Their description, as well as other patterns, can be viewed here
Now, passing through this filter, our string will turn into a hash of three fields: message_id, message_type, message_text.
They will be displayed in the output section.
Routing messages in the output section using the if command
In the output section, as we recall, we were going to split the messages into two streams. Some - which iNFO, we will output to the console, and with errors, we will output to a file.
How do we split these posts? The condition of the problem already prompts the solution - we already have the selected message_type field, which can take only two values INFO and ERROR. It is for him that we will make a choice using the if statement.
if [message_type] == "ERROR" {
        # Здесь выводим в файл
       } else
     {
      # Здесь выводим в stdout
    }
The description of working with fields and operators can be found in this section of the official manual .
Now, about the actual conclusion itself.
The output to the console, everything is clear here - stdout {}
But the output to the file - remember that we run it all from the container and so that the file we write the result to is accessible from the outside, we need to open this directory in docker-compose. yml.
Total:
The output section of our file looks like this:
output {
  if [message_type] == "ERROR" {
    file {
          path => "/usr/share/logstash/output/test.log"
          codec => line { format => "custom format: %{message}"}
         }
    } else
     {stdout {
             }
     }
  }
In docker-compose.yml add another volume to output:
version: '3'
networks:
  elk:
volumes:
  elasticsearch:
    driver: local
services:
  logstash:
    container_name: logstash_one_channel
    image: docker.elastic.co/logstash/logstash:6.3.2
    networks:
      - elk
    environment:
      XPACK_MONITORING_ENABLED: "false"
    ports:
      - 5046:5046
   volumes:
      - ./config/pipelines.yml:/usr/share/logstash/config/pipelines.yml:ro
      - ./config/pipelines:/usr/share/logstash/config/pipelines:ro
      - ./logs:/usr/share/logstash/input
      - ./output:/usr/share/logstash/output
We start, we try, we see division into two flows.