One Veeam ONE. Intelligence, maps, agents and much more - today on the monitors of the country
According to the results of our survey , the Veeam ONE solution for monitoring and reporting on the state of virtual infrastructures is becoming increasingly popular, and readers are interested in what is new in version 9.5 Update 4. Today we will look at the most significant new products, including:
For details, welcome to cat.
The built-in problem alerts (alarms) in the properties now have a Knowledge Base tab with information from the manufacturer. It has the format of a knowledge base article about a problem that triggered this alert.
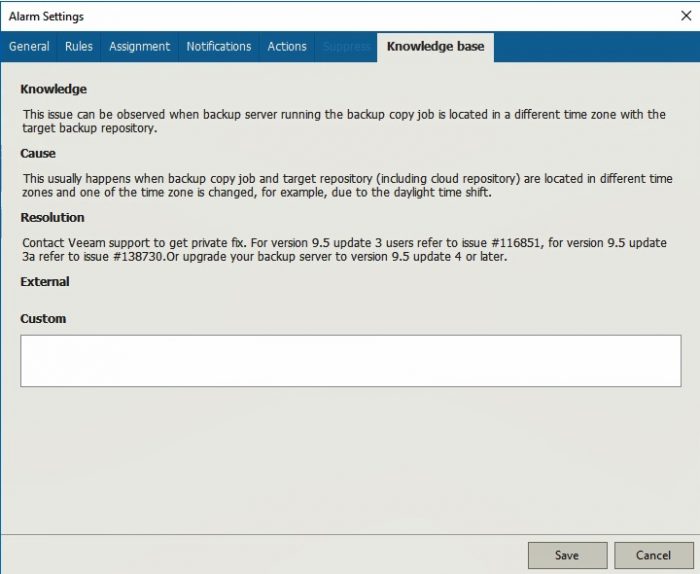
If there is a problem, for example, with the configuration, you will receive detailed information along with the notification about what could be the reason ( Cause ) and how to fix the situation ( Resolution ). And if, for example, there is already hotfix for this problem, then you can simply contact support and request the appropriate files from them - such an example is just shown in the screenshot above.
Smart diagnostics Veeam Intelligent Diagnostics can not only give advice according to the built-in knowledge base. You can also configure remediation actions.
Important!For such automated repair actions (built-in or custom) to work on Veeam Backup & Replication servers, you need to install the Veeam ONE agent component. This is described in detail here .
For example, consider the built-in alert that an unprotected virtual machine (or even several) is detected. What can be done here?
I note that the built-in action can only be selected one, and custom scripts can specify how much you need.
Veeam ONE will make 3 attempts to execute an inline action or script. If everything goes well, then the notification status will change to Acknowledged , and if not, then the notification will remain active.
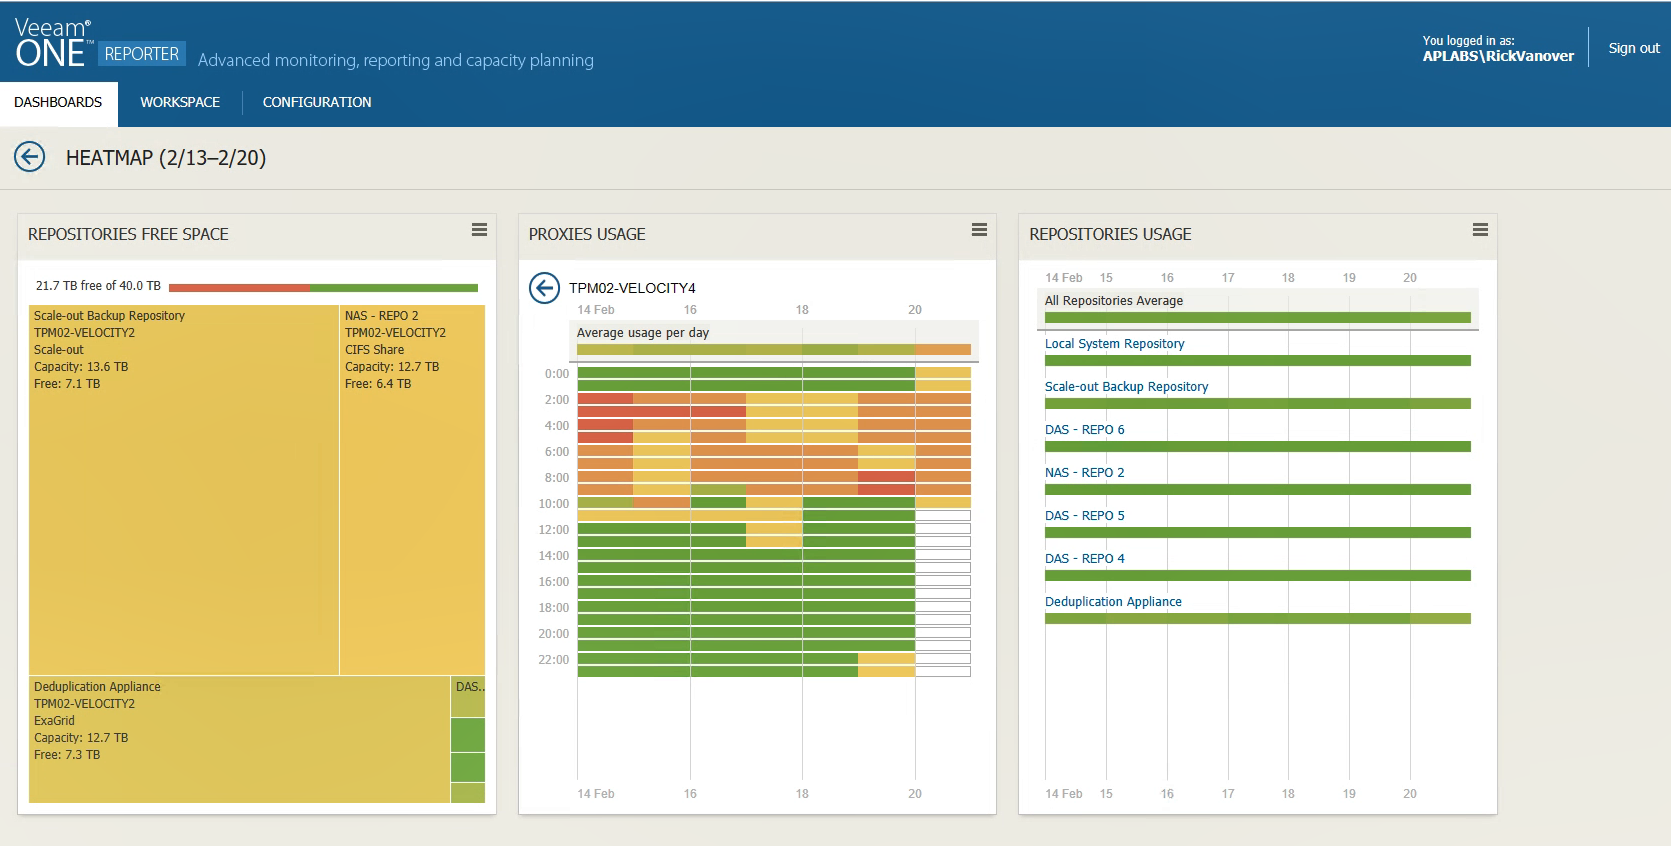
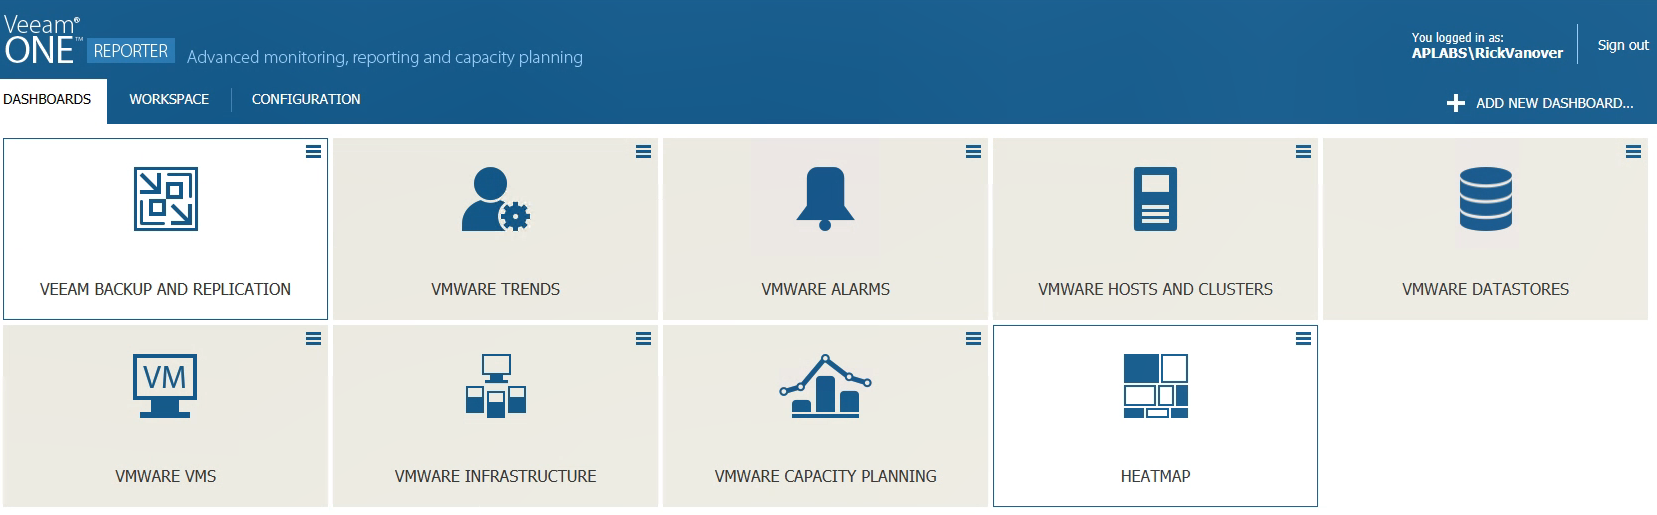
Heatmaps appeared in Veeam's solutions for a long time - the Veeam Management Pack received them first (this was an article on our blog, they are called “contextual dashboards” in it). Now they are implemented in Veeam ONE Reporter, where in the same way they help to get an idea of the state of your infrastructure and very quickly find out where something went wrong. All this visualization is available by clicking on the Heatmap widget on the Dashboards tab :
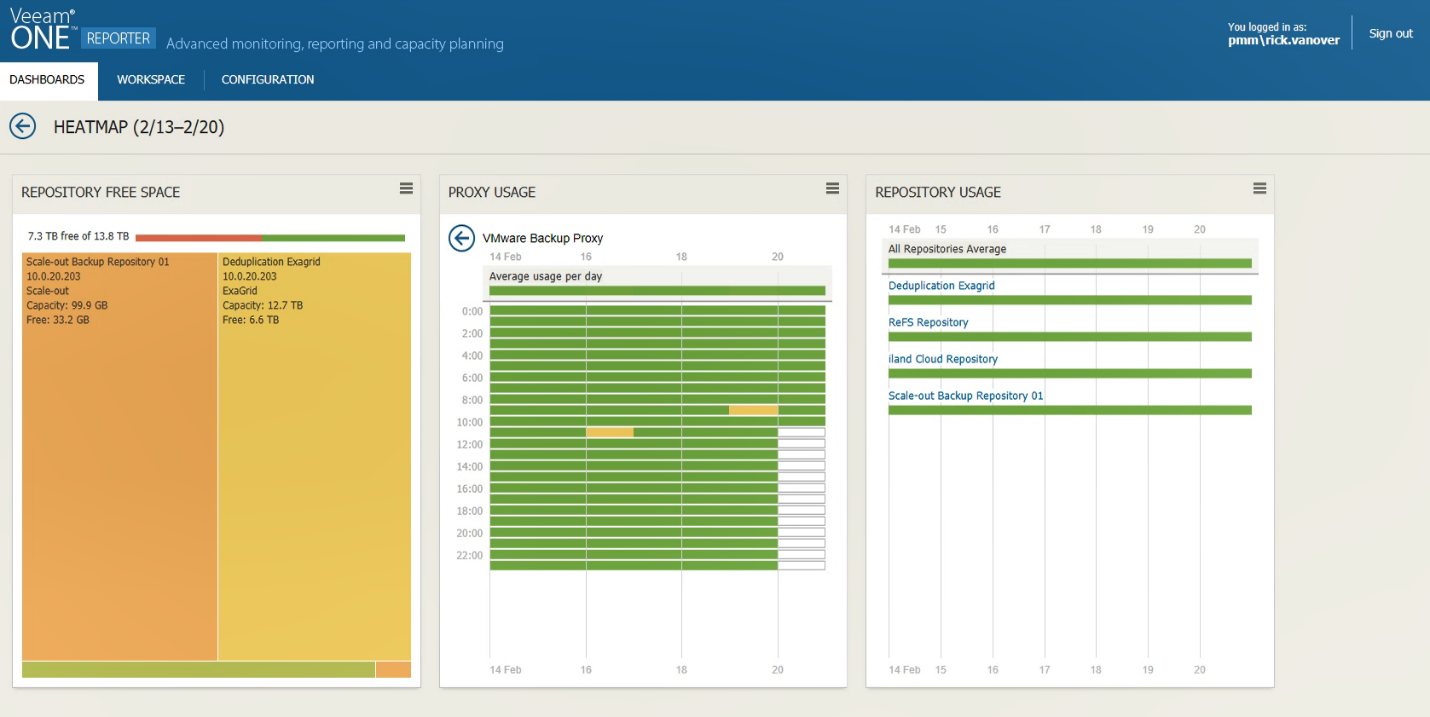
Here, for example, looks like a heat map of ahealthy person in the backup infrastructure, in which the load on Veeam backup proxies is reasonably balanced:
The widget on the left shows how much space is in the repository - we see that it is not so much. The widget in the center pleases the eye with green color - the load on two proxy servers is distributed evenly.
Attention! If for some proxy the download is indicated by a dark green color, this means that the proxy is completely free, that is, it’s idle, which is not good.
You can click on any of the proxy servers and see how high the load is during the day - here we see that the load falls on the backup window in the morning:
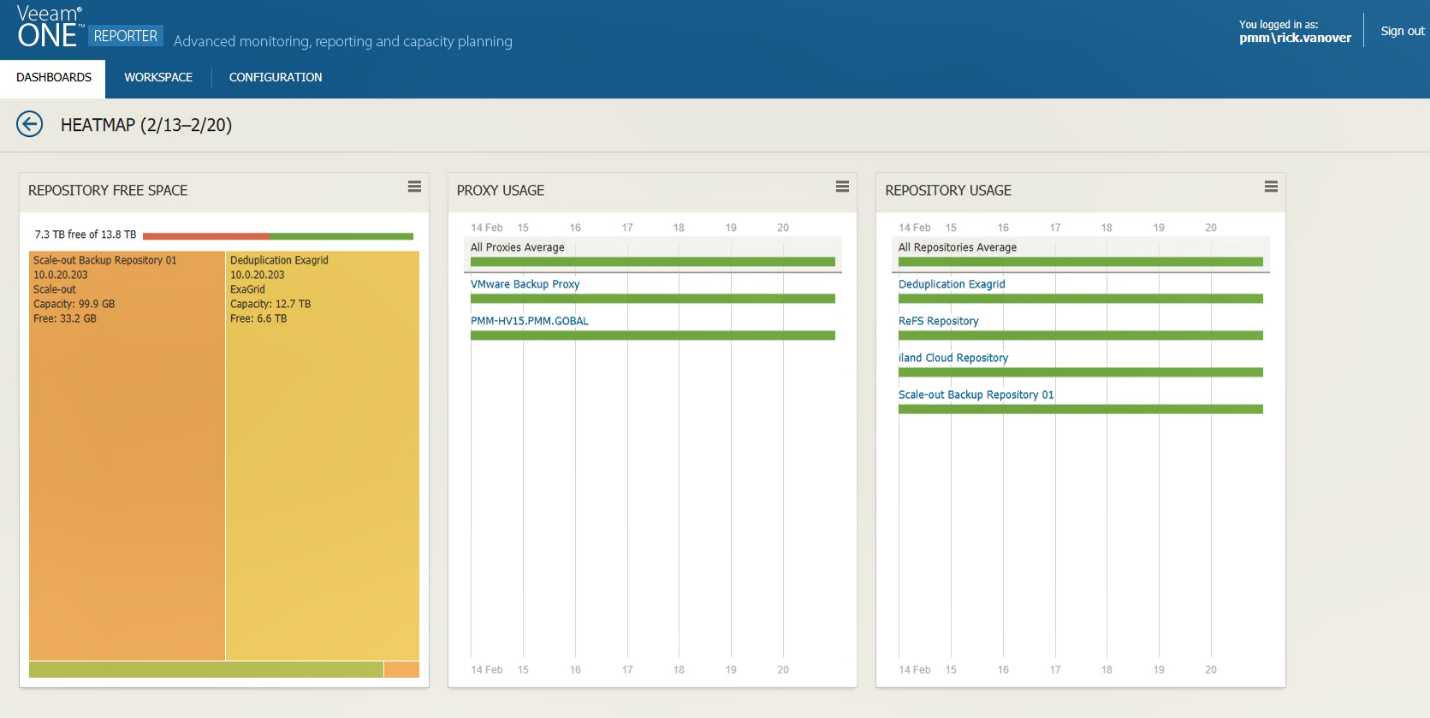
Let's now look at a less balanced infrastructure - the picture will differ there:
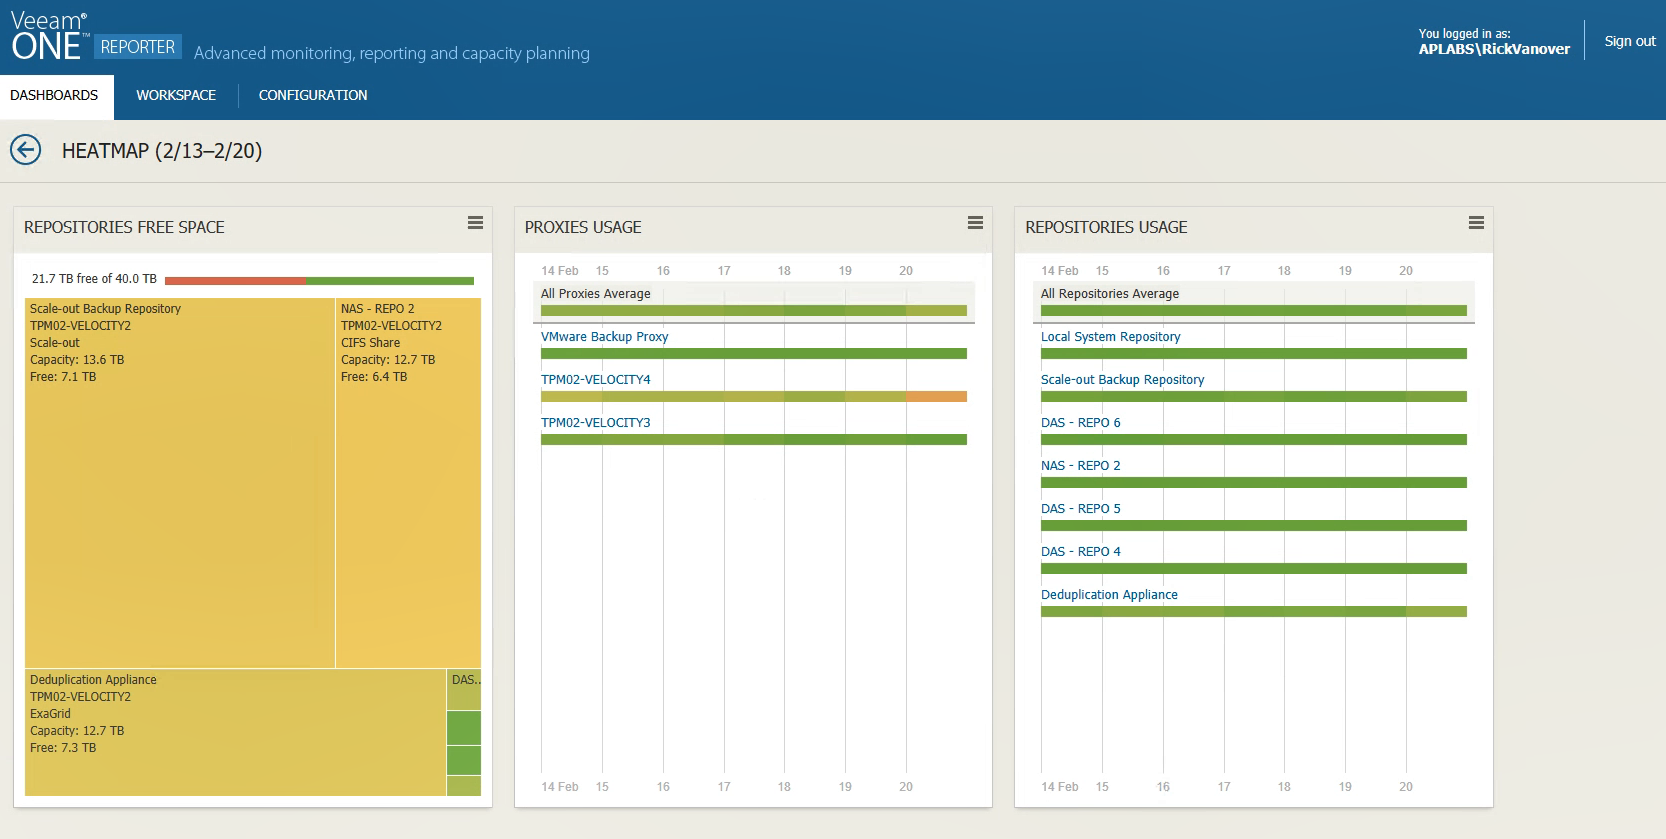
There are at least 3 proxies here, but one of them is clearly loaded more than the others (the one with the yellow-green indicator). If we examine it in detail, we will see that the main period of hard work falls on the night hours of work. Due to the underload of the remaining proxies, the backup window takes a rather long period of time, and it would be more reasonable to redistribute the load.
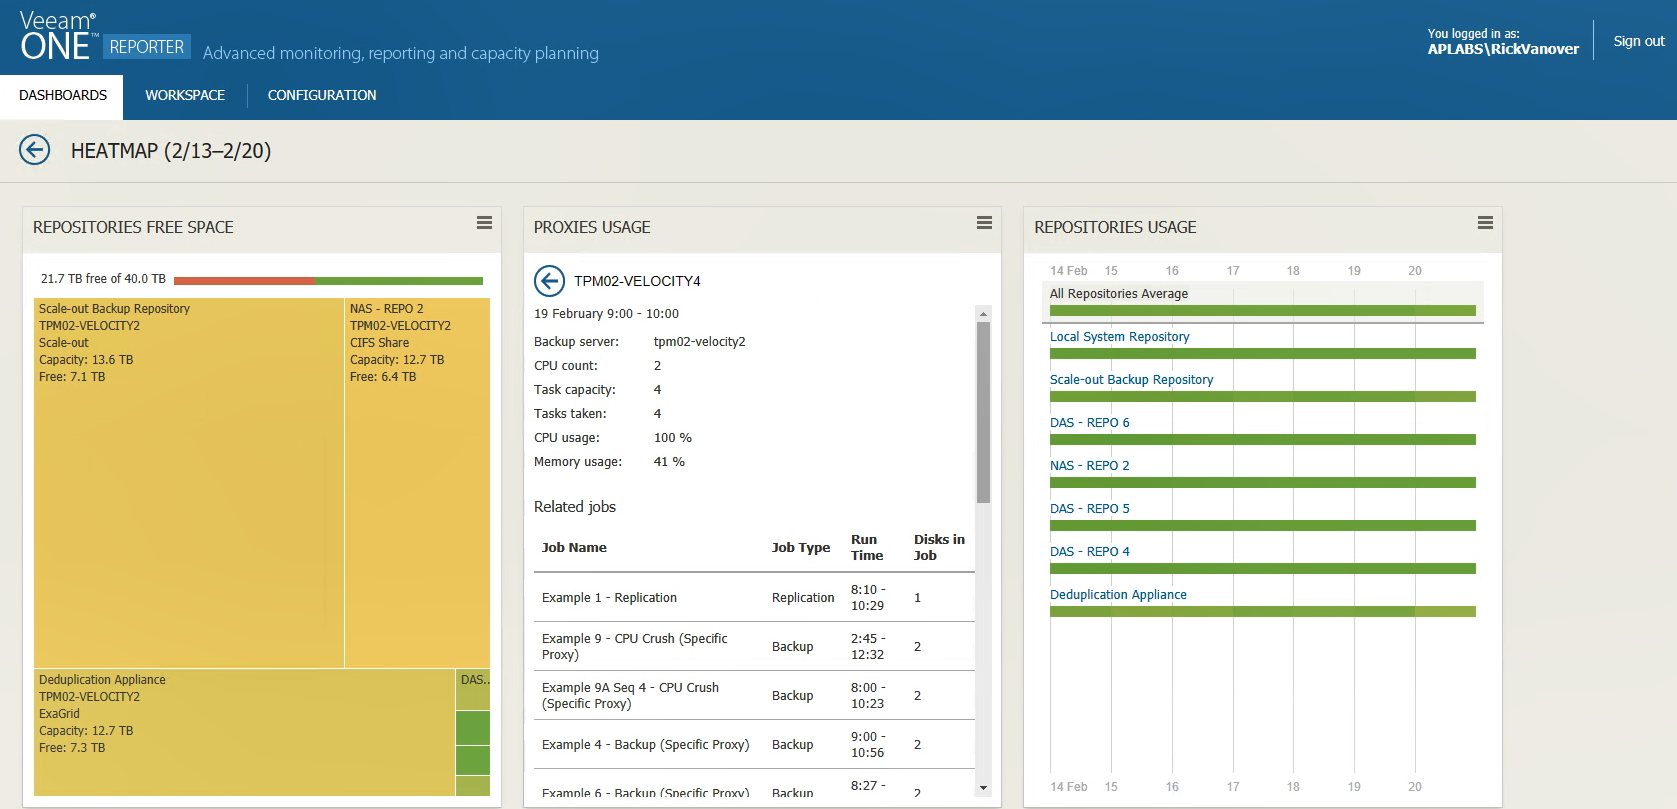
We click on the indicator for this proxy and then on the time interval in the central widget to understand the cause of the unfortunate proxy congestion - and here we will be shown detailed information, including the configuration of the proxy and the backup jobs that it processes:
The most common configuration errors include cases where proxy settings are not suitable for performing a specific backup task — for example, if the settings specify the use of Hot Add mode , while the proxy itself is a physical server. Naturally, such a server will never be selected for the task, and the entire load will be on the remaining proxies. As a result, the backup window will increase, which, of course, is undesirable.
In addition to the proxy, on the heatmap you can also observe the state of the repositories (including scalable Scale-Out Backup Repositories) - the Repositories Usage widget displays how repositories were busy with parallel processing of tasks during backup for a week.
Details about heat cards in Veeam ONE Reporter can be found in the documentation (in English).
This new feature, implemented in Veeam ONE Monitor, allows us to closely monitor the operation of services and processes in a virtual machine: We will

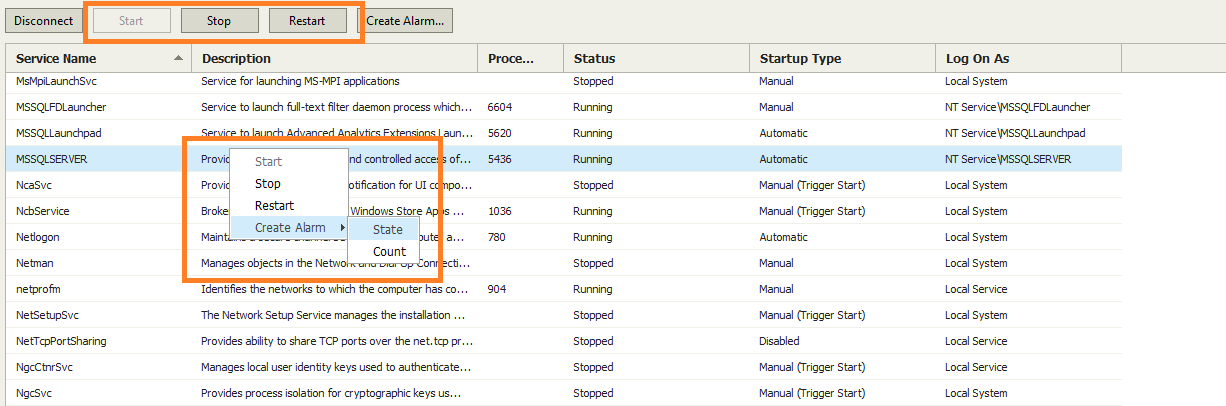
look at the operation of SQL Server service on a selected VM. Firstly, we can stop or resume this work - Veeam ONE Monitor can perform start , stop and restart operations , communicating with the service control manager.
Secondly, you can configure an alert that will be triggered, for example, to change the status of a service - for this, right-click on our service and select Create Alarm> State :
You can set notification settings, for example, so that it generates an error if the service does not work for 5 minutes. In this situation, most likely you need to restart the service. The trigger rule for an alert will look like this:
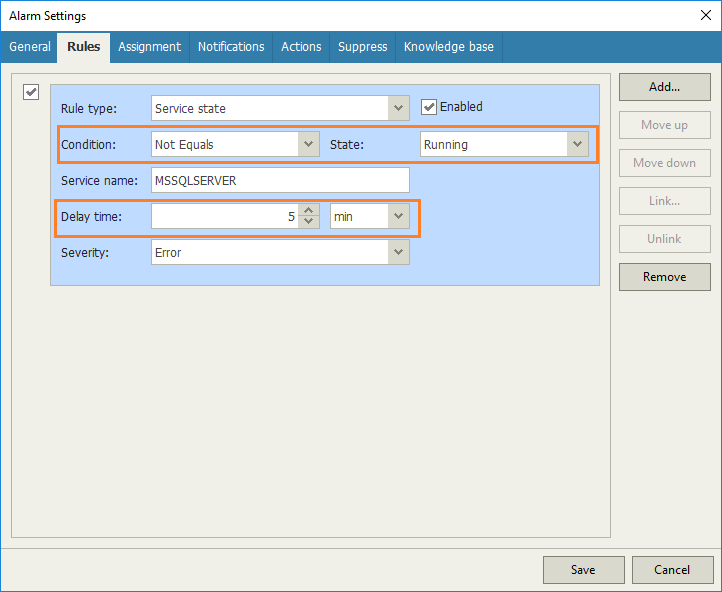
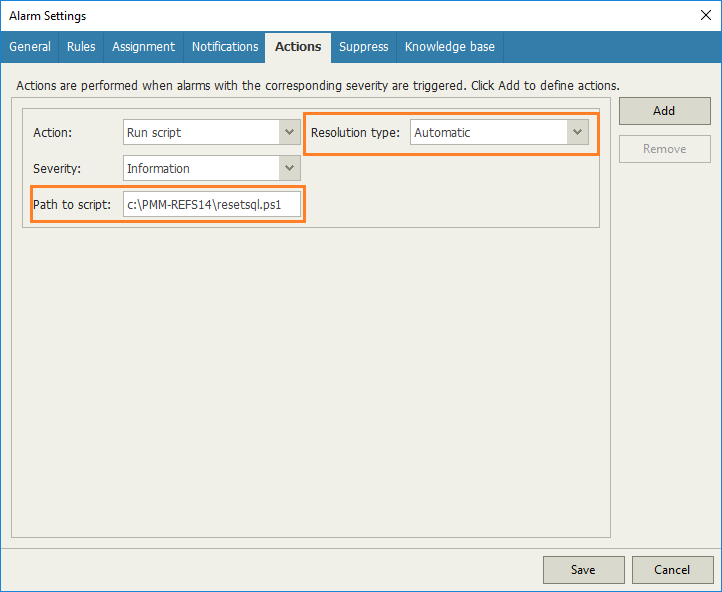
With these settings, the notification will give an error if the state of the service is different from Running for 5 minutes. Now go to the Action tab and specify the action to fix. In our example, this will be the automatic launch of a PowerShell script that will restart the service. We indicate the path to the script, we say that the type of our repair action is automatic (without our confirmation):
Useful: It will also be good form to configure the user to be notified of the restart of the service.
Another useful example is setting alerts to increase the number of services. Such an alert will be triggered, for example, if one or more new services were installed on a critical machine. This may be the result of unauthorized installation of software (or even malware).
You can configure alerts for processes — for example, how they use resources and their performance. To do this, in the notification properties on the Rules tab, select the rule type Rule type: Process performance .
Then we indicate that we want to monitor CPU usage and generate an alert if it falls below the specified threshold. Thresholds can be set not only to generate an error ( Error ), but also to warn ( Warning ):
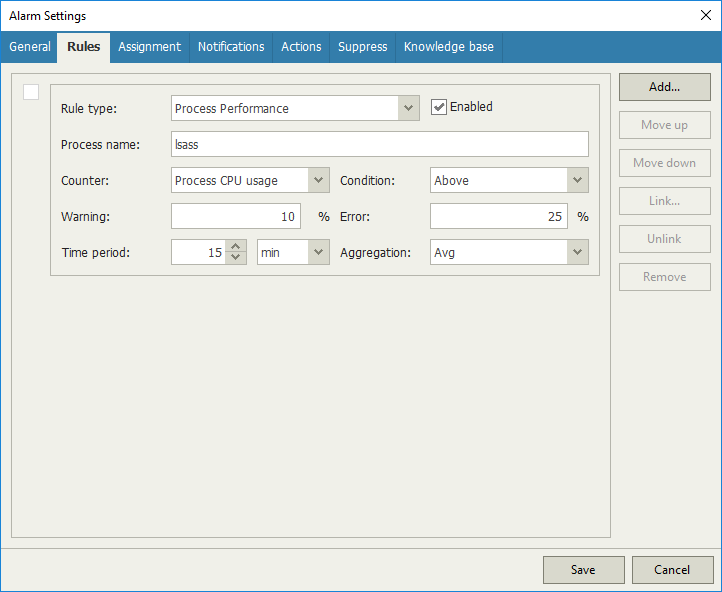
In this example, a 10% decrease in CPU usage will result in a warning, and a 25% decrease in error.
In version 9.5 Update 4, 3 new reports on the work of Veeam Agent Backup Jobs appeared:
Well, if you don’t have enough reports out of the box, you can set up a composite custom report Backup Infrastructure Custom Data and include the necessary information about Veeam Agents work in it.
Let us dwell in more detail on the last two reports. First, let's look at the Agent Backup Job and Policy History report :
You can click on the link on a specific date to see how the task worked on that day — what time it started, how long it took, what size the resulting backup was, whether it was a full or incremental backup.
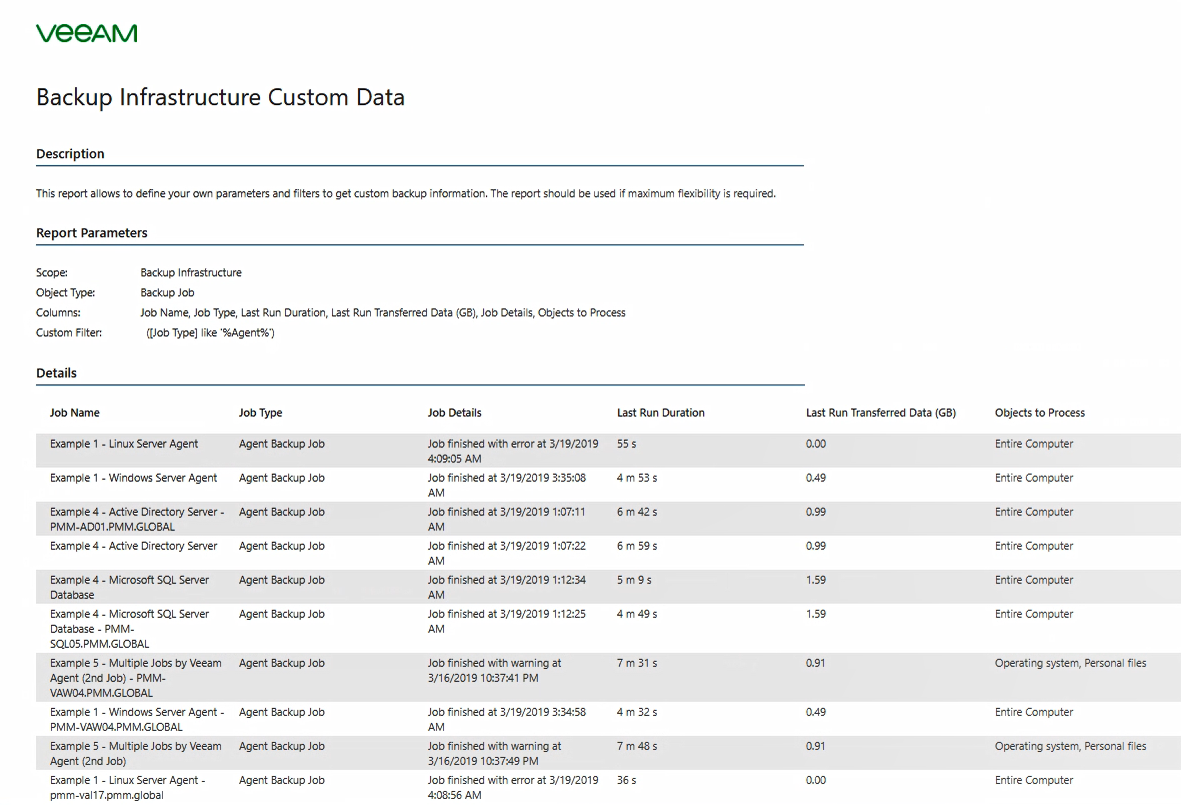
Now let's look at the Backup infrastructure custom data report . With it, you can receive data that does not provide reports “out of the box”. You can use the report designer to do this.
In Veeam ONE Reporter, select Custom Reports , find our report and specify for it:
Read more about this report here . An example of how it might look:
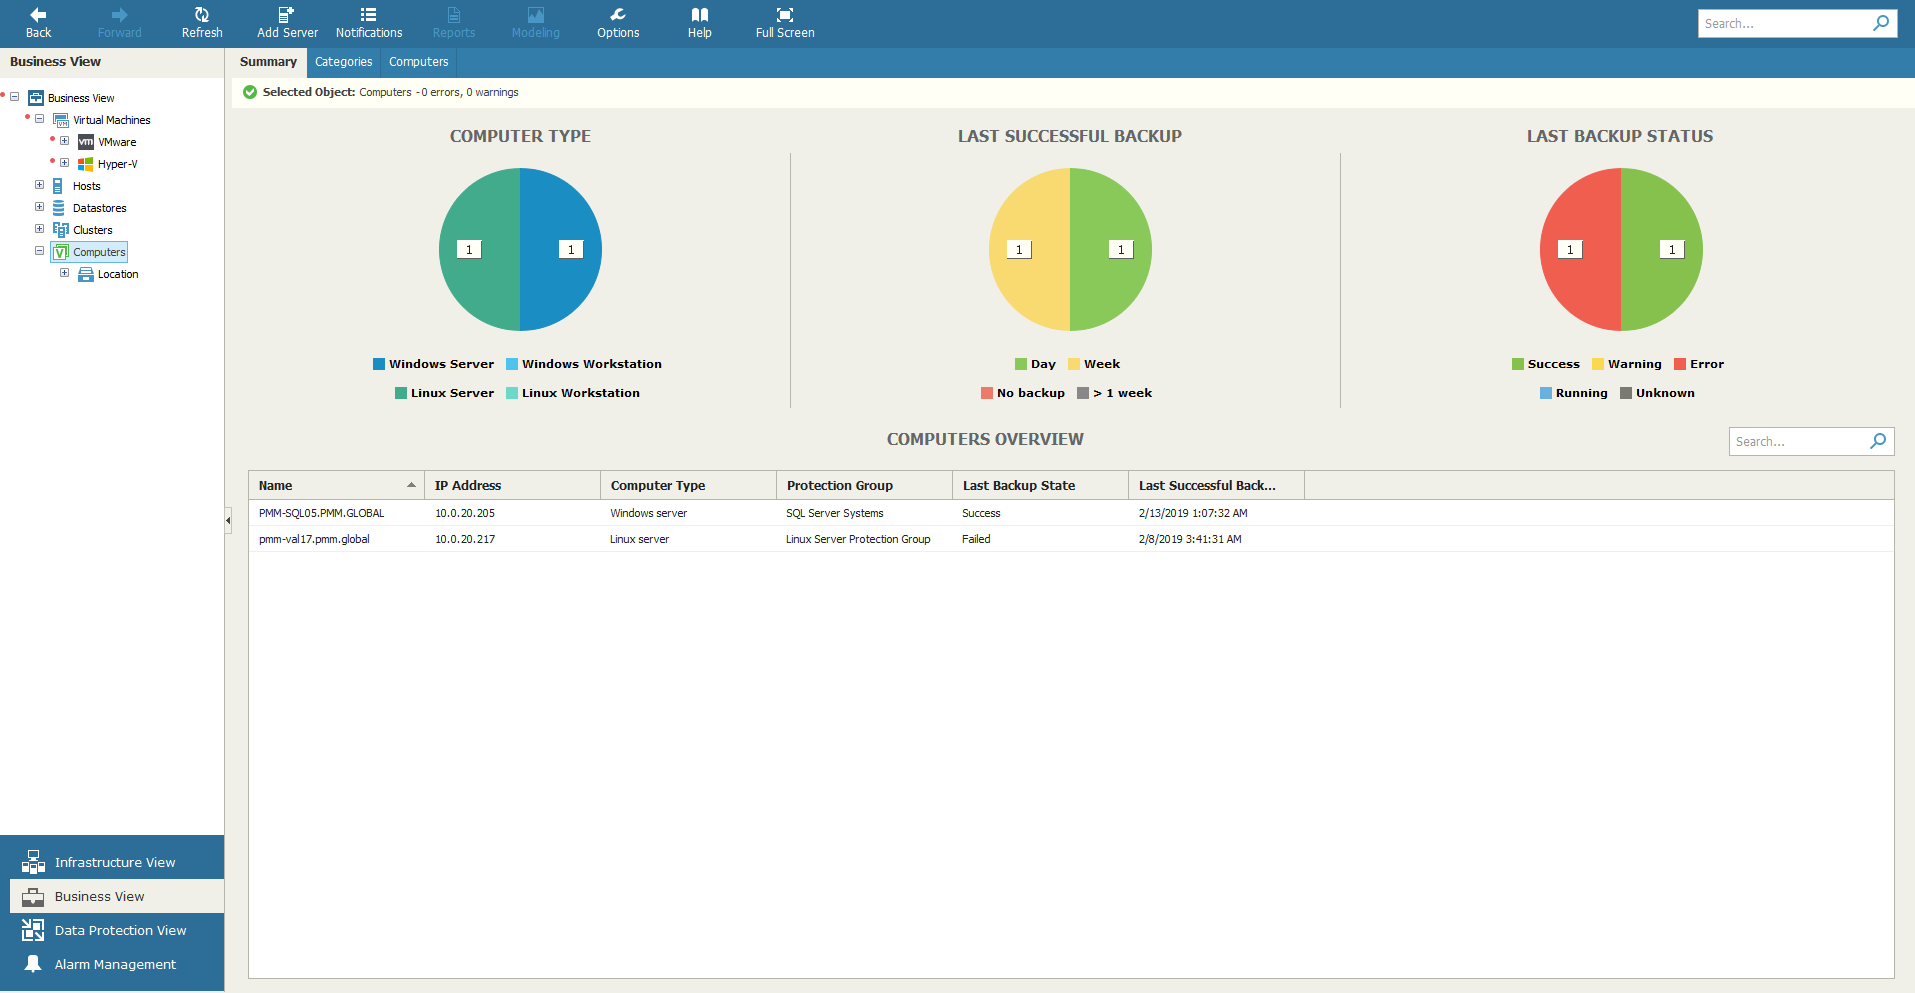
Using Veeam ONE Business View, you can now assign the machines running Veeam Agents to the appropriate category, which makes it easier for the administrator to monitor the infrastructure (the Veeam backup servers to which the agents are controlled should, of course, be monitored using Veeam ONE).
Details about the updated Business View can be found, for example, here (in English).
Both the commercial and free versions of the solution are still available. A brief comparative table for them is given below: The
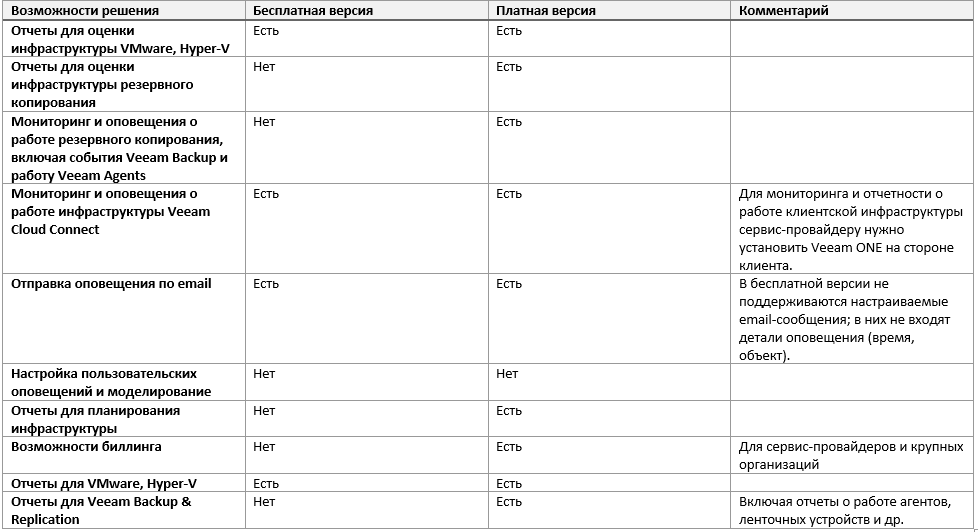
full table (in English) is available here .
Download Veeam ONE:
- Smart diagnostics and troubleshooting
- Heatmaps
- Application Monitoring
- New reports and categorization options for working with Veeam Agents
For details, welcome to cat.
Intelligent diagnostics and automated troubleshooting
The built-in problem alerts (alarms) in the properties now have a Knowledge Base tab with information from the manufacturer. It has the format of a knowledge base article about a problem that triggered this alert.
If there is a problem, for example, with the configuration, you will receive detailed information along with the notification about what could be the reason ( Cause ) and how to fix the situation ( Resolution ). And if, for example, there is already hotfix for this problem, then you can simply contact support and request the appropriate files from them - such an example is just shown in the screenshot above.
Smart diagnostics Veeam Intelligent Diagnostics can not only give advice according to the built-in knowledge base. You can also configure remediation actions.
Important!For such automated repair actions (built-in or custom) to work on Veeam Backup & Replication servers, you need to install the Veeam ONE agent component. This is described in detail here .
For example, consider the built-in alert that an unprotected virtual machine (or even several) is detected. What can be done here?
- First, open the Alarm Settings in the Veeam ONE Monitor console and go to the Actions tab :

- Here, in the Action list, we select how to fix the situation with VMs without backup, if one is detected. A complete list of possible actions can be found here .
We selected Add VM to backup job .
Useful: For your own notifications, you can configure your own repair actions by specifying which script to run. To do this, in the notification settings on the Actions tab, click the Add button , then select Run Script in the Action list . Next, in the Path to script field enter the path to the desired script. Important!
The script will be executed on Veeam ONE Server; You must provide access to the script file for the Veeam ONE service account. - In the Resolution type field, specify whether it is necessary to first obtain the approval of the person to perform the selected action:
- Automatic - no manual manipulations are required, after the notification is triggered, the program will start the specified action.
- Manual (selected by default for built-in alerts) - after the alert is triggered, you will need to agree to the specified action. It is done like this:- In the Veeam ONE Monitor console, select the desired view (Infrastructure View, Business View, vCloud Director View, Data Protection View) and the object of interest.
- In the panel on the right, go to the Alarms tab .
- Click on the Show remediable icon at the top to see for which alerts you need to approve the implementation of the relevant actions.
- Then, in the list of notifications, select the desired one, right-click and select the item Approve Action , or select it in the Actions panel on the right.
- If necessary, enter a comment in the Approve Remediation Actions dialog (it will appear in the Comment field in the history list), as well as in the email notification if you have it configured.)
- Click OK .
I note that the built-in action can only be selected one, and custom scripts can specify how much you need.
Veeam ONE will make 3 attempts to execute an inline action or script. If everything goes well, then the notification status will change to Acknowledged , and if not, then the notification will remain active.
Heatmaps
Heatmaps appeared in Veeam's solutions for a long time - the Veeam Management Pack received them first (this was an article on our blog, they are called “contextual dashboards” in it). Now they are implemented in Veeam ONE Reporter, where in the same way they help to get an idea of the state of your infrastructure and very quickly find out where something went wrong. All this visualization is available by clicking on the Heatmap widget on the Dashboards tab :
Here, for example, looks like a heat map of a
The widget on the left shows how much space is in the repository - we see that it is not so much. The widget in the center pleases the eye with green color - the load on two proxy servers is distributed evenly.
Attention! If for some proxy the download is indicated by a dark green color, this means that the proxy is completely free, that is, it’s idle, which is not good.
You can click on any of the proxy servers and see how high the load is during the day - here we see that the load falls on the backup window in the morning:
Let's now look at a less balanced infrastructure - the picture will differ there:
There are at least 3 proxies here, but one of them is clearly loaded more than the others (the one with the yellow-green indicator). If we examine it in detail, we will see that the main period of hard work falls on the night hours of work. Due to the underload of the remaining proxies, the backup window takes a rather long period of time, and it would be more reasonable to redistribute the load.
We click on the indicator for this proxy and then on the time interval in the central widget to understand the cause of the unfortunate proxy congestion - and here we will be shown detailed information, including the configuration of the proxy and the backup jobs that it processes:
The most common configuration errors include cases where proxy settings are not suitable for performing a specific backup task — for example, if the settings specify the use of Hot Add mode , while the proxy itself is a physical server. Naturally, such a server will never be selected for the task, and the entire load will be on the remaining proxies. As a result, the backup window will increase, which, of course, is undesirable.
In addition to the proxy, on the heatmap you can also observe the state of the repositories (including scalable Scale-Out Backup Repositories) - the Repositories Usage widget displays how repositories were busy with parallel processing of tasks during backup for a week.
Details about heat cards in Veeam ONE Reporter can be found in the documentation (in English).
Application Monitoring
This new feature, implemented in Veeam ONE Monitor, allows us to closely monitor the operation of services and processes in a virtual machine: We will
look at the operation of SQL Server service on a selected VM. Firstly, we can stop or resume this work - Veeam ONE Monitor can perform start , stop and restart operations , communicating with the service control manager.
Secondly, you can configure an alert that will be triggered, for example, to change the status of a service - for this, right-click on our service and select Create Alarm> State :
You can set notification settings, for example, so that it generates an error if the service does not work for 5 minutes. In this situation, most likely you need to restart the service. The trigger rule for an alert will look like this:
With these settings, the notification will give an error if the state of the service is different from Running for 5 minutes. Now go to the Action tab and specify the action to fix. In our example, this will be the automatic launch of a PowerShell script that will restart the service. We indicate the path to the script, we say that the type of our repair action is automatic (without our confirmation):
Useful: It will also be good form to configure the user to be notified of the restart of the service.
Another useful example is setting alerts to increase the number of services. Such an alert will be triggered, for example, if one or more new services were installed on a critical machine. This may be the result of unauthorized installation of software (or even malware).
You can configure alerts for processes — for example, how they use resources and their performance. To do this, in the notification properties on the Rules tab, select the rule type Rule type: Process performance .
Then we indicate that we want to monitor CPU usage and generate an alert if it falls below the specified threshold. Thresholds can be set not only to generate an error ( Error ), but also to warn ( Warning ):
In this example, a 10% decrease in CPU usage will result in a warning, and a 25% decrease in error.
New reports for Veeam Agents
In version 9.5 Update 4, 3 new reports on the work of Veeam Agent Backup Jobs appeared:
- Computer with no Archive Copy - with its help you can quickly find out which machines do not have backups.
- Computer Backup Status - reports daily on the status of backup for physical machines on which agents work.
- Agent Backup Job and Policy History - Provides historical data on all policies and tasks of Veeam Agent.
Well, if you don’t have enough reports out of the box, you can set up a composite custom report Backup Infrastructure Custom Data and include the necessary information about Veeam Agents work in it.
Let us dwell in more detail on the last two reports. First, let's look at the Agent Backup Job and Policy History report :
- Launch Veeam ONE Reporter, open the Workspace view.
- We go to the folder with built-in reports Veeam Backup Agent Reports.
- We select the “Agent Backup Job and Policy History” report, select Scope for it and indicate the data for which period of time we want to include in it.
Useful: In the same way, you can select Veeam backup server or specify specific tasks / backup policies. - Click Preview Report and wait for the completion of the report generation. Here's what it will look like:
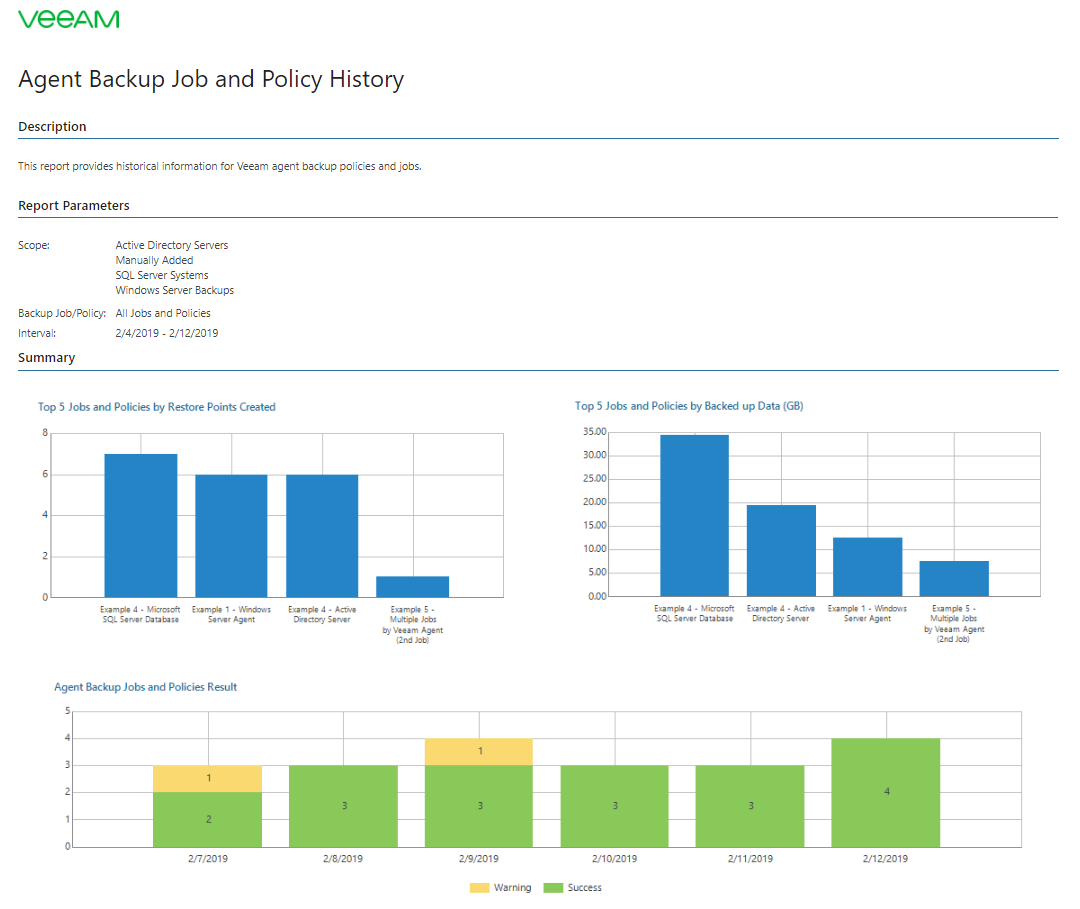
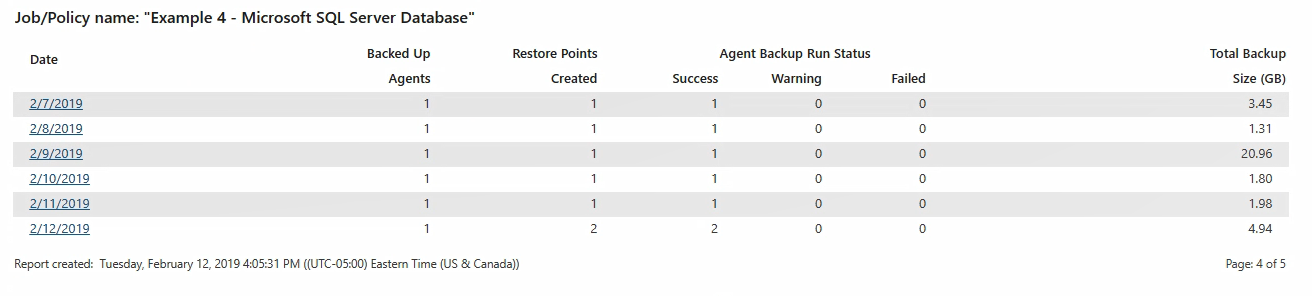
You can click on the link on a specific date to see how the task worked on that day — what time it started, how long it took, what size the resulting backup was, whether it was a full or incremental backup.
Now let's look at the Backup infrastructure custom data report . With it, you can receive data that does not provide reports “out of the box”. You can use the report designer to do this.
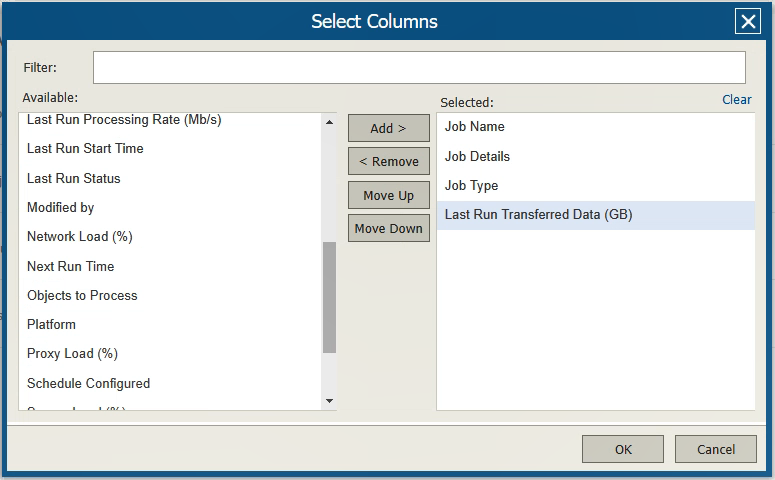
In Veeam ONE Reporter, select Custom Reports , find our report and specify for it:
- Scope : data from which Veeam Backup & Replication servers will be included in the report.
- Object type : the types of objects you are interested in (Backup Server, Backup Job, Virtual Machine, Computer).
- Columns : depending on the selected type of object, here you can specify which of its properties we want to analyze using the report. They will be displayed in columns. For convenience, you can filter them (by clicking Filter). Remember that no more than 50 properties can be included in a report.
- Custom Filter : You can set your own filter for these columns.
Read more about this report here . An example of how it might look:
Using Veeam ONE Business View, you can now assign the machines running Veeam Agents to the appropriate category, which makes it easier for the administrator to monitor the infrastructure (the Veeam backup servers to which the agents are controlled should, of course, be monitored using Veeam ONE).
Details about the updated Business View can be found, for example, here (in English).
Both the commercial and free versions of the solution are still available. A brief comparative table for them is given below: The
full table (in English) is available here .
What else to read and see
Download Veeam ONE:
- A trial version of the commercial edition of Veeam ONE is available from here .
- Free Community Edition from here .