April 25, 2019 at 14:29
We create an air quality control sensor on InfluxDB, Grafana, Docker and Raspberry Pi
- Transfer
Ever thought of monitoring air quality inside or outside your home: where do you live and work? This project, which we have christened balenaSense , is a unit for measuring temperature, humidity, barometric pressure and air quality, as well as a dashboard that you can access from anywhere to see summary statistics and track trends.

To control the quality of the air and the weather station, many wires and various sensors are required, but the situation became easier after the appearance of sensors that combine all the readings on a good small board, which is easy to start with.
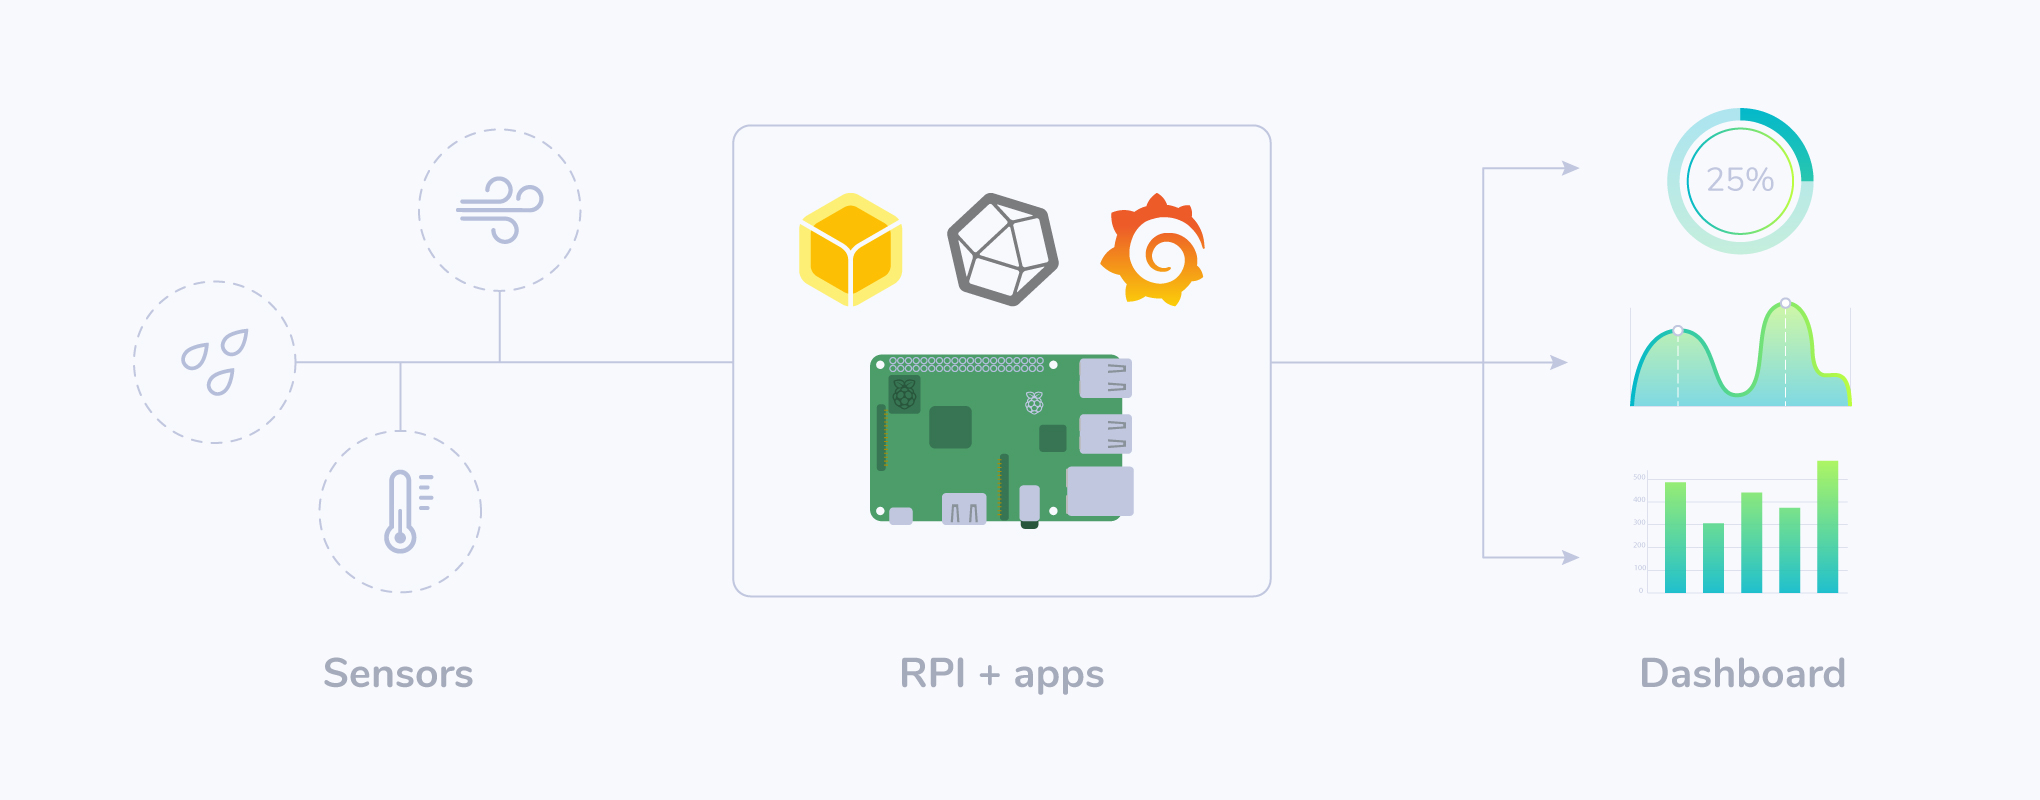
Consider monitoring temperature, humidity, barometric pressure and air quality using an all-in-one sensor that connects directly to the Raspberry Pi without additional components. You do not need any experience in electronics, but a soldering iron would be welcome (although it is also optional). This project implements a database for storing historical readings along with a graphical interface to view current readings and immediately see trends.


Here is what you need to buy for this project. Depending on whether you want to use a soldering iron or not, we choose a sensor board: some work right away, others require a little soldering.
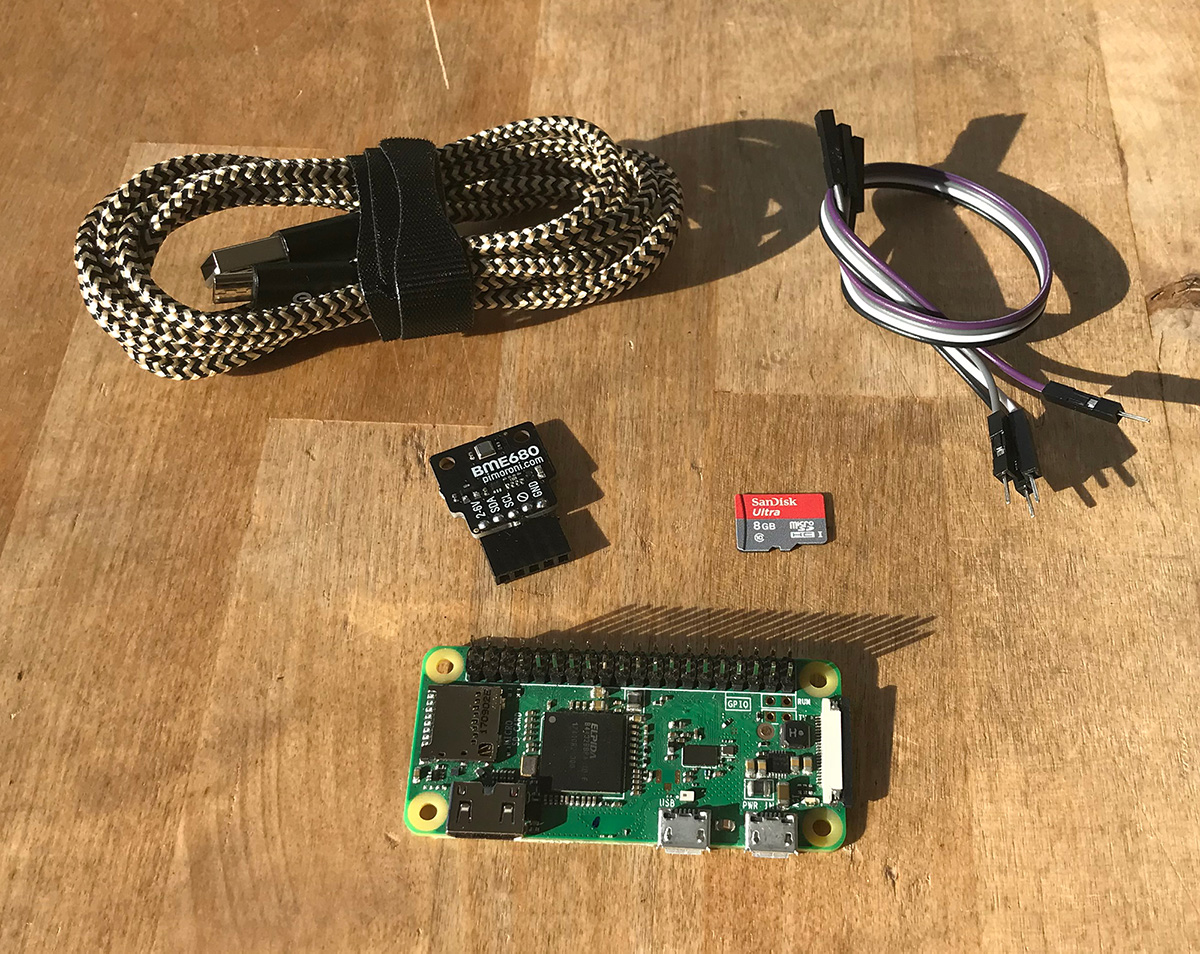
If you do not want to solder, you will need:
If you are happy to pick up a soldering iron, then you will need:
If you already have some kind of sensor, this project supports Sense HAT with an additional bonus: a smiley on the LED matrix (depending on air quality, of course)!

Bosch BME680 with riser can be ordered from different suppliers at different prices.
Note . In the article we use Pimoroni: this board has the additional advantage that the contacts are broken in the correct order for the Raspberry Pi GPIO. When using other cards, you must verify that the power, ground, and I2C bus pins (SDA and SCL) match, as explained later in the manual.
We opened the balena-sense project on GitHub , which contains all the software, configuration and code that you need for a working system. We are going to deploy this project on a free balenaCloud account to distribute all the software for the Raspberry Pi, as well as provide remote access. Therefore, you will need:
There is little work on the hardware front of this project. Our goal is to connect the sensor board to the GPIO pin on the Raspberry Pi.
The BME680 communicates with the Raspberry Pi via a bus called I2C (eye-squared-see), which is a serial bus with two wires. These two wires are called the synchronization line (SCK) and the data line (SDA). In addition to the two wires, it is necessary to supply power to the sensor (3.3V or 3V3) and ground it.
If you choose the option without soldering from Pimoroni or Sparkfun or using the Sense HAT, just connect the shiny new components to the Raspberry Pi and all the connections will be made for you: proceed to the next step!
If you decide to connect the sensor directly to the Raspberry Pi using Pimoroni or another riser, the main thing is to ensure the correct connection of the contacts described above (SDA, SCK, 3V3 and GND).
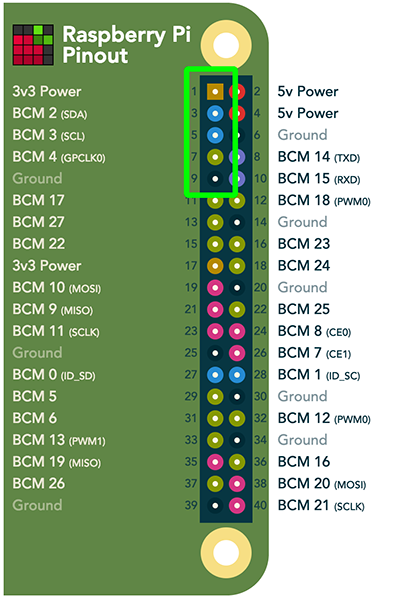
A useful site for working with GPIO on Raspberry Pi is pinout.xyz ; it clearly shows that we need pins 1 (3V3 power), 3 (SDA), 5 (SCL) and 9 (ground). A 40-pin GPIO is standard on Pi 2 and later. If you use a Pimoroni board, then the contacts are in the correct order to connect the boards. Notice how the inscription on the board matches the pinout diagram above.
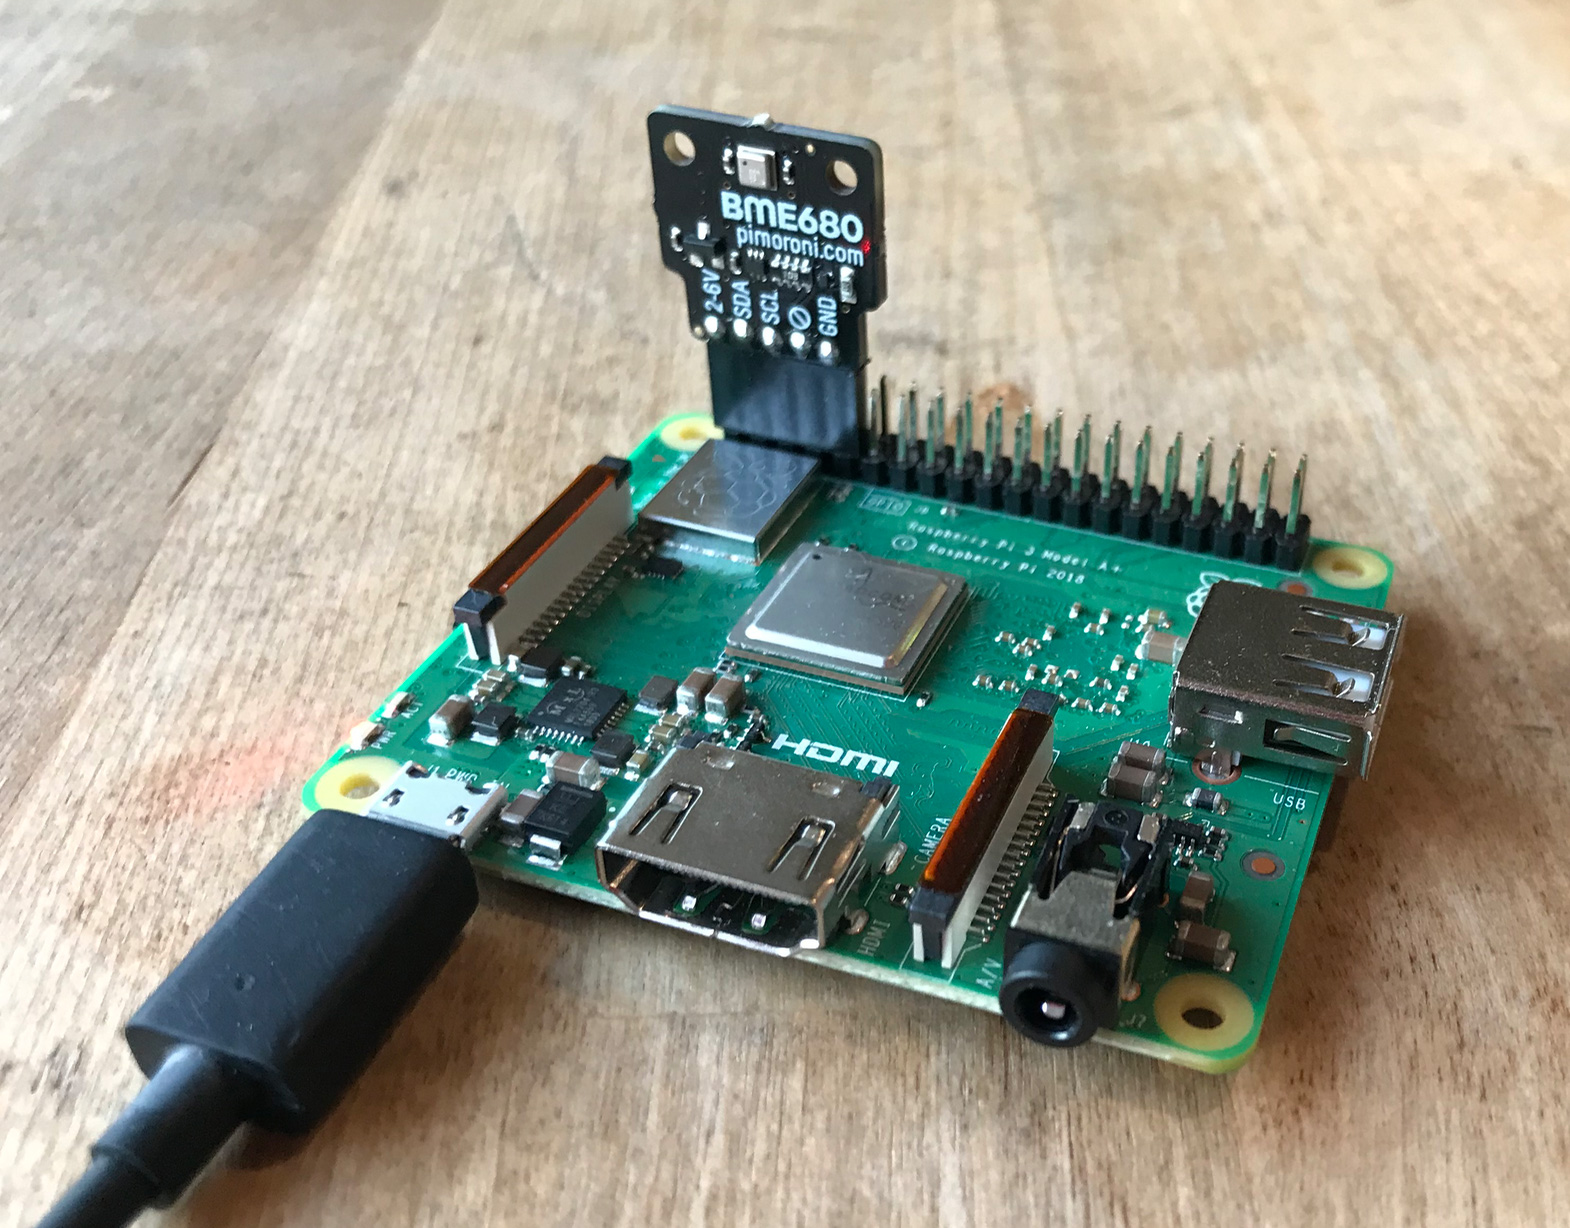
But if you connect the sensor in this way, then the heat from the Raspberry Pi processor will affect the readings. To collect more accurate readings, you need to remove the sensor from the board: we do this with DuPont mother-to-mother (or Jumper Jerky ) cables , as shown below:
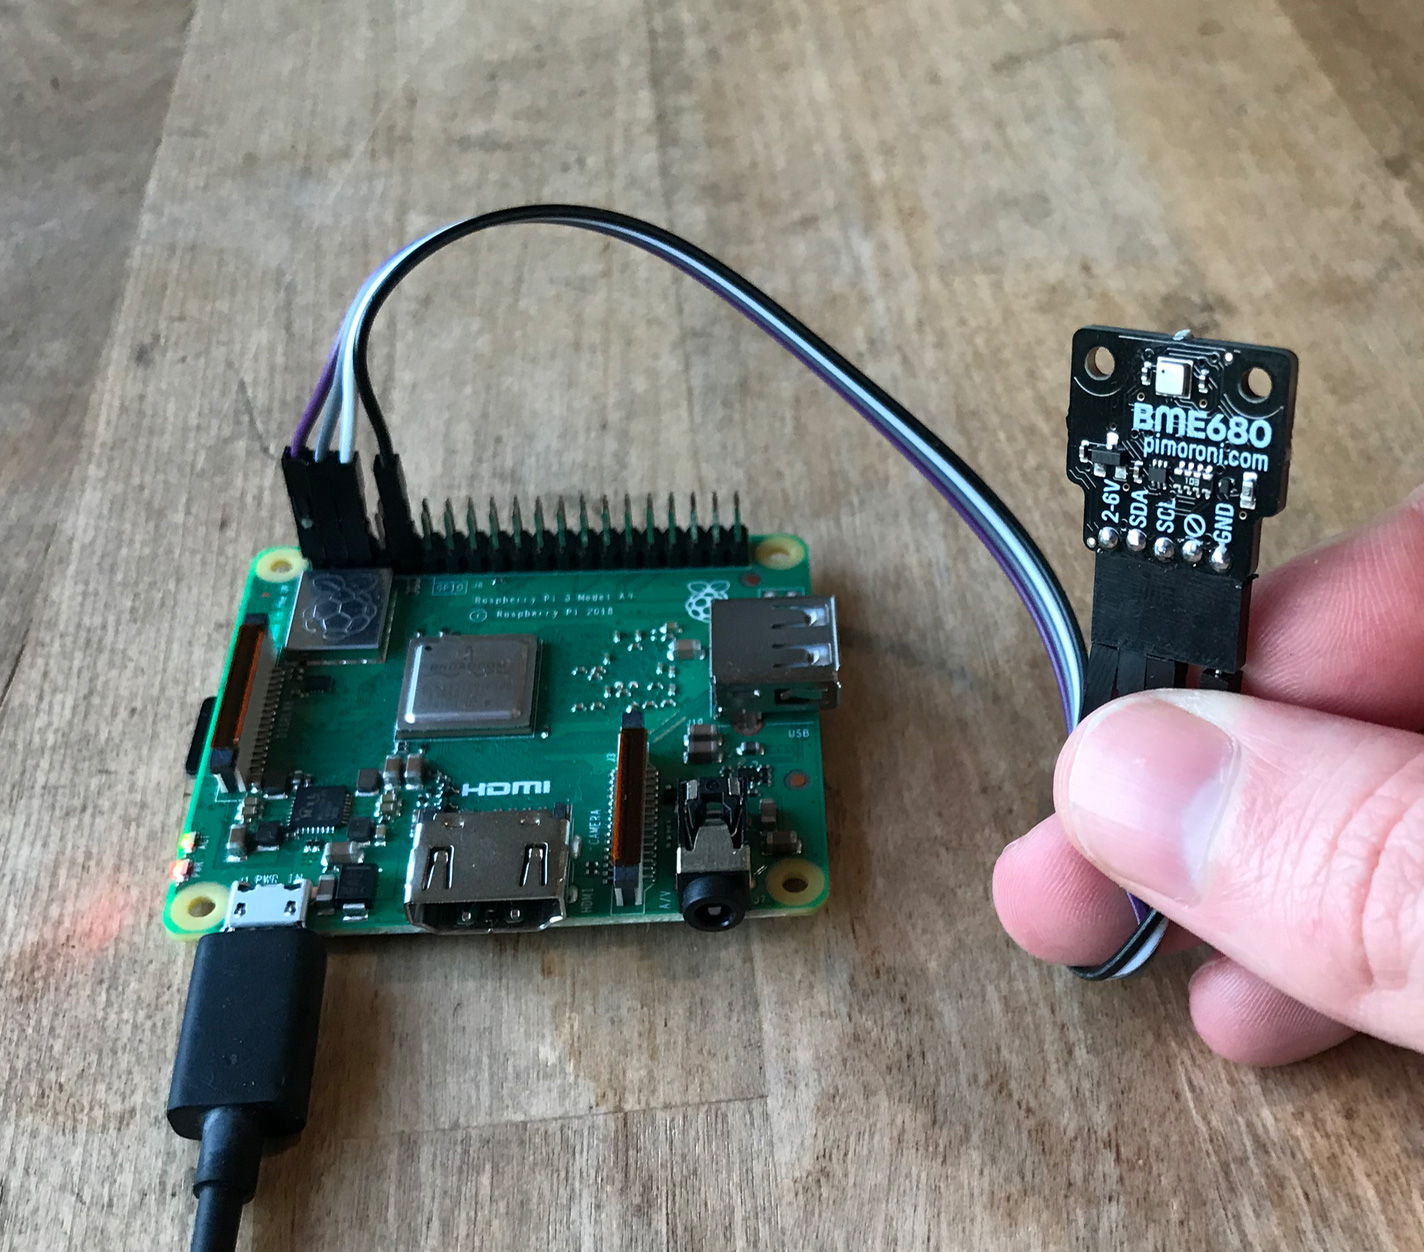
Similarly, if you use another sensor, where the pinout diagrams do not match exactly, you can connect these boards to the Pi using the same method. The main thing is to ensure compliance with 3V3, SDA, SCL and GND. If the board has contacts for SDI, SDO, CS - you can ignore them, because they are used for an alternative SPI interface, which we do not use in this project.
In the above photos, we have the Raspberry Pi 3A +, but Pi Zero is also suitable as a cheaper solution.
We are going to flash the SD card with the balenaOS operating system, attach to the balenaCloud cloud, add our device there and configure the project so that it can be easily updated later.
First you need to set up a balenaCloud account. This means registering, adding an application, and adding a device.
If you already have a GitHub or Google account, you can use it to log in without going through the registration process .
Add the application by selecting the correct device type and
Next, you will be taken to the dashboard for the newly created application, where you can go to the next step and add the device. You can give the application an arbitrary name, but you will need it later in the manual when we write the code.
After creating the application, you can add a device to this application by clicking the green Add Device button . When adding a device, specify the correct device type. If you are connecting to a wireless network, you can set your WiFI SSID and passphrase.
Note: Raspberry Pi 3 is indicated in the animation, do not forget to select the correct type of your device!
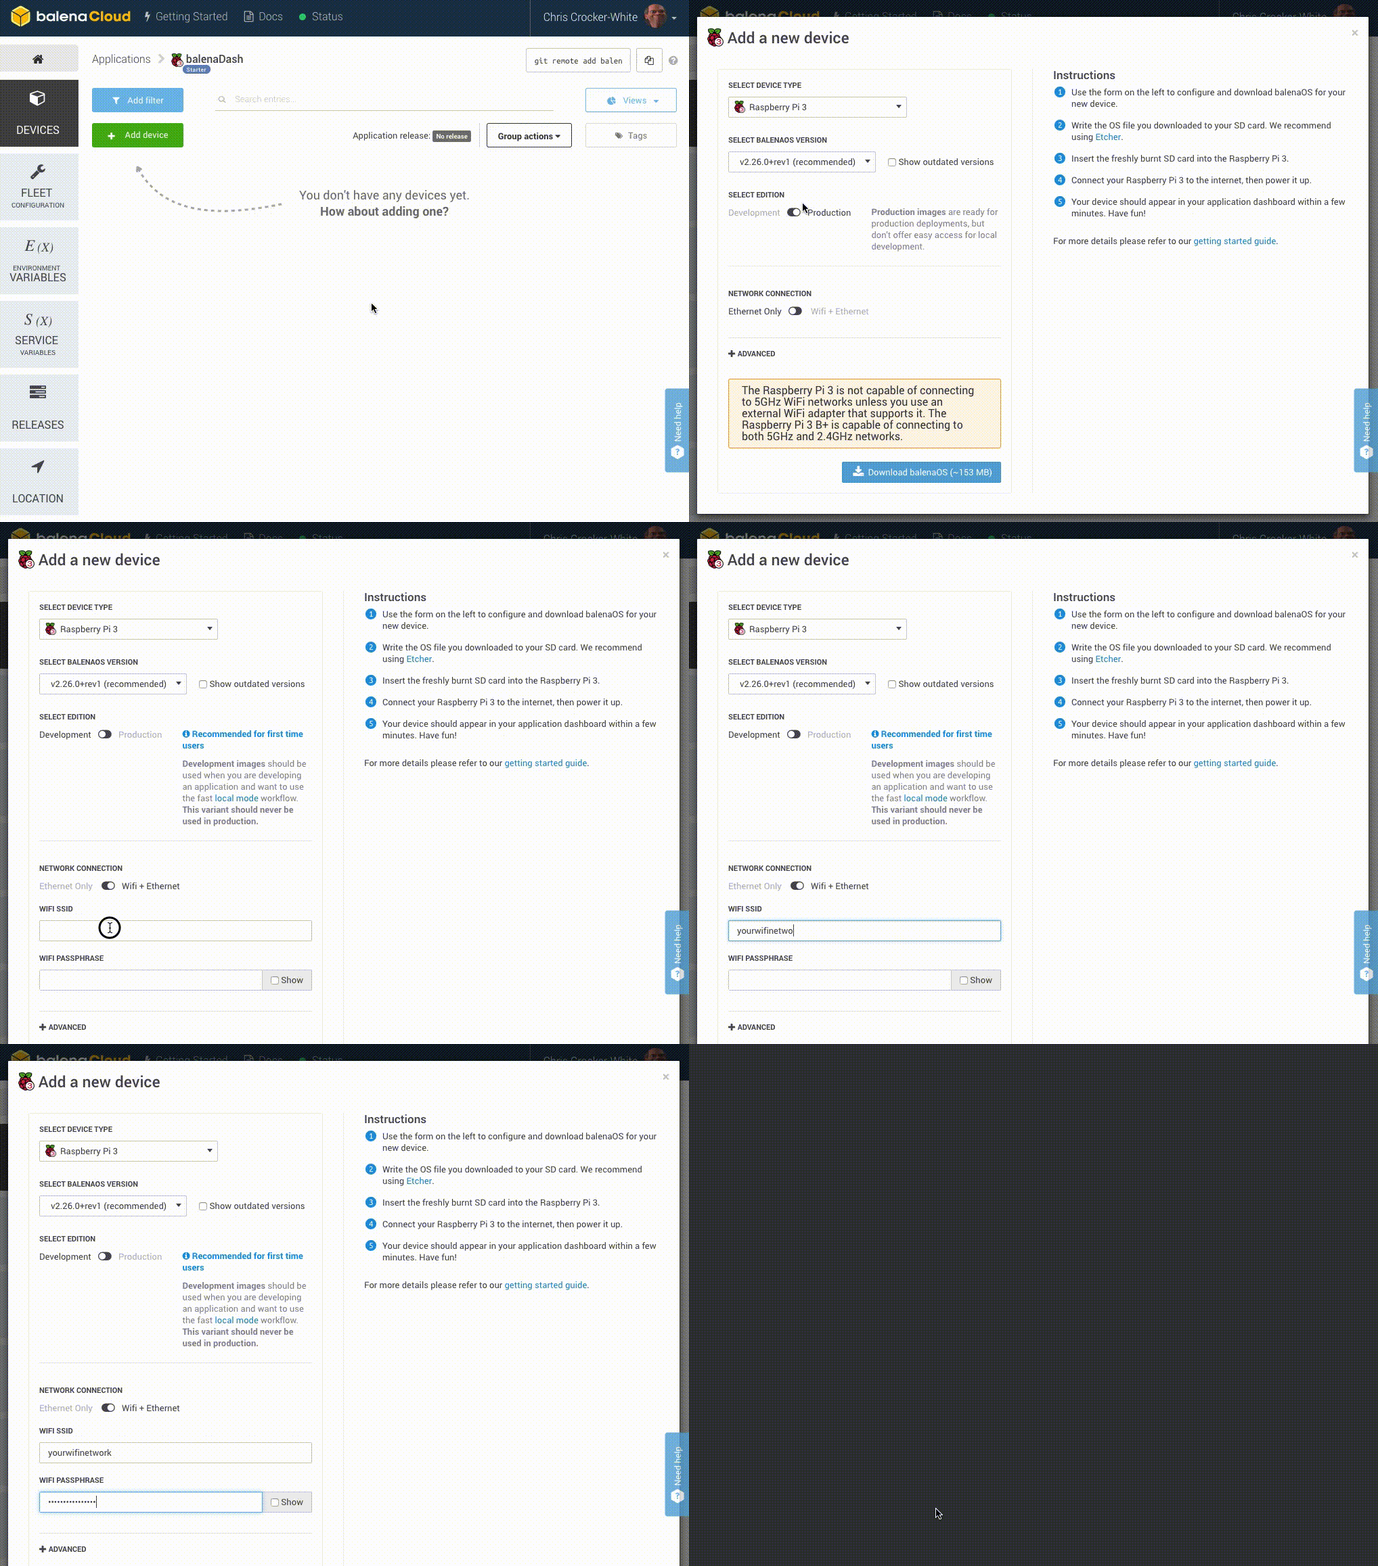
This process creates a custom image for the application and device type, which includes network settings, if specified.
Note: for starters, it is better to choose a dev image to conduct some tests and troubleshoot. For more information on the differences between development and production images, see here .. If you are sure that you can begin to deploy a production image right now - please.
When the OS image is loaded, it's time to flash the SD card. You can use balenaEtcher for this .
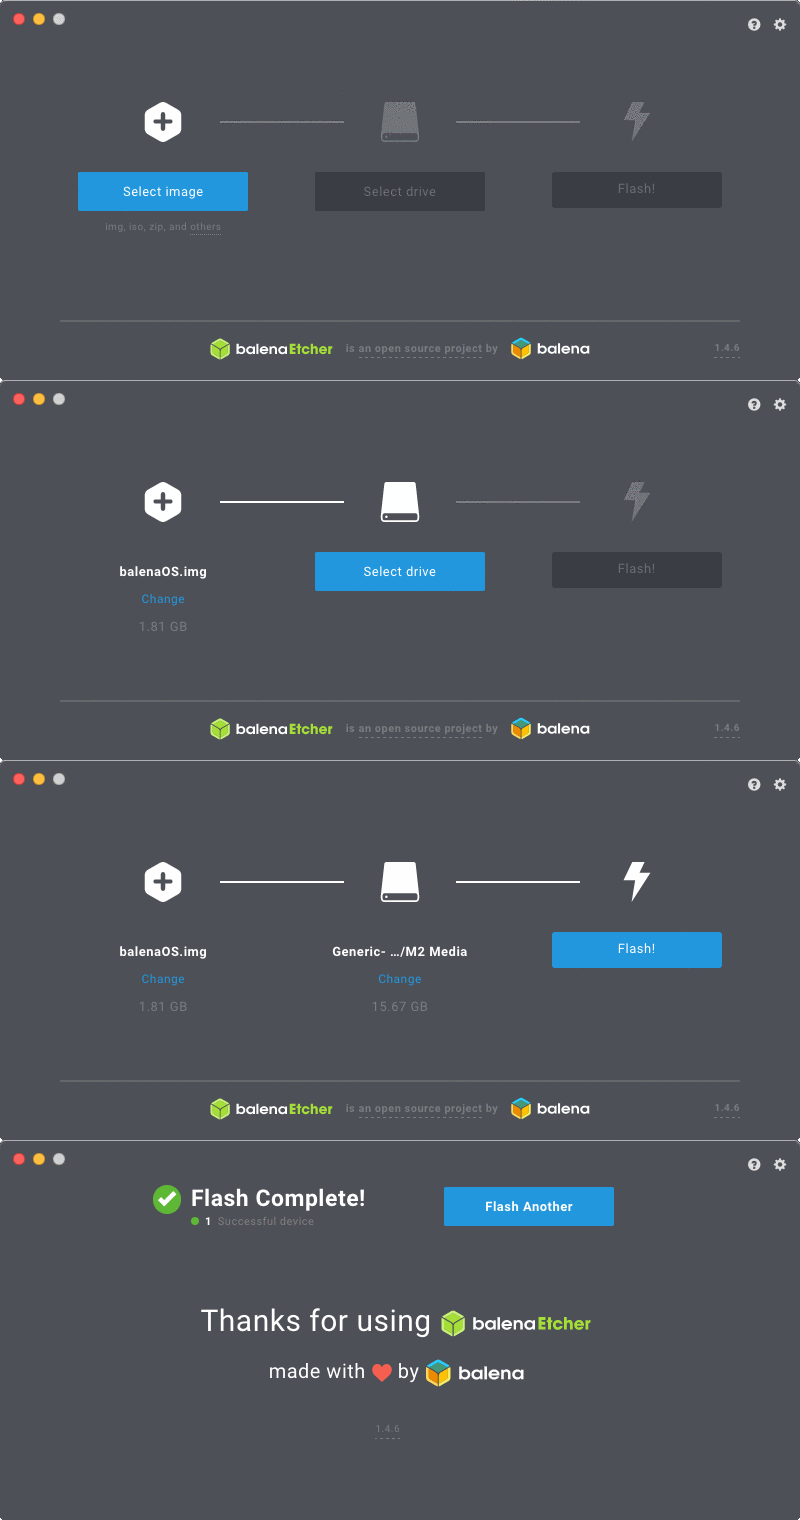
After the process is complete, insert the SD card into the Raspberry Pi and connect the power source.

When the device boots for the first time, it connects to the balenaCloud dashboard, after which you can see it in the online list and go to the next step.

Troubleshooting: the device should appear on the panel in a few minutes. If it does not appear, something went wrong. The documentation has an extensive troubleshooting guide with plenty of information on why this might happen. If the documentation did not help, please contact the forums .
When your Raspberry Pi is prepared, downloaded and connected to balenaCloud, you are ready to install the application code on the device.
BalenaCloud allows you to remotely transfer application software / code to the Raspberry Pi and other devices. To make this possible, your workstation (not the Raspberry Pi) must meet some minimum software requirements. Note: To successfully deploy this project, you do not need to run any commands on the device itself, either through SSH or from the balenaCloud dashboard. Everything is done remotely!
If you already have (or you can configure) npm on your computer , then this is the fastest way to run CLI tools. There are also binaries for Windows, macOS and Linux . Note:If you have already installed these tools for our other projects, you can skip this part and go directly to the next step.
The documentation for the CLI tools describes the installation and configuration of the npm package, as well as the binaries.
When you have the CLI installed and running, the first step is to log into balenaCloud by running the command
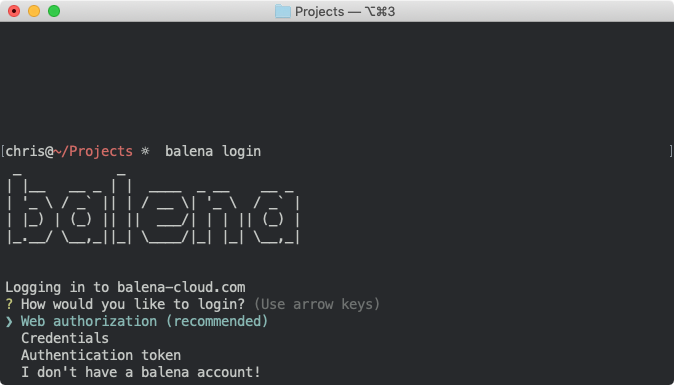
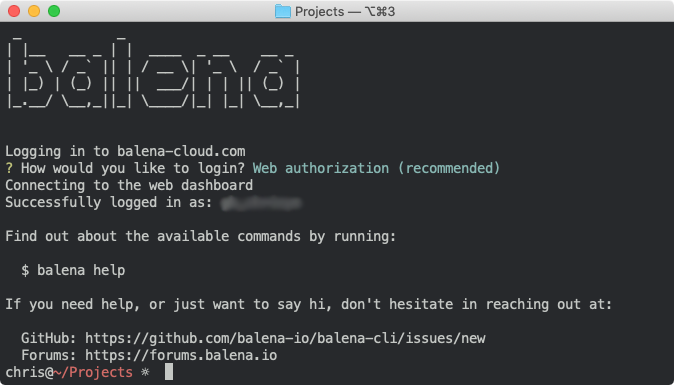
When there is a working CLI that is registered in the account, you are ready to install the programs on the Raspberry Pi.
The next step is to download the code for this project from GitHub .
The blue button will load the project zip file, but if you are already familiar with Git, you can use
Since the CLI and the latest code are installed, you can run this code on balenaCloud with one command. There, the Docker image is collected and configured, which will run on your device.
From the project directory after unpacking it, run the command where appName is the application name specified at the beginning of the manual. Eg . If everything is done correctly, after a few minutes the information screen of your device on the control panel should show the running services, one for each of the software components, something like this: The first time the download may take several minutes (depending on the speed of your Internet connection), but then only changes in the container are loaded, so everything happens much faster. Note:

when the application starts for the first time (and you use BME680, not Sense HAT), the sensor performs a 'burn-in' for about five minutes. During this period, the readings will not be taken and inserted into the database. The application will record the countdown, which will be displayed in the balenaCloud panel:

When the countdown reaches zero, you will see the message 'Starting loop ... `. After that, the readings will be taken and inserted into the database every 10 seconds.
I hope you have flashed the device, connected to the network and started without any problems. One of the great benefits of using a free balenaCloud account is the feature
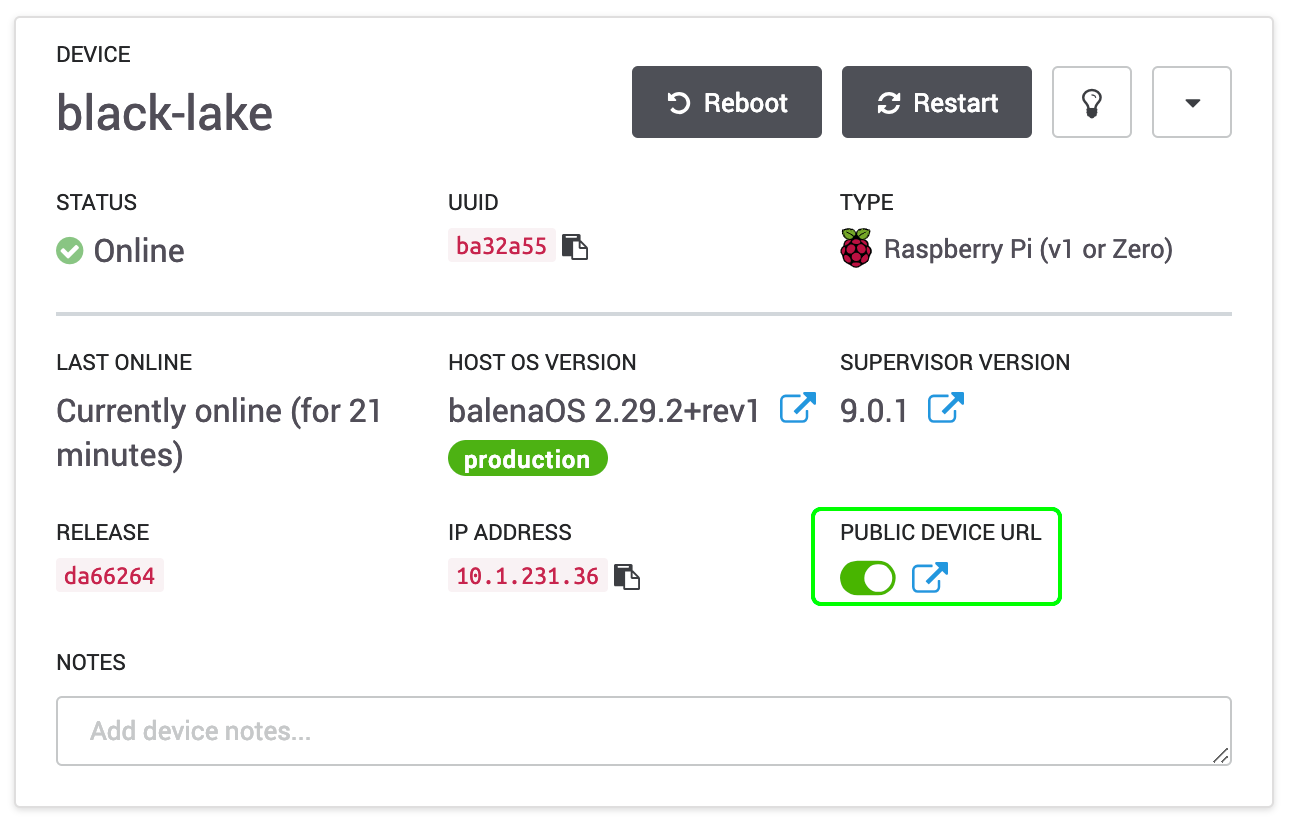
Activate this switch and click the blue arrow icon to access the dashboard. You can share this link or bookmark it on your phone or other device. While the balenaSense device is connected and working, you can look at the dashboard from anywhere!
If you do not want to enable public access, you can still view the dashboard from your own local network by IP address, as can be seen in the screenshot above. Yours will be different, but just enter in the browser
If you want to enter Grafana and play around with the settings, then the default credentials are
This project has three main components, three services. These names are on the balenaCloud dashboard:
Bosch's BME680 sensor detects temperature, humidity, pressure, and gas resistance. Temperature, humidity and pressure sensors work right out of the box, but gas resistance readings alone are not very useful. These are indicators of changes in air composition. When the sensor starts, it sets the basis, and then monitors the changes. Indicative indicators of air quality are given in percent and take into account the influence of humidity and gas resistance.
If you use the Sense HAT, where there is no gas resistance sensor, we approximate the air quality readings based on the target temperature and humidity values.
I hope that now you have completely launched the project, gained access to the dashboard, took readings and started filling out your database. Mention some more important things.
If you open the device for public access, it is recommended to change the password for Grafana.

We set up the system with a default username and password
The Grafana program for the dashboard and reports has a lot of configuration parameters and settings. We have created a basic panel that shows a chart and graph for each of the four metering options.

You can customize each Grafana panel by hovering over the title and moving on to editing. I recommend playing around with the settings - the changes in the dashboard are not saved automatically, so if you make a mistake, just reload the page, and everything will return to its original form. If you want to save the changes, click Save at the top of the control panel, and all settings will be saved on your device.
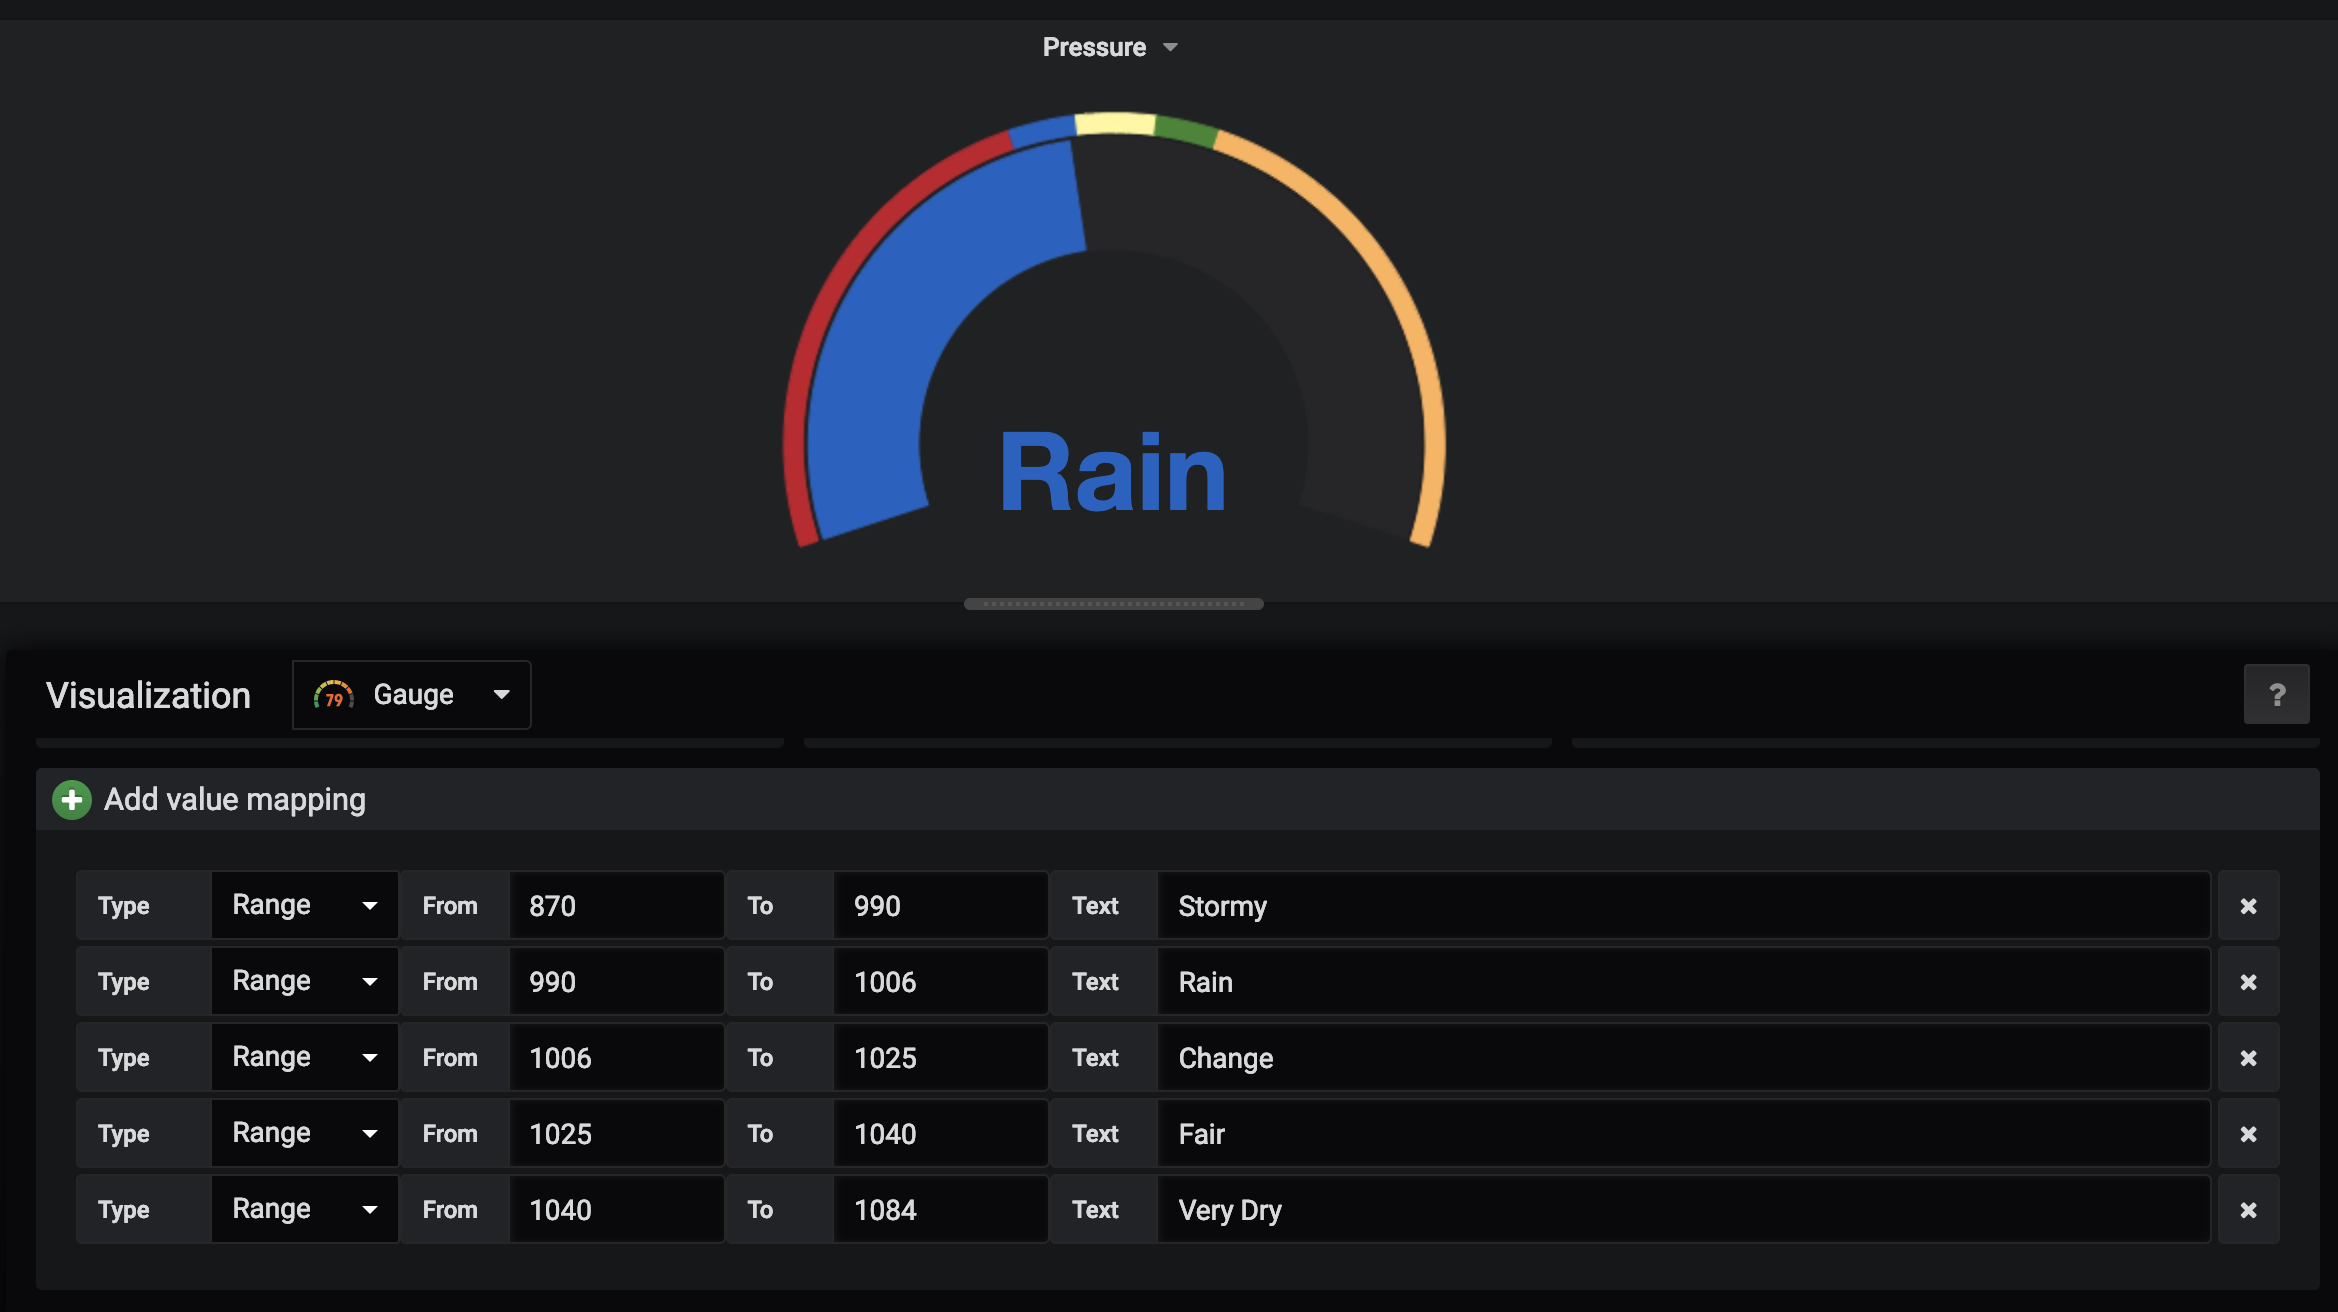
You can also configure the sensors. For example, on the pressure gauge diagram, we set up several basic ranges and text values instead of numbers. All this changes to your taste!
Such sensors are ideal for placement in a meteorological booth , which protects the sensors from sunlight and radiated heat. If you control the environment in the room, this is not so important, but if the sensor is installed outdoors, its positioning and protection are important to obtain accurate readings.
Weather booths are on sale , but they can be quite expensive, so consider DIY options .
Thingiverse has several BME680 buildings and weather booths .
Thank you for reading! If you decide to build your own meteorological station with air quality control - tell us how everything went, what problems arose. Ideas for the development of our project can be expressed on the forums .
Content
- Introduction
- Necessary equipment
- Software
- Equipment assembly
- Configure Raspberry Pi
- Software Deployment
- View dashboard
- How it works?
- What's next?
- Last thoughts
Introduction
To control the quality of the air and the weather station, many wires and various sensors are required, but the situation became easier after the appearance of sensors that combine all the readings on a good small board, which is easy to start with.
Consider monitoring temperature, humidity, barometric pressure and air quality using an all-in-one sensor that connects directly to the Raspberry Pi without additional components. You do not need any experience in electronics, but a soldering iron would be welcome (although it is also optional). This project implements a database for storing historical readings along with a graphical interface to view current readings and immediately see trends.
Necessary equipment
Here is what you need to buy for this project. Depending on whether you want to use a soldering iron or not, we choose a sensor board: some work right away, others require a little soldering.
I do not want to solder
If you do not want to solder, you will need:
- Raspberry Pi Zero WH (2Bv1.2 / 3B / 3B + / 3A + also fit)
- Micro-SD card 8 GB (or more), we recommend Sandisk Extreme Pro SD cards
- Power supply and cable
- Pimoroni BME680 Transition Board Sensor
- Pimoroni Breakout Garden pHAT
I want to solder - give me!
If you are happy to pick up a soldering iron, then you will need:
- Raspberry Pi Zero W (2Bv1.2 / 3B / 3B + / 3A + also fit)
- Micro-SD card 8 GB (or more), we recommend Sandisk Extreme Pro SD cards
- Power supply and cable
- Bosch BME680 sensor with riser (see alternatives below)
- Connection cable
Other sensors
If you already have some kind of sensor, this project supports Sense HAT with an additional bonus: a smiley on the LED matrix (depending on air quality, of course)!
Bosch BME680 with riser can be ordered from different suppliers at different prices.
- Pimoroni BME680 £ 18.50 (there may be a version without soldering with their pHAT )
- Adafruit BME680 US $ 22.50
- Sparkfun SparkX BME680 US $ 19.95 (there may be a version without soldering with their pHAT )
- Nameless BME680 US $ 9.92
Note . In the article we use Pimoroni: this board has the additional advantage that the contacts are broken in the correct order for the Raspberry Pi GPIO. When using other cards, you must verify that the power, ground, and I2C bus pins (SDA and SCL) match, as explained later in the manual.
Software
We opened the balena-sense project on GitHub , which contains all the software, configuration and code that you need for a working system. We are going to deploy this project on a free balenaCloud account to distribute all the software for the Raspberry Pi, as well as provide remote access. Therefore, you will need:
- SD flash card writer tool like balenaEtcher
- Free balenaCloud account
- Clone or download our project from GitHub
Equipment assembly
There is little work on the hardware front of this project. Our goal is to connect the sensor board to the GPIO pin on the Raspberry Pi.
The BME680 communicates with the Raspberry Pi via a bus called I2C (eye-squared-see), which is a serial bus with two wires. These two wires are called the synchronization line (SCK) and the data line (SDA). In addition to the two wires, it is necessary to supply power to the sensor (3.3V or 3V3) and ground it.
If you choose the option without soldering from Pimoroni or Sparkfun or using the Sense HAT, just connect the shiny new components to the Raspberry Pi and all the connections will be made for you: proceed to the next step!
If you decide to connect the sensor directly to the Raspberry Pi using Pimoroni or another riser, the main thing is to ensure the correct connection of the contacts described above (SDA, SCK, 3V3 and GND).
A useful site for working with GPIO on Raspberry Pi is pinout.xyz ; it clearly shows that we need pins 1 (3V3 power), 3 (SDA), 5 (SCL) and 9 (ground). A 40-pin GPIO is standard on Pi 2 and later. If you use a Pimoroni board, then the contacts are in the correct order to connect the boards. Notice how the inscription on the board matches the pinout diagram above.
But if you connect the sensor in this way, then the heat from the Raspberry Pi processor will affect the readings. To collect more accurate readings, you need to remove the sensor from the board: we do this with DuPont mother-to-mother (or Jumper Jerky ) cables , as shown below:
Similarly, if you use another sensor, where the pinout diagrams do not match exactly, you can connect these boards to the Pi using the same method. The main thing is to ensure compliance with 3V3, SDA, SCL and GND. If the board has contacts for SDI, SDO, CS - you can ignore them, because they are used for an alternative SPI interface, which we do not use in this project.
In the above photos, we have the Raspberry Pi 3A +, but Pi Zero is also suitable as a cheaper solution.
Configure Raspberry Pi
We are going to flash the SD card with the balenaOS operating system, attach to the balenaCloud cloud, add our device there and configure the project so that it can be easily updated later.
First you need to set up a balenaCloud account. This means registering, adding an application, and adding a device.
Step 1. Sign up for balenaCloud
If you already have a GitHub or Google account, you can use it to log in without going through the registration process .
Step 2. Creating the application
Add the application by selecting the correct device type and
Starteras the application type, then press Create New Application. This type supports all microservices and is free up to ten devices. Next, you will be taken to the dashboard for the newly created application, where you can go to the next step and add the device. You can give the application an arbitrary name, but you will need it later in the manual when we write the code.
Step 3. Add the device and boot the OS
After creating the application, you can add a device to this application by clicking the green Add Device button . When adding a device, specify the correct device type. If you are connecting to a wireless network, you can set your WiFI SSID and passphrase.
Note: Raspberry Pi 3 is indicated in the animation, do not forget to select the correct type of your device!
This process creates a custom image for the application and device type, which includes network settings, if specified.
Note: for starters, it is better to choose a dev image to conduct some tests and troubleshoot. For more information on the differences between development and production images, see here .. If you are sure that you can begin to deploy a production image right now - please.
Step 4. Record SD card and boot device
When the OS image is loaded, it's time to flash the SD card. You can use balenaEtcher for this .
After the process is complete, insert the SD card into the Raspberry Pi and connect the power source.
When the device boots for the first time, it connects to the balenaCloud dashboard, after which you can see it in the online list and go to the next step.
Troubleshooting: the device should appear on the panel in a few minutes. If it does not appear, something went wrong. The documentation has an extensive troubleshooting guide with plenty of information on why this might happen. If the documentation did not help, please contact the forums .
Software Deployment
When your Raspberry Pi is prepared, downloaded and connected to balenaCloud, you are ready to install the application code on the device.
Install balena CLI tools on a workstation
BalenaCloud allows you to remotely transfer application software / code to the Raspberry Pi and other devices. To make this possible, your workstation (not the Raspberry Pi) must meet some minimum software requirements. Note: To successfully deploy this project, you do not need to run any commands on the device itself, either through SSH or from the balenaCloud dashboard. Everything is done remotely!
If you already have (or you can configure) npm on your computer , then this is the fastest way to run CLI tools. There are also binaries for Windows, macOS and Linux . Note:If you have already installed these tools for our other projects, you can skip this part and go directly to the next step.
The documentation for the CLI tools describes the installation and configuration of the npm package, as well as the binaries.
When you have the CLI installed and running, the first step is to log into balenaCloud by running the command
balena login: When there is a working CLI that is registered in the account, you are ready to install the programs on the Raspberry Pi.
Downloading a project from GitHub
The next step is to download the code for this project from GitHub .
The blue button will load the project zip file, but if you are already familiar with Git, you can use
git cloneit in the usual way.Install on Raspberry Pi
Since the CLI and the latest code are installed, you can run this code on balenaCloud with one command. There, the Docker image is collected and configured, which will run on your device.
From the project directory after unpacking it, run the command where appName is the application name specified at the beginning of the manual. Eg . If everything is done correctly, after a few minutes the information screen of your device on the control panel should show the running services, one for each of the software components, something like this: The first time the download may take several minutes (depending on the speed of your Internet connection), but then only changes in the container are loaded, so everything happens much faster. Note:
balena push balena push balenaSensewhen the application starts for the first time (and you use BME680, not Sense HAT), the sensor performs a 'burn-in' for about five minutes. During this period, the readings will not be taken and inserted into the database. The application will record the countdown, which will be displayed in the balenaCloud panel:
When the countdown reaches zero, you will see the message 'Starting loop ... `. After that, the readings will be taken and inserted into the database every 10 seconds.
View dashboard
I hope you have flashed the device, connected to the network and started without any problems. One of the great benefits of using a free balenaCloud account is the feature
Public Device URL. Activate this switch and click the blue arrow icon to access the dashboard. You can share this link or bookmark it on your phone or other device. While the balenaSense device is connected and working, you can look at the dashboard from anywhere!
If you do not want to enable public access, you can still view the dashboard from your own local network by IP address, as can be seen in the screenshot above. Yours will be different, but just enter in the browser
http://, and you’ll still get access to the dashboard if you’re on the same network as the device. For example, to access my device, I would enter http://10.1.231.36. If you want to enter Grafana and play around with the settings, then the default credentials are
adminand admin.How it works?
This project has three main components, three services. These names are on the balenaCloud dashboard:
- InfluxDB - a database used to store sensor readings
- Sensor - Python library and code for accessing the sensor, taking readings and saving them to the database
- Grafana - used to create a dashboard with graphs and reports
Bosch's BME680 sensor detects temperature, humidity, pressure, and gas resistance. Temperature, humidity and pressure sensors work right out of the box, but gas resistance readings alone are not very useful. These are indicators of changes in air composition. When the sensor starts, it sets the basis, and then monitors the changes. Indicative indicators of air quality are given in percent and take into account the influence of humidity and gas resistance.
If you use the Sense HAT, where there is no gas resistance sensor, we approximate the air quality readings based on the target temperature and humidity values.
What's next?
I hope that now you have completely launched the project, gained access to the dashboard, took readings and started filling out your database. Mention some more important things.
Change password
If you open the device for public access, it is recommended to change the password for Grafana.
We set up the system with a default username and password
adminadmin. To change them, log in to Grafana using the button in the lower left corner of the panel. You will be prompted to change the password the first time you log in.Customization
The Grafana program for the dashboard and reports has a lot of configuration parameters and settings. We have created a basic panel that shows a chart and graph for each of the four metering options.
You can customize each Grafana panel by hovering over the title and moving on to editing. I recommend playing around with the settings - the changes in the dashboard are not saved automatically, so if you make a mistake, just reload the page, and everything will return to its original form. If you want to save the changes, click Save at the top of the control panel, and all settings will be saved on your device.
You can also configure the sensors. For example, on the pressure gauge diagram, we set up several basic ranges and text values instead of numbers. All this changes to your taste!
Housing
Such sensors are ideal for placement in a meteorological booth , which protects the sensors from sunlight and radiated heat. If you control the environment in the room, this is not so important, but if the sensor is installed outdoors, its positioning and protection are important to obtain accurate readings.
Weather booths are on sale , but they can be quite expensive, so consider DIY options .
Thingiverse has several BME680 buildings and weather booths .
Last thoughts
Thank you for reading! If you decide to build your own meteorological station with air quality control - tell us how everything went, what problems arose. Ideas for the development of our project can be expressed on the forums .