What to expect from the new Xeon E. Compare with E3 and draw conclusions
I continue to test processors. This time my attention has completely and completely switched from desktop Core to server Xeon. That, I must admit, is not accidental. Firstly, I was warmly asked about this in the comments to the previous article , and secondly, our fleet was replenished with fresh Xeon E - we decided to update the line of single-processor dedicated servers and bought E-2134 and E-2136 as an alternative to E3-12XX.
Initially, I had Napoleonic plans. Since our “collection” Xeon E3-12xyVz, where “z” takes a value from 2 to 6, covers processors from Ivy Bridge to Kaby Lake, I was interested to compare them with each other and with the new Xeon E.
But having estimated the amount of work ahead, I decided to lower the degree of ambitiousness and leave only the two previous families from the representatives of Xeon E3: Xeon E3-12xxV5 and Xeon E3-12xxV6. Together with the new Xeon E, all three families are actually built on the same architecture, one technological process and, thanks to Intel, one processor socket FCLGA1151.
Moreover! Processors from the two previous families turned out to be available, intersecting in the base frequency and the frequency in the “boost”, which, in my opinion, is a great success :) In the comments to the previous article, a request was made by readers to compare different families on the same frequency in order to see a clean growth of microarchitectural changes. The idea seemed interesting to me and maybe someday I will return to Core to bring it to life. In the meantime, I decided to adapt to what is at hand and see how Xeon behaves with the same frequencies.
Testing
Eight processors from three families participate in testing:
Skylake - Intel E3-1230v5, E3-1240v5, E3-1270v5,
Kaby Lake - E3-1230v6, E3-1240v6, E3-1270v6,
Coffee Lake - E-2134 and E-2136 .
The performance characteristics of the platforms
Servers with Intel E3-1230v5, E3-1240v5, E3-1270v5, E3-1230v6, E3-1240v6 and E3-1270v6 processors have the same basic configuration:
- Motherboard: Supermicro X11SSE-F (2.2 BIOS).
- RAM: 16 GB Micron Technology (DDR4-2666) ECC - 2 pieces.
- SSD: Intel DC S4500 480 GB - 2 pieces in RAID1.
Servers with Intel E-2134 and E-2136 processors also work on the same platform:
- Motherboard: Supermicro X11SCE-F (BIOS 1.0a).
- RAM: 16 GB Micron Technology (DDR4-2666) ECC - 2 pieces.
- SSD: Intel DC S4500 480 GB - 2 pieces in RAID1.
Software part: OS CentOS Linux 7 x86_64 (7.6.1810)
Kernel: 3.10.0-957.5.1.el7.x86_64
Introduced optimizations relative to the standard installation: added kernel launch options elevator = noop selinux = 0.
Testing is performed with all patches from the Specter, Meltdown and Foreshadow vulnerabilities backported to this kernel.
Tests used for research:
- Sysbench
- Geekbench
- Phoronix Test Suite
A more detailed description of the tests can be found in the previous article . He took the same kit plus Timed GCC Compilation, which he added at the request of readers. In the meantime, briefly about what and what measured.
Sysbench
Test The test is multithreaded, in all cores. I measured one indicator - CPU speed events per second, which means the number of operations performed by the processor per second - the higher the value, the more efficient the system.
Geekbench Test
Measured two main indicators based on the results of several tests: Single-Core Score and Multi-Core Score, - single and multi-threaded tests. Units of measure are abstract "parrots". The more parrots, the better.
Phoronix Test Suite
I took only 10 from a large set - the same as last time - and to them, as I said above, added Timed GCC Compilation. The result was 8 multi-threaded tests and 2 single-threaded (Himeno and LAME MP3 Encoding).
In these tests, the higher the score, the better
- John the Ripper passwords test. Take the Blowfish crypto algorithm.
- The Himeno Test is a linear Poisson pressure solver using the Jacobi point method.
- 7-Zip Compression - 7-Zip test using p7zip with integrated performance testing function.
- OpenSSL is a set of tools that implement the SSL (Secure Sockets Layer) and TLS (Transport Layer Security) protocols. Measures the performance of RSA 4096-bit OpenSSL.
- Apache Benchmark - measures how many requests per second this system can withstand while executing 1,000,000 requests, while 100 requests are executed simultaneously. Units - queries per second.
And in these if less, it’s better - in all tests the time it takes to measure is measured.
- C-Ray tests CPU performance on floating point calculations. This is a multi-threaded test (16 threads per core).
- Parallel BZIP2 Compression - measures file compression time (.tar package of the Linux kernel source code) using BZIP2 compression.
- The LAME MP3 Encoding test is performed in a single stream.
- The ffmpeg x264 test is multi-threaded.
- Timed GCC Compilation. In my first article in the comments, readers asked me to add a test related to compilation from source. This test is for you :-) It shows how long it takes to build the GNU GCC compiler (version 8.2.0). Units are seconds.
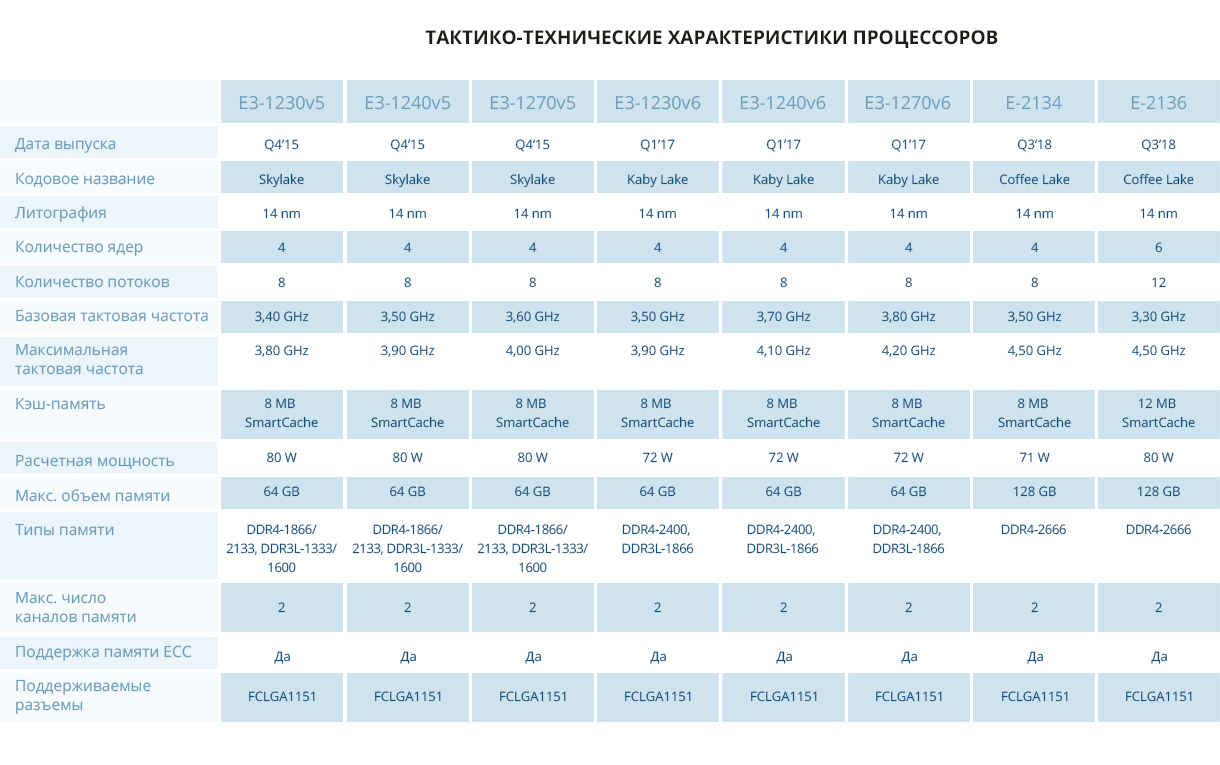
So, I gathered on one test bench representatives of three families - Skylake, Kaby Lake and Coffee Lake. All processors, except the new E-2136, have four cores and eight threads in HT, as well as the same total cache size. All processors have dual-channel memory with ECC support and close base frequencies. As in the previous article, I draw attention to the fact that the processors of three different families are built on the same architecture. Accordingly, “frequencies, cores and threads should rule the ball”.
But this time it will be even more interesting: all these families have different supported frequencies when working with RAM - 2133, 2400 and 2666, respectively, as well as a different heat pack. It is interesting to see how this will affect the test results and whether it will affect at all. Of course, I suppose that the higher the frequency of working with RAM, the better the processor will pass the tests.
Of particular interest are the E3-1240v5 and E3-1230v6 with the same frequencies: the base 3.50 GHz and 3.90 GHz in Turbobust. I suppose that they should show identical or close results, since they differ only in the heat packet and memory frequency.
As for my predictions regarding Xeon E, I think that the results of single-threaded tests of E-2134 and E-2136 should also be the same or very close in performance - although the base frequency is different, but the frequencies in the “boost” are the same. And of course, the results of both Xeon Es, I’m sure, will be better than their predecessors: 4.5 GHz at maximum speeds and 6 cores on the E-2136 will definitely show themselves. And now we’ll see how right I am.
Test results
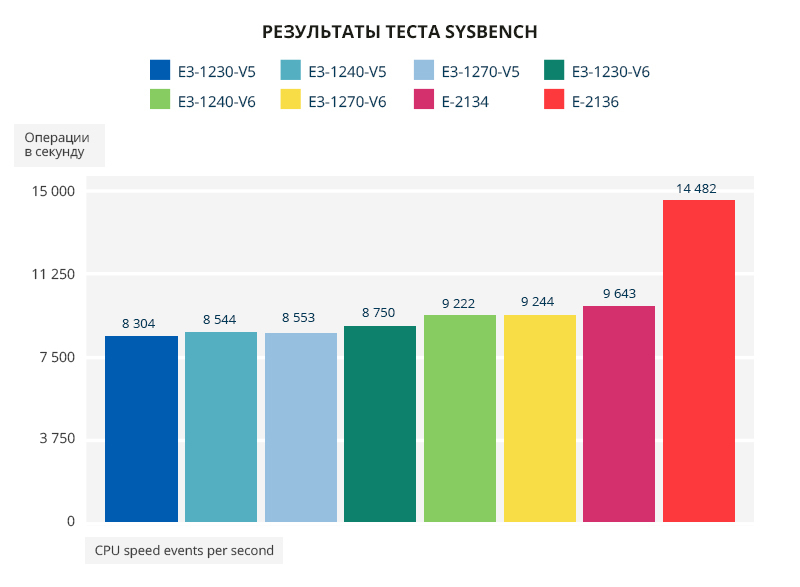
In the Sysbench test, the E3-1240v5 and E3-1270v5 are on par. With E3-1230v6, growth begins, which ends with a sharp take-off of the E-2136. E-2136 is 36% better in this test than E3-1270v6, and 43% better than E3-1230v5. E-2134 is only 4% ahead of E3-1270v6 and 14% E3-1230v5. The difference between E3-1240v5 and E3-1230v6 is 2.4% in favor of E3-1230v6.
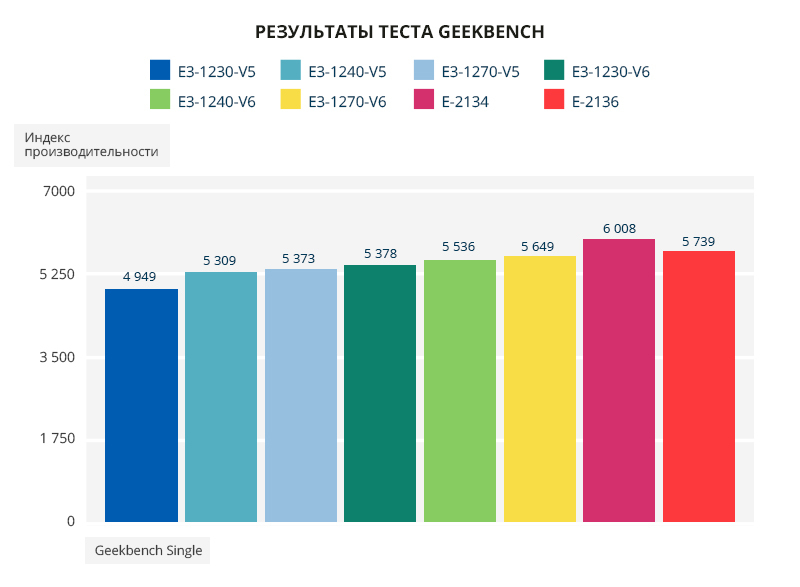
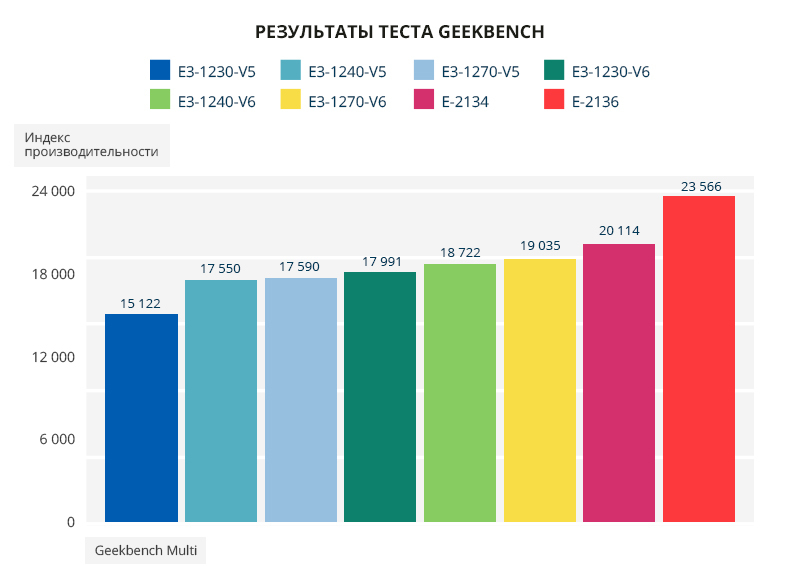
In the Geekbench single-threaded test, growth is observed within each family, with the exception of the Xeon E family: E-2134 overtakes E-2136 by 4.5%.
In the multi-threaded test, the growth trend persists in all three families: E-2136 is 14.6% ahead of E-2134. In the single-threaded test, the E3-1240v5, E3-1270v5 and E3-1230v6 are on par, and in the multi-threaded E3-1230v6 overtakes E3-1240v5 by 2.5%.
Links to Geekbench test results:
Xeon E3-1230v5
Xeon E3-1240v5
Xeon E3-1270v5
Xeon E3-1230v6
Xeon E3-1240v6
Xeon E3-1270v6
Xeon E-2134
Xeon E-2136

The multi-threaded John The Ripper results are very similar to the Sysbench test results: E3-1240v5, E3-1270v5 and E3-1230v6 give almost the same performance and the E-2136 is 33% faster than the E-2134. Stable growth is clearly visible in terms of E3-1240v6, E3-1270v6 and the transition to the next generation - E-2134.
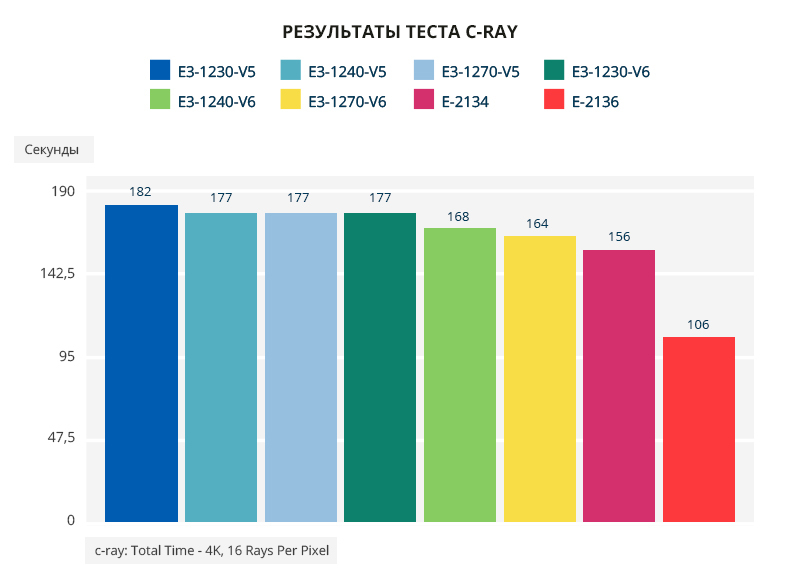
In the C-ray test, the highest result is E-2136, the lowest is E3-1230v5, which is quite logical chronologically. Second place in the new E-2134. But E3-1240v5, E3-1270v5 and E3-1230v6 are again on par.
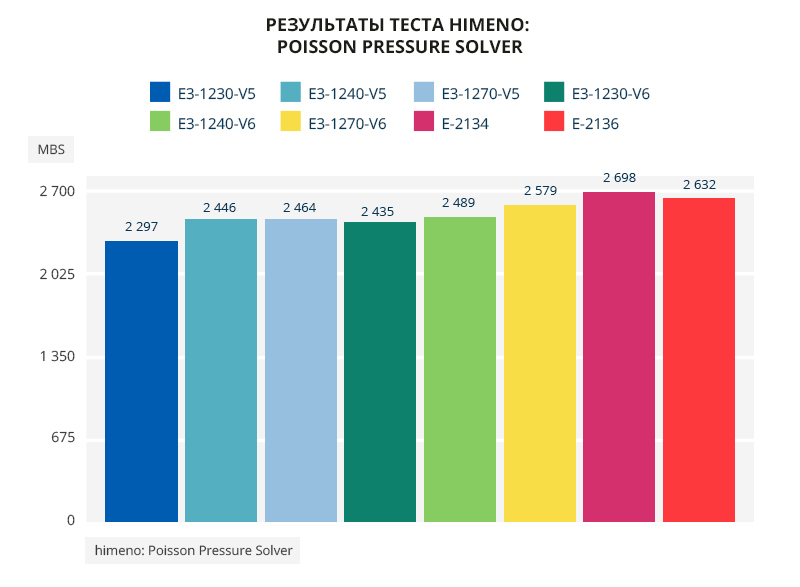
The single-threaded Himeno test almost exactly repeats the results of the single-threaded Geekbench test: there is growth within each family, with the exception of the Xeon E: E-2134 overtakes E-2136 by 2.4%. The difference between E3-1240v5, E3-1270v5 and E3-1230v6 at the level of error.

In the 7zip test we observe a beautiful “ladder” and growth in all families. The difference between E3-1240v5, E3-1270v5 at the level of error. E3-1230v6 is almost 4% better at this test than E3-1240v5. E-2134 is 21% ahead of E3-1230v5, 16% ahead of E3-1270v5 and 6.6% ahead of E3-1270v6. And the E-2136 is the best :-)
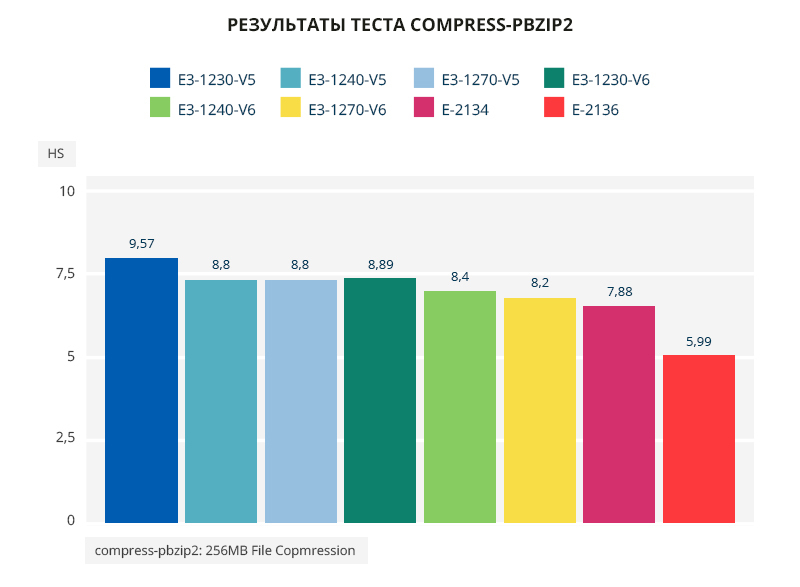
A similar trend is observed in the pbzip2 test, only E3-1230v6 is knocked out.
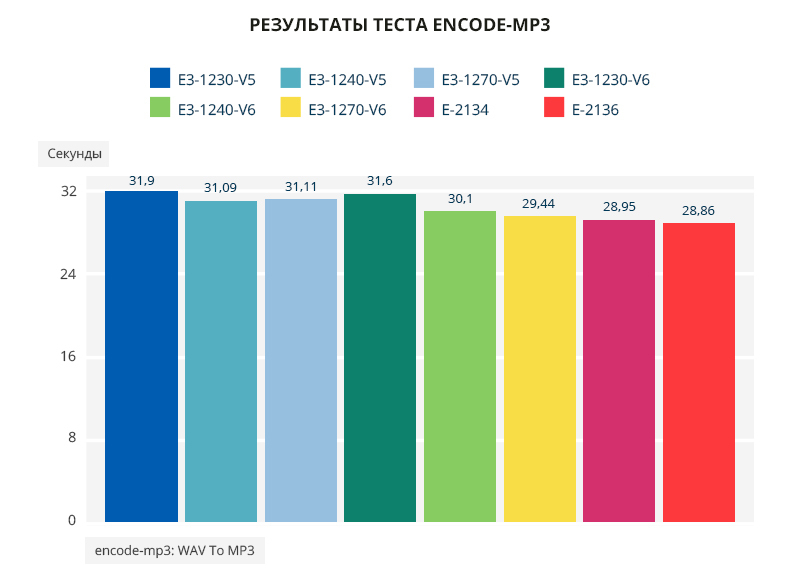
I would like to say that the mp3 test shows a uniform “ladder down”, but the difference even between the extremes in the E3-1230v5 and E-2136 graphs is only 9.5%, so calling it a “ladder” is not very correct. Moreover, the E3-1230v6 makes its own adjustments, and the E3-1240v5 and E3-1270v5 only add a flatness graphics.
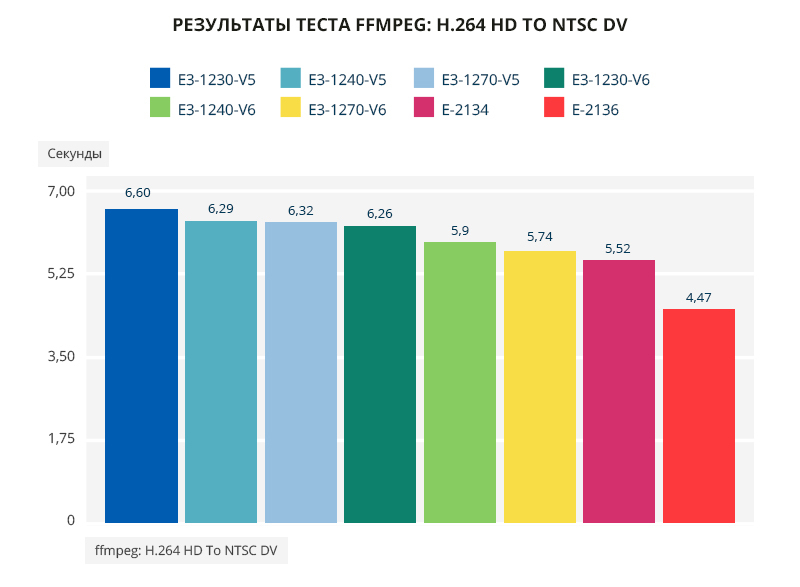
In the ffmpeg multithreaded test, the “staircase down” is already without bursts and with an almost flat area in the areas of E3-1240v5, E3-1270v5 and E3-1230v6. E-2136 in this test is better than E-2134 by 19%, E3-1230v5 by 32%, E3-1270v5 by 29% and E3-1270v6 by 22%.
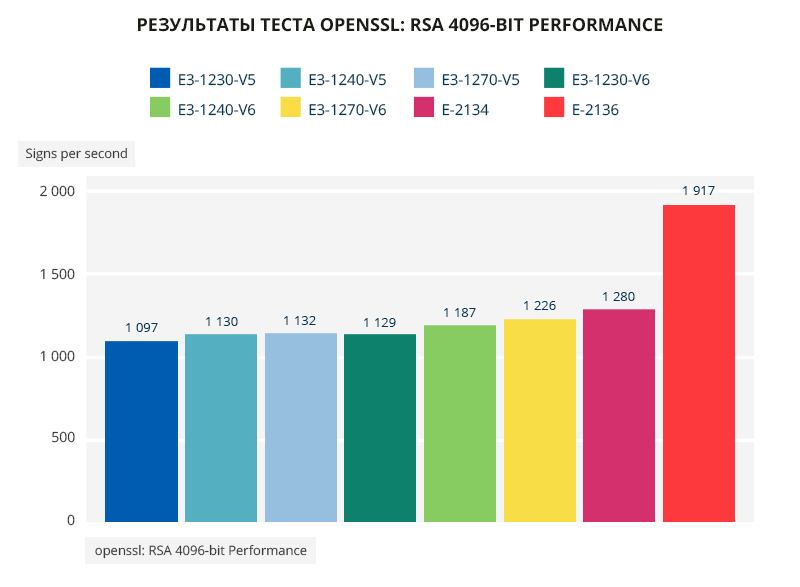
The OpenSSL test shows a “ladder up” with a platform on the E3-1240v5, E3-1270v5, E3-1230v6 and a noticeable margin on the E-2136. E-2134 is 14% better than E3-1230v5.
E-2136 is 43% ahead of E3-1230v5, 36% ahead of E3-1270v6 and 33% ahead of E-2134.
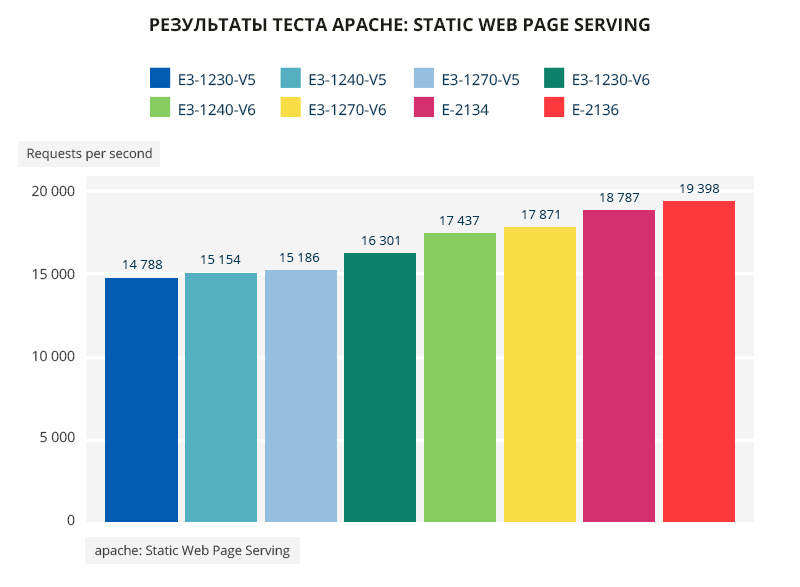
In the Apache test, the difference between the processors of the V5 family is minimal. In the V6 family, the “staircase is up”: E3-1270v6 is 8.8% better than E3-1230v6. The Xeon E family continues the growth trend and adds “steps”: the E-2136 is 3% ahead of the E-2134, 8% ahead of the E3-1270v6 and 22% ahead of the E3-1270v5. The difference between the first representative of V5 and the new E-2136 is 24%. E3-1240v5 and E3-1270v5 at the level of error. A noticeable jump in the transition from the V5 to V6 family: the difference between E3-1230v6 and E3-1240v5 is 7%.
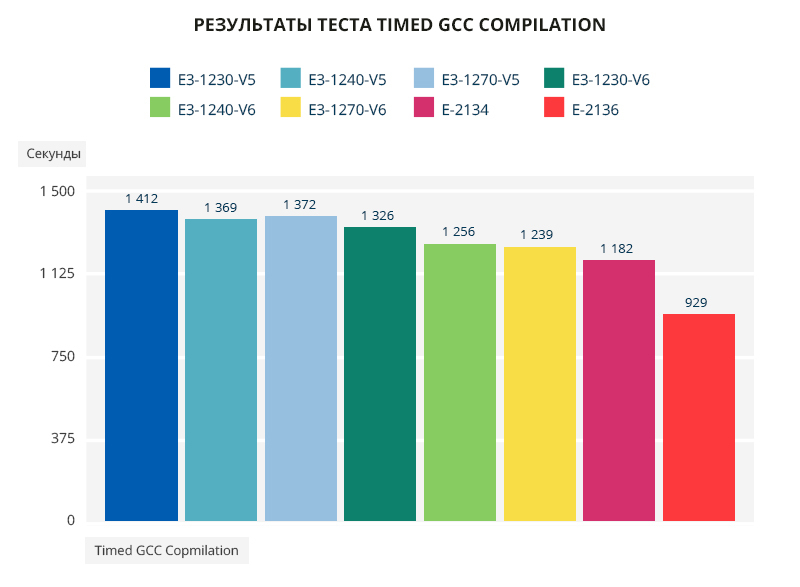
In the GCC compilation time test, E3-1230v5 ranks last, the penultimate place is divided between E3-1240v5 and E3-1270v5. The victory remains for the six-core E-2136.

If in a previous article where I tested Core, I wrote that I was not surprised by the results - they were predictable, then this time I was not surprised :-)
But first, a little background.
I must say that I had to redo all the tests for E3-1230v6. And all because the first time I made a mistake - a representative from the V6 family passed a test site with RAM in single-channel mode. As a result, the nested index in the Geekbench test - Memory Score, turned out to be lower than that of E3-1240v5, which greatly influenced the overall result of the whole test. E3-1240v5 in terms of performance significantly overtook E3-1230v6.
A similar picture was drawn in all single-threaded tests. He wrinkled his brain for a long time to give at least some intelligible explanation of the situation (and even found it!), Until he rubbed his eyes and redid all the tests, but with two-channel memory. And now to the conclusions.
Expectations vs reality.
The first thing I expected to see was the same performance for E3-1240v5 and E3-1230v6. And saw. In all tests except mp3 and pbzip2, E3-1230v6 is better or equal to E3-1240v5. Personally, I do not think that this is a net increase in microarchitecture. Most likely, this result is obtained due to the higher clock speed of RAM. One thing I can say for sure: memory in one channel significantly affects the results in tests, so be careful :)
My second hypothesis concerned two representatives of the V5 family - E3-1240v5 and E3-1270v5. Honestly, I was hoping to find at least a slight difference between them, but as a result of testing, it turned out to be none of the word at all. The effect of an additional 100 MHz has to be looked under a microscope in the vast majority of tests.
At the same time, the same 100 MHz are quite visible to the naked eye when comparing E3-1270v5 and E3-1240v6. I suppose, again, the memory frequencies are affected.
We turn to the fresh Xeon E. I was completely unprepared for the fact that in single-threaded tests the E-2136 would be inferior to the E-2134. Although the base frequency of the older model is lower by 200 MHz, but the frequency in the boost is the same. I repeated each test several times with each processor to get the result I expected, but I couldn’t achieve it :) I really don’t like to draw conclusions and conclusions, so I would love to know the opinions of dear readers: what can be associated with such unusual results?
This is where the expectations coincided with reality, so when comparing the new Xeon E family with its predecessors, there are predictions that the new E will bypass the good old E3 just confirmed by tests. And if the quad-core E-2134 does this due to the higher frequency in the boost, then the E-2136 breaks even more due to its honest six cores.
In general, the picture is as follows. The new Xeon E can really be seen as a good alternative to the E3 family. Moreover, they cost almost as much as the V6 - higher performance for the same money. If you are looking for a more budget option, then you can safely choose from the three E3-1240v5 , E3-1270v5 and E3-1230v6 . According to the test results, they turned out to be completely interchangeable.
In testing, we used servers based on Intel Xeon processors E3-1230v5, E3-1240v5, E3-1270v5, E3-1230v6, E3-1240v6, E3-1270v6, E-2134 and E-2136 with 1dedic.ru .
Until May 1, servers with the new Xeon E can be ordered at a 25% discount for 1 month using the XEONE_HABR promotional code . The promotional code will burn at midnight on April 30, 2019.
For any dedicated server, a 10% discount when paying for the year.
Tested and written for you by Trashwind , the system administrator of FirstDEDIC.