Windows calculator will get graphical mode
Not so long ago, a news was published on Habré about the disclosure of the code for Windows Calculator , one of the most famous programs in the world. The source code for this software is available on GitHub .
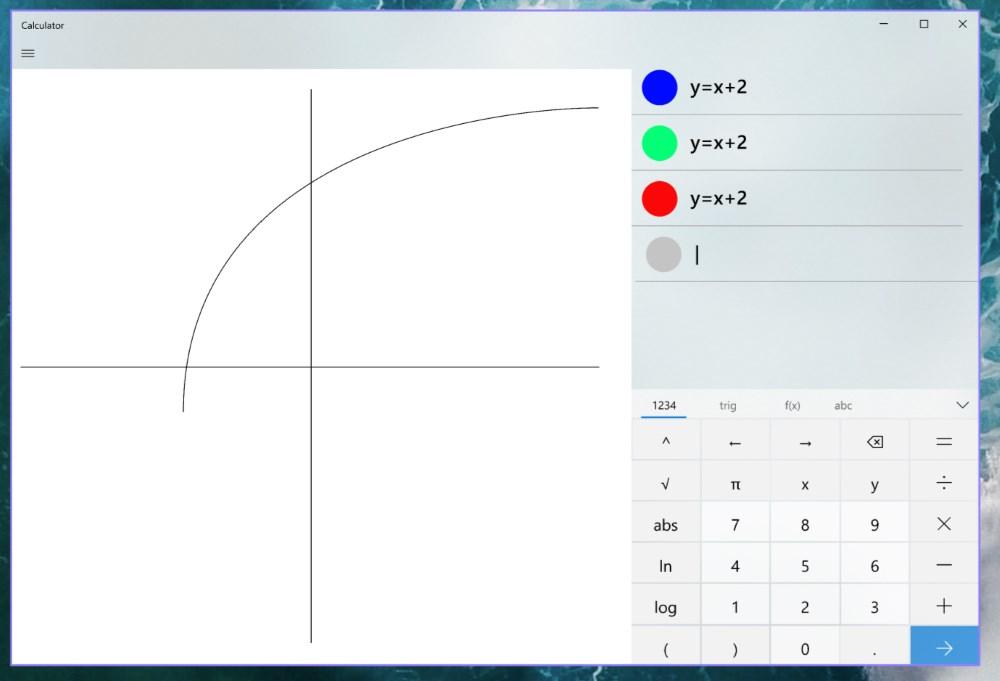
Then it was said that the developers of the program offer everyone to contribute their wishes and ideas regarding the functionality of the program. Out of a large number, one is currently selected. Her author suggests adding a graphical mode to the calculator .
Actually, everything is clear here - the graphical mode will make it possible to visualize equations and functions, approximately the same as the Plotting Mode in Matlab. The feature was proposed by Microsoft engineer Dave Grochocki. According to him, the graphics mode will not be too advanced. It will allow students to plot graphs using algebraic equations.
“Algebra is the path to the higher realms of mathematics and related disciplines. Nevertheless, this is one of the most difficult subjects for students, many get bad grades in algebra, ”says Grochoski. The developer believes that if you add a graphical mode to the calculator, it will become easier for students and teachers to understand each other in the classroom.
“Graphing calculators can be very expensive, software solutions require licensing, online services are not always the best solution,” Grochoski continues.
According to Microsoft representatives, it is the graphic mode that is one of the most frequently requested features in the Feedback Hub application, where users of corporation software products reset their offers.
The goals that the developers set themselves:
- Providing basic visualization in Windows Calculator;
- Support for basic math curricula in the USA (unfortunately, while the functionality of the Calculator will be planned based on the needs of students in this country), including the ability to build and interpret functions, understand linear, quadratic and exponential models, study trigonometric functions with a calculator and understand the concept equations.
What else will the user get:- The ability to enter an equation to build the appropriate graph.
- The ability to add several equations and visualize them to compare graphs with each other.
- The equation editing mode so that you can see what changes when certain modifications are made to the original equation.
- Changing the viewing mode of charts - different sections can be viewed to varying degrees of detail (i.e. we are talking about scaling).
- The ability to study various types of graphs.
- The ability to export the result - now you can share visualizations of functions in Office / Teams.
- Users can easily manipulate secondary variables in equations, which will provide an opportunity to understand how changes in equations affect the graph.
As far as one can judge, graphics can be built for not very complex functions.
Now the developers of the Calculator are trying to show that the program is improving over time. She was born as an elementary assistant for performing arithmetic operations. Now it is a reliable scientific calculator that can be used by a wide range of users to solve very serious problems. In the future, the software will improve further.
As for the opening of the source code, this is done so that anyone can get acquainted with such Microsoft technologies as Fluent, Universal Windows Platform, Azure Pipelines and others. Thanks to this project, developers can learn more about how the work is done to create certain projects in Microsoft. A detailed analysis of the source code of the Windows Calculator can be found here, right on the Habr .
The program is written in C ++ and contains more than 35,000 lines of code. To compile the project, users need Windows 10 1803 (or newer) and the latest version of Visual Studio. All requirements are available on GitHub.