Simplest memory profiling on STM32 and other microcontrollers
“A standard, scientific approach to calculating the correct stack size comes with experience: take a random number and hope for the best”
- Jack Ganssle, “The Art of Designing Embedded Systems”
Hello, Habr!
Strange as it may seem, in the vast majority of “STM32 primers” I have seen in particular and microcontrollers in general, there is generally nothing about such a thing as memory allocation, stack placement and, most importantly, preventing memory overflow - as a result of which one area frays another and everything collapses, usually with enchanting effects.
This is partly due to the simplicity of training projects carried out on debug boards with relatively greasy microcontrollers, where it is difficult to fly into a memory shortage by blinking an LED - however, recently, even for beginner amateurs, references to, for example, STM32F030F4P6 type controllers are more and more common. , easy to install, worth a penny, but also with a memory unit of kilobytes.
Such controllers allow you to do quite serious things for yourself (well, here, for example, such a completely suitable measurement was made for us on STM32F042K6T6 with 6 KB of RAM, from which a little more than 100 bytes remain free), but when dealing with memory, you need a certain amount of memory accuracy.
I want to talk about this accuracy. The article will be short, professionals will not learn anything new - but for beginners this knowledge is highly recommended.
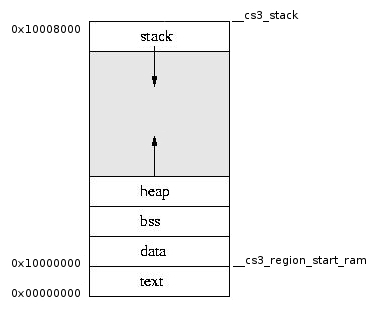
In a typical project on a microcontroller based on a Cortex-M core, RAM has a conditional division into four sections:
The noinit area can also occasionally occur (uninitialized variables - they are convenient in that they retain the value between reboots), even less often, some other areas allocated for specific tasks.
They are located in physical memory in a rather specific way - the fact is that the stack in microcontrollers on ARM cores grows from top to bottom. Therefore, it is located separately from the remaining memory blocks, at the end of RAM:
By default, its address is usually equal to the latest RAM address, and from there it goes down as it grows, and from this one extremely unpleasant feature of the stack grows: it can reach bss and rewrite its top, and in no way will you know about it.
All memory is divided into two categories - statically allocated, i.e. memory, the total amount of which is obvious from the text of the program and does not depend on the order of its execution, and dynamically allocated, the required volume of which depends on the progress of the program.
The latter includes a heap (from which we take chunks using malloc and return using free) and a stack that grows and shrinks by itself.
Generally speaking, using malloc on microcontrollers is highly discouraged unless you know exactly what you are doing. The main problem they bring is memory fragmentation - if you allocate 10 pieces of 10 bytes, and then free every second, then you will not get free 50 bytes. You will get 5 free pieces of 10 bytes each.
In addition, at the stage of compiling the program, the compiler will not be able to automatically determine how much memory your malloc will require (especially taking into account fragmentation, which depends not only on the size of the requested pieces, but on the sequence of their allocation and release), and therefore will not be able to warn you if in the end there is not enough memory.
There are methods to work around this problem - special malloc implementations that work within a statically allocated area, and not the entire RAM, careful use of malloc taking into account possible fragmentation at the program logic level, etc. - but in general malloc is better not to touch .
All memory areas with boundaries and addresses are registered in a file with the .LD extension, which the linker is oriented on when building the project.
So, from the statically allocated memory, we have two areas - bss and data, which differ only formally. When the system is initialized, the data block is copied from the flash, where the necessary initialization values are stored for it, the bss block is simply filled with zeros (at least filling it with zeros is considered a good form).
Both things - copying from a flash and filling with zeros - are done in the program code in an explicit form , but not in your main (), but in a separate file that is executed first, it is written once and simply dragged from project to project.
However, this is not what interests us now - but how we will understand whether our data even fits into the RAM of our controller.
It is recognized very simply - by the arm-none-eabi-size utility with a single parameter - the compiled ELF file of our program (often its invocation is inserted at the end of the Makefile, because it is convenient):

Here text is the amount of program data lying in the flash, and bss and data are our statically allocated areas in RAM. The last two columns do not bother us - this is the sum of the first three, it has no practical meaning.
Total, statically in RAM we need bss + data bytes, in this case - 5324 bytes. The controller has 6144 bytes of RAM, we do not use malloc, 820 bytes remain.
Which should be enough for us on the stack.
But enough? Because if not, our stack will grow to our own data, and then first it will overwrite the data, then the data will overwrite it, and then everything will crash. Moreover, between the first and second points, the program can continue to work without realizing that there is garbage in the data it processes. In the worst case, it will be the data that you wrote down when everything was in order with the stack, and now you just read — for example, the calibration parameters of some sensor — and then you don’t have any obvious way to understand that everything’s bad with them, This program will continue to run, as if nothing had happened, giving you garbage at the output.
And here the most interesting part begins - if you reduce the tale to one phrase, then it is almost impossible to determine the size of the stack in advance .
Purely theoretically , you can ask the compiler will give you the size of the stack used by each individual feature, then ask him to give the tree your program, and for each branch in it to calculate the amount of stacks of all those present in the function tree. This alone for any more or less complex program will take you a considerable amount of time.
Then you remember that at any moment an interruption may occur, the processor of which also needs memory.
Then - that two or three nested interrupts can happen, the handlers of which ...
In general, you understand. Trying to count the stack for a specific program is an exciting and generally useful activity, but often you will not do it.
Therefore, in practice, one technique is used that allows you to at least somehow understand whether everything in our life develops well - the so-called “memory painting” (memory painting).
What is convenient in this method is that it does not depend on the debugging tools you use, and if the system has at least some means of outputting information, you can do without debugging tools at all.
Its essence is that we fill the entire array from the end of bss to the beginning of the stack somewhere at the very early stage of program execution, when the stack is still exactly small, with the same value.
Further, checking at which address this value has already disappeared, we understand where the stack went down. Since once the erased color itself will not be restored, the check can be done sporadically - it will show the maximum stack size reached.
Define the color of the paint - the specific value does not matter, below I just tapped with two fingers of my left hand. The main thing is not to choose 0 and FF:
At the very very beginning of the program, right in the startup file, fill all the free memory with this paint:
What have we done here? The assembler insert assigned the variable top equal to the current address of the stack - so as not to accidentally wipe it; in the start variable, the address of the end of the bss block (the variable in which it is stored, I looked in the linker script * .ld - in this case, it is from the libopencm3 library). Next, we simply fill everything from the end of bss to the beginning of the stack with the same value.
After that, we can do this at any time:
Here the variable _ebss is already familiar to us, and the variable _stack is from the same linker script , in it it means the top address of the stack, that is, in this case, just the end of RAM.
This function will return the maximum fixed stack size in bytes.
The further logic is quite simple - somewhere in the body of the program we periodically call check_stack_size () and display its exhaust in the console, on the screen, or where it is convenient for us to display it, and launch the device in combat operation for a period that we consider to be quite long.
We periodically look at the size of the stack.
In this case, through various chaotic actions with the device, it can be brought up to 712 bytes - that is, from the initially available 6 Kbytes of RAM, we still have a reserve of as many as 108 bytes.
The experimental method for determining the size of the stack is simple, efficient, but not 100% reliable. There can always be a situation where a very rare set of circumstances, observed, for example, once a year, will lead to an unplanned increase in this size. However, in the general case and with well-written firmware, we can assume that you are unlikely to have something that overlaps the fixed size by more than 10-20%, so we are safe with our 108 bytes of reserve.
In most cases, this quasi-profiling, which is easily and simply performed on almost any system and regardless of the development tools used, allows you to determine the memory usage efficiency with high reliability and catch the problem with the stack in the early stages, especially when working on younger controllers with RAM size of one kilobytes.
PS In multitasking systems on RTOS, in most cases there are many stacks - in addition to the main MSP stack growing from the top edge of RAM down, there are separate PSP process stacks. Their size is clearly set by the programmer, which does not protect the process from going beyond their borders - therefore, the control methods they use are the same.
- Jack Ganssle, “The Art of Designing Embedded Systems”
Hello, Habr!
Strange as it may seem, in the vast majority of “STM32 primers” I have seen in particular and microcontrollers in general, there is generally nothing about such a thing as memory allocation, stack placement and, most importantly, preventing memory overflow - as a result of which one area frays another and everything collapses, usually with enchanting effects.
This is partly due to the simplicity of training projects carried out on debug boards with relatively greasy microcontrollers, where it is difficult to fly into a memory shortage by blinking an LED - however, recently, even for beginner amateurs, references to, for example, STM32F030F4P6 type controllers are more and more common. , easy to install, worth a penny, but also with a memory unit of kilobytes.
Such controllers allow you to do quite serious things for yourself (well, here, for example, such a completely suitable measurement was made for us on STM32F042K6T6 with 6 KB of RAM, from which a little more than 100 bytes remain free), but when dealing with memory, you need a certain amount of memory accuracy.
I want to talk about this accuracy. The article will be short, professionals will not learn anything new - but for beginners this knowledge is highly recommended.
In a typical project on a microcontroller based on a Cortex-M core, RAM has a conditional division into four sections:
- data - data initialized by a specific value
- bss - data initialized to zero
- heap - heap (dynamic area from which memory is allocated explicitly using malloc)
- stack - the stack (the dynamic region from which memory is allocated by the compiler implicitly)
The noinit area can also occasionally occur (uninitialized variables - they are convenient in that they retain the value between reboots), even less often, some other areas allocated for specific tasks.
They are located in physical memory in a rather specific way - the fact is that the stack in microcontrollers on ARM cores grows from top to bottom. Therefore, it is located separately from the remaining memory blocks, at the end of RAM:
By default, its address is usually equal to the latest RAM address, and from there it goes down as it grows, and from this one extremely unpleasant feature of the stack grows: it can reach bss and rewrite its top, and in no way will you know about it.
Static and dynamic memory areas
All memory is divided into two categories - statically allocated, i.e. memory, the total amount of which is obvious from the text of the program and does not depend on the order of its execution, and dynamically allocated, the required volume of which depends on the progress of the program.
The latter includes a heap (from which we take chunks using malloc and return using free) and a stack that grows and shrinks by itself.
Generally speaking, using malloc on microcontrollers is highly discouraged unless you know exactly what you are doing. The main problem they bring is memory fragmentation - if you allocate 10 pieces of 10 bytes, and then free every second, then you will not get free 50 bytes. You will get 5 free pieces of 10 bytes each.
In addition, at the stage of compiling the program, the compiler will not be able to automatically determine how much memory your malloc will require (especially taking into account fragmentation, which depends not only on the size of the requested pieces, but on the sequence of their allocation and release), and therefore will not be able to warn you if in the end there is not enough memory.
There are methods to work around this problem - special malloc implementations that work within a statically allocated area, and not the entire RAM, careful use of malloc taking into account possible fragmentation at the program logic level, etc. - but in general malloc is better not to touch .
All memory areas with boundaries and addresses are registered in a file with the .LD extension, which the linker is oriented on when building the project.
Statically allocated memory
So, from the statically allocated memory, we have two areas - bss and data, which differ only formally. When the system is initialized, the data block is copied from the flash, where the necessary initialization values are stored for it, the bss block is simply filled with zeros (at least filling it with zeros is considered a good form).
Both things - copying from a flash and filling with zeros - are done in the program code in an explicit form , but not in your main (), but in a separate file that is executed first, it is written once and simply dragged from project to project.
However, this is not what interests us now - but how we will understand whether our data even fits into the RAM of our controller.
It is recognized very simply - by the arm-none-eabi-size utility with a single parameter - the compiled ELF file of our program (often its invocation is inserted at the end of the Makefile, because it is convenient):
Here text is the amount of program data lying in the flash, and bss and data are our statically allocated areas in RAM. The last two columns do not bother us - this is the sum of the first three, it has no practical meaning.
Total, statically in RAM we need bss + data bytes, in this case - 5324 bytes. The controller has 6144 bytes of RAM, we do not use malloc, 820 bytes remain.
Which should be enough for us on the stack.
But enough? Because if not, our stack will grow to our own data, and then first it will overwrite the data, then the data will overwrite it, and then everything will crash. Moreover, between the first and second points, the program can continue to work without realizing that there is garbage in the data it processes. In the worst case, it will be the data that you wrote down when everything was in order with the stack, and now you just read — for example, the calibration parameters of some sensor — and then you don’t have any obvious way to understand that everything’s bad with them, This program will continue to run, as if nothing had happened, giving you garbage at the output.
Dynamically allocated memory
And here the most interesting part begins - if you reduce the tale to one phrase, then it is almost impossible to determine the size of the stack in advance .
Purely theoretically , you can ask the compiler will give you the size of the stack used by each individual feature, then ask him to give the tree your program, and for each branch in it to calculate the amount of stacks of all those present in the function tree. This alone for any more or less complex program will take you a considerable amount of time.
Then you remember that at any moment an interruption may occur, the processor of which also needs memory.
Then - that two or three nested interrupts can happen, the handlers of which ...
In general, you understand. Trying to count the stack for a specific program is an exciting and generally useful activity, but often you will not do it.
Therefore, in practice, one technique is used that allows you to at least somehow understand whether everything in our life develops well - the so-called “memory painting” (memory painting).
What is convenient in this method is that it does not depend on the debugging tools you use, and if the system has at least some means of outputting information, you can do without debugging tools at all.
Its essence is that we fill the entire array from the end of bss to the beginning of the stack somewhere at the very early stage of program execution, when the stack is still exactly small, with the same value.
Further, checking at which address this value has already disappeared, we understand where the stack went down. Since once the erased color itself will not be restored, the check can be done sporadically - it will show the maximum stack size reached.
Define the color of the paint - the specific value does not matter, below I just tapped with two fingers of my left hand. The main thing is not to choose 0 and FF:
#define STACK_CANARY_WORD (0xCACACACAUL)At the very very beginning of the program, right in the startup file, fill all the free memory with this paint:
volatile unsigned *top, *start;
__asm__ volatile ("mov %[top], sp" : [top] "=r" (top) : : );
start = &_ebss;
while (start < top) {
    *(start++) = STACK_CANARY_WORD;
}
What have we done here? The assembler insert assigned the variable top equal to the current address of the stack - so as not to accidentally wipe it; in the start variable, the address of the end of the bss block (the variable in which it is stored, I looked in the linker script * .ld - in this case, it is from the libopencm3 library). Next, we simply fill everything from the end of bss to the beginning of the stack with the same value.
After that, we can do this at any time:
unsigned check_stack_size(void) {
    /* top of data section */
    unsigned *addr = &_ebss;
    /* look for the canary word till the end of RAM */
    while ((addr < &_stack) && (*addr == STACK_CANARY_WORD)) {
        addr++;
    }
    return ((unsigned)&_stack - (unsigned)addr);
}
Here the variable _ebss is already familiar to us, and the variable _stack is from the same linker script , in it it means the top address of the stack, that is, in this case, just the end of RAM.
This function will return the maximum fixed stack size in bytes.
The further logic is quite simple - somewhere in the body of the program we periodically call check_stack_size () and display its exhaust in the console, on the screen, or where it is convenient for us to display it, and launch the device in combat operation for a period that we consider to be quite long.
We periodically look at the size of the stack.
In this case, through various chaotic actions with the device, it can be brought up to 712 bytes - that is, from the initially available 6 Kbytes of RAM, we still have a reserve of as many as 108 bytes.
Word of caution
The experimental method for determining the size of the stack is simple, efficient, but not 100% reliable. There can always be a situation where a very rare set of circumstances, observed, for example, once a year, will lead to an unplanned increase in this size. However, in the general case and with well-written firmware, we can assume that you are unlikely to have something that overlaps the fixed size by more than 10-20%, so we are safe with our 108 bytes of reserve.
In most cases, this quasi-profiling, which is easily and simply performed on almost any system and regardless of the development tools used, allows you to determine the memory usage efficiency with high reliability and catch the problem with the stack in the early stages, especially when working on younger controllers with RAM size of one kilobytes.
PS In multitasking systems on RTOS, in most cases there are many stacks - in addition to the main MSP stack growing from the top edge of RAM down, there are separate PSP process stacks. Their size is clearly set by the programmer, which does not protect the process from going beyond their borders - therefore, the control methods they use are the same.