March 5, 2019 at 16:41
DataPower Tutorial
- Tutorial
Material co-authored by wedmeed
In 2017, when our project began in Vietnam, we encountered the new beast IBM DataPower for us. IBM DataPower is a gateway product between clients and backends designed for filtering, routing, enrichment or other transformations of messages passing through it (hereinafter referred to as requests). It was necessary to learn quickly, there was no time for buildup, so we were invited to familiarize ourselves with it, after which there were many hours of Skype conference with our colleague from Moscow, who passed on to us his knowledge and experience with this product.
Self-study was based on studying the documentation and watching training videos from the Internet - and here I was waiting for a catch. I was practically unable to find information in Russian. By the way, my knowledge of the English language at that time was not at the highest level, besides it was my first project and, probably, these factors complicated my life. This made me write a training article in Russian and in the simplest possible way for beginner developers who came across this product and are trying to quickly understand its basics. The article will not free you from reading the documentation, but it will make life easier in the early stages of understanding "how it works."
It is also worth noting that the structure given in practice will be close to the real project, which will allow you to use it as a base, expanding and complementing your requirements. In conclusion, a few words about the already implemented project, as well as some features that are worth paying attention to, will be given to the Theory sections.

Part 1. Installing DataPower with the Docker Toolbox
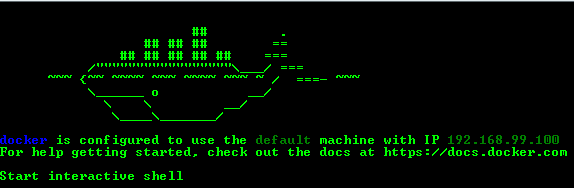
Install and run the Docker Toolbox app. Immediately after starting, you will see the IP address of the machine, through which DataPower will be available in the future:
To start the image, you need to change some settings of the virtual machine (relevant for version IDG.2018.4.1.0) and restart it:
- Stop the docker machine with the command:
docker-machine stop - System -> Motherboard -> Main memory: minimum 4096Mb;
- System -> Processor: minimum 2;
- Display -> Screen -> Video memory: at least 128Mb;
- We launch the docker machine with the command:
docker-machine start
Note. If prompted to restart docker-machine env, run:docker-machine env - Next, you need to deflate the IBM DataPower image:
docker pull ibmcom/datapower - Then launch the docker container with the following command:
docker run -it \ -v $PWD/config:/drouter/config \ -v $PWD/local:/drouter/local \ -e DATAPOWER_ACCEPT_LICENSE=true \ -e DATAPOWER_INTERACTIVE=true \ -p 9090:9090 \ -p 3630:3630 \ -p 9022:22 \ -p 7170:7170 \ --name idg \ ibmcom/datapower - After completing the command, press Enter and enter admin / admin as the username and password
- To start the Web Management Interface, use the commands:
co
andweb-mgmt 0 9090 - After all these steps, execute in the browser https://192.168.99.100:9090/
Part 2. Domains
2.1. Theory
Domains in DataPower allow you to separate administration and development tools, as well as provide security.
After installation, there is only a default domain from which application domains can be created. Each domain has its own configuration of parameters.
Some common resources and parameters can be defined only in the default domain, these include network interfaces, users and access control, application domains, and others.
An application domain is a development section for request processing services. Services defined in it cannot be shared with another application domain. Application domains can be restarted separately and independently, without the need for a full restart of DataPower.
You can create, restart, reset, pause, renew, or delete domains. You can find more detailed information about all the administration features in the official documentation.
A little about the completed project. We used 3 domains:
- default - the default domain containing shared resources and parameters;
- trunk - the main domain containing everything necessary for processing requests;
- settings - settings and security domain, local files contain information about service routing rules and security settings.
The need to transfer all settings to a separate domain arose in connection with the search for a simpler deployment path. As in many projects, the dev, test and prod environments were separated, and the transfer to a separate settings domain allowed us to install all the main domains from the dev environment in other environments through export / import, without the risk of losing the environment settings.
2.2. Practice
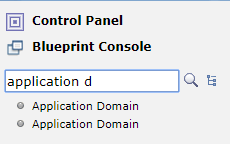
- In the search field, enter “domain”, select “Application Domain” and click “Add”
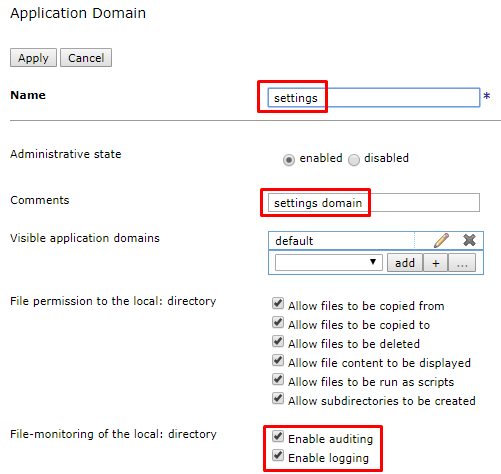
- Here you need to specify the domain name, comment (if desired) and activate auditing and logging. Fill in the fields and apply the changes
- Similarly add another domain “trunk”
- Go to Review changes

- and save the domain configuration

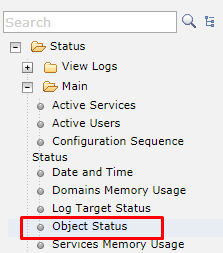
- You can check the status of created objects by going to the default domain in the navigation tree in Status -> Main -> Object Status
- Choose View by: types

- Find the Application Domain in the list and check the status of the objects: each of them must be saved, turned on and in the up state. If so, continue to the next chapter.

Part 3. Queue managers
The queue manager is not a mandatory component of IBM DataPower, but it is through the example of MQ that you can show the full power of this product. We will use MQ from IBM. During the testing described in Chapter 6, we will need to send a message to the local queue manager. In this article, I will do this using the rfhutil utility, but you can use any method available to you. For testing, you will need to create a connection from DP to your local queue manager using the MQ Queue Manager.
3.1. Theory
The queue manager provides data exchange between the gateway and remote queue managers.
You can also configure the MQ Queue Manager Group, which will increase the fault tolerance of the system. This can be useful, for example, if you want to connect the client to any of the set of working queue managers and in some cases, which you can find in the official documentation.
From the experience of the project, only one feature should be noted: at one time we wanted to try to implement load balancing using DataPower, in particular, using groups of queue managers, but in practice we did not find such an opportunity. An alternative solution is to create a cluster of queue managers.
3.2. Practice
3.2.1. Training
- Install WebSphere MQ;
- Create a local LOCAL_DP_QM queue manager, accessible on port 3630;
- Configure DP.SVRCONN channel;
When creating a channel, the following commands may be useful to you:
strmqm LOCAL_DP_QM /*запуск менеджера mq*/ runmqsc LOCAL_DP_QM /*вход в оболочку mq*/ DEFINE CHANNEL (DP.SVRCONN) CHLTYPE(SVRCONN) MCAUSER(‘evlasenko’) /*создание канала*/ SET CHLAUTH(‘DP.SVRCONN’) TYPE(USERMAP) CLNTUSER(‘evlasenko’) USERSRC(channel) ADDRESS(‘*’) ACTION(ADD) /*включение доступа для пользователя со стороны клиента*/ SET CHLAUTH(DP.SVRCONN) TYPE(BLOCKUSER) USERLIST(‘nobody’) /*отключить список блокировки пользователей*/ ALTER LISTENER (SYSTEM.DEFAULT.LISTENER.TCP) TRPTYPE(TCP) PORT(3630) control(QMGR) /*включение автозапуска листенера порт 3630*/ ALTER AUTHINFO (SYSTEM.DEFAULT.AUTHINFO.IDPWOS) AUTHTYPE(IDPWOS) CHCKCLNT(OPTIONAL) /*выключить аутентификацию*/ REFRESH SECURITY TYPE(CONNAUTH) /*обновить настрйоки безопасности*/ endmqm LOCAL_DP_QM /*остановка менеджера mq*/ strmqm LOCAL_DP_QM /*запуск менеджера mq*/ END - Create the queues DP.IIB.REQIN and DP.IIB.RESIN
- Run rfhutil under the name of the user for whom the channel was created. In the Queue Manager Name (to connect to) line, write:
DP.SVRCONN/TCT/127.0.0.1(3630) - Try loading the list of queue names; there should not be any errors in the message window. The connection to the channel has been verified.
3.2.2. Create IBM MQ Queue Manager
- Go to the trunk domain.
- In the search, type MQ, select IBM MQ Queue Manager, and click Add.
- You need to specify the name (TEST_QM), the queue manager hostname, the queue manager name and channel name, as well as the timeout. Configure and save the changes.
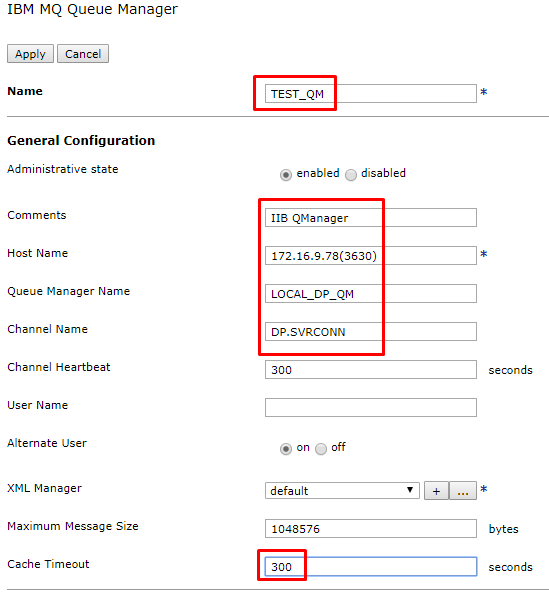
Check the status of the queue manager object in the same way as checking the status of domains. To do this, select Object Status and the View by: types filter from the trunk domain. In the "IBM MQ Queue Manager" section, find the appropriate object and check its status.
Part 4. Multiprotocol Gateways
4.1. Theory
Multi-Protocol Gateway (MPG) is a multi-protocol gateway that allows you to receive requests from clients using various protocols, and then transfer them to different servers using various protocols. The protocol used by the client may not match the protocol used by the remote access server.
In the main MPG settings, you can define the following components:
- XML Manager - controls compilation and caching of style sheets (xsl, xslt), caching of documents.
- Policy - consists of rules, each of which defines a set of actions applied to the message passing through the gateway.
- Front and back side settings (setting url, types of incoming and outgoing messages, timeouts and more).
A few words about the project:
The project uses 4 multi-protocol gateways (routing, 2 transformational for different end systems and an additional one designed to receive files from the settings domain). The diagram below shows the general interaction scheme:

The amount of MPG may vary depending on the architecture of the solution as a whole. In our case, DataPower faces an integration bus (IIB) and microservices that have significant differences in interfaces (json / http versus xml / mq), so we decided to make transformational MPGs for each specific backend and name it accordingly. For all clients, we work on json / http, so routing MPG is one. The main MPGs consist of 3 rules for processing messages - request, response and errors. Each rule consists of the necessary actions, such as transformation, logging, routing and others.
From features - if in policy you use action ConvertQueryParamToXML, then be attentive to InputConversion. If you set the Default Encoding to JSON and try to send a GET request, you will be surprised to find that the message has not undergone any transformations that you specified and will not find any traces of it. This feature will help to overcome the creation of a separate rule for GET requests.
4.2. Practice
4.2.1. Training
You can find all the files necessary for work at the link https://github.com/EvgenyaVlasenko/IBM_DataPower.git
4.2.1.1. Domain trunk
- Go to the trunk domain.
- In the control panel, select File Management.
- In the local directory, create the following directory structure and place the corresponding files in it (each file contains a brief description of what functions it performs, as well as a more detailed discussion of this later in the article).
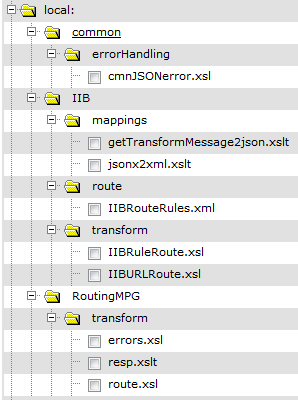
4.2.1.2. Domain settings
- Go to the settings domain.
- In the control panel, select File Management.
- In the local directory, create the following directory structure and place the appropriate files in it (the files also contain a brief description of them).
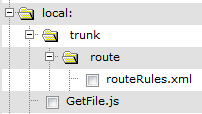
4.2.2. Create GetFileMPG
First, create a simple helper MPG that will return files from the settings domain.
- Go to the settings domain.
- In the control panel, select Multi-Protocol Gateway and click Create.
- Specify the name (GetFileMPG), description (optional), and backend type (dynamic). In fact, since there will be no call to the backend, and only the file will be returned from the local system, in this example you can specify any type of backend.
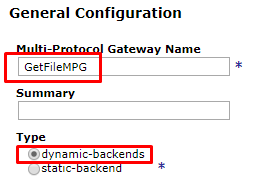
- Specify request and response types. Explicitly specifying types will reduce the number of inline checks. Specifying the Pass through type allows you not to create a rule (in this case, to transform the response). If we specify the Request Type also Pass through, then we will not be able to process the message in any way. This option does not suit us, so we restrict the type of request using Non-XML.

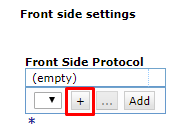
- Click on + and select the HTTP Handler to create a new Front Side Protocol.
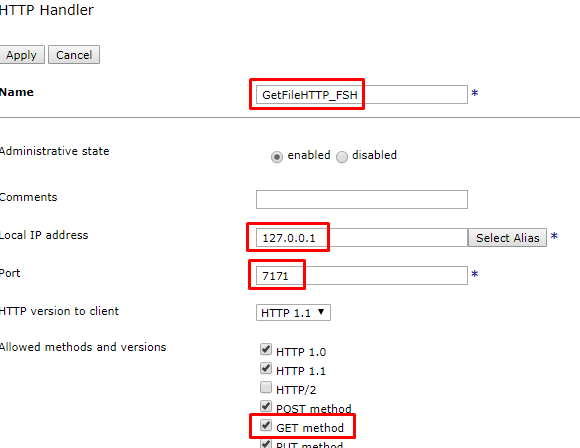
- Here you should specify a name, ip-address, port and a list of allowed methods. Pay attention to the ip address. If you specify 0.0.0.0, then everyone can access this gateway. If 127.0.0.1 - only other gateways inside the same DataPower. Since there are security parameters among the settings, we use the second option. Fill in the fields and click "Apply", the protocol will automatically be added to the gateway.
- Click on + to add a new policy.

- Fill in the policy name “GetFilePolicy”.
- Create a new rule, fill in the name and direction of the rule. Since there really is no backend, and only the desired file is returned, there will be only one rule (client to server).

- Double-click on the Match action to configure it, select an existing rule and apply the changes. It would be ideologically correct to set a limit on the ability to receive only Get-requests, but within the framework of the training task, you can choose an existing one.
- Add another action - GatewayScript by dragging it onto the rule and configure it. As a transformation, we will use the prepared file, which in the local: /// file system will find the file by name from the URI of the incoming request and place it in the message body. The result of the operation will be transferred directly to the output buffer of the rule. Save the changes.

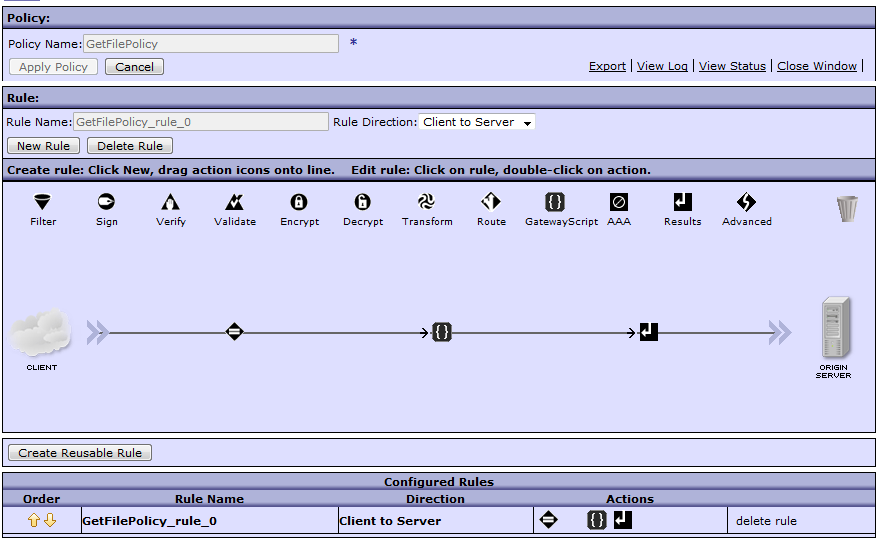
- The final policy result should look like this:
- MPG creation is complete, save the changes.
- You can verify the success of its creation using Object Status, similar to checking the status of domains and the queue manager. To do this, select Object Status and the View by: services filter from the settings domain. In the “Multi-Protocol Gateway” section, search for the corresponding object and check its status.
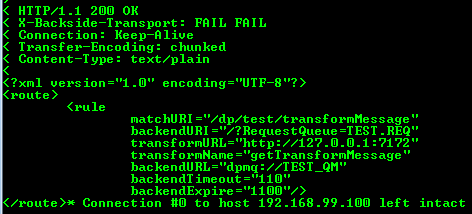
- You cannot call this MPG from the outside, since you protected it with ip. Temporarily change ip from 127.0.0.1 to 0.0.0.0 and port from 7171 to 7170 and run the following query:
curl -vv -k "http://192.168.99.100:7170/trunk/route/routeRules.xml" - You should get the following answer:
- Again, change the ip and port to the original 127.0.0.1:7171.
4.2.3. Creating RoutingMPG
Now create RoutingMPG. Based on the input request and routing rules, he will determine where and with what parameters the request should be sent.
- Go to the trunk domain.
- Create a new Multi-Protocol Gateway in accordance with clauses 2-10 of section 4.2.2 using the following values:
- 3 - name: RoutingMPG, backend type: Dynamic (for the ability to route requests to different MPGs if necessary).
- 4 - Rq: Non-xml, Rs: Non-xml.
- 6 - name: RoutingHTTP_FSH, ip: 0.0.0.0, port: 7170, + Get method.
- 8 - name: RoutingPolicy.
- 9 - name: RoutingPolicy_rule_req, direction: Client to Server.
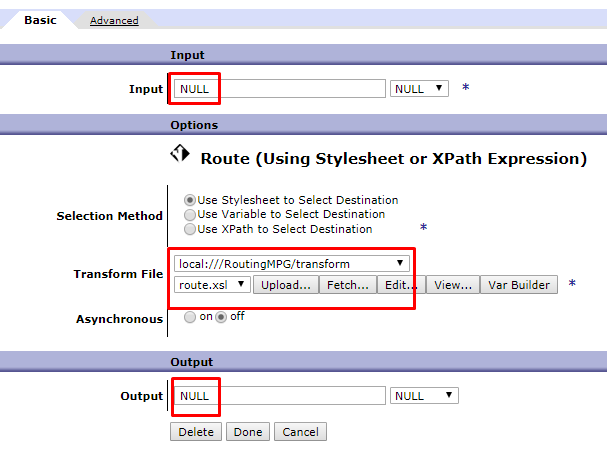
- Add one more action to route the request. To do this, drag the “Route” action onto the rule, double-click on it to configure it, fill in the fields and apply the changes. The route.xsl file receives the routing settings file from the settings domain through GetFileMPG created earlier. After that, based on the URI, the settings that are necessary for this operation are already selected from the file. Some of them are used for routing, and some are added to headers for use in other MPGs. The input and output parameters determine the way of working only with the message body and in no way affect headers and variables. Therefore: input from null - since the information from the message body is not used for routing. The output is null - since the result of the transformation is only a change in the service information.
- Similarly, create 2 more rules and save all changes:
- Direction: Server-Client, name: RoutingPolicy_rule_resp;
Transformation: Input INPUT, Output NULL, transformation file local: ///RoutingMPG/transform/resp.xslt. The resp.xslt file receives the http status of the transformation MPG response and explicitly sets it to the RoutingMPG response. If this is not done, then the default code will be set to 200, even if an error occurred in the transformation MPG. - Direction: Error, name: RoutingPolicy_rule_error;
Transformation: Input INPUT, Output PIPE (according to the documentation, using PIPE between two adjacent action nodes as INPUT and OUTPUT can eliminate additional processing and reduce the amount of memory used), the transformation file is local: ///RoutingMPG/transform/errors.xsl. The errors.xsl file receives the error code and text from the response from the transformation MPG and generates a JSON error message in the format expected by the client.
- Direction: Server-Client, name: RoutingPolicy_rule_resp;
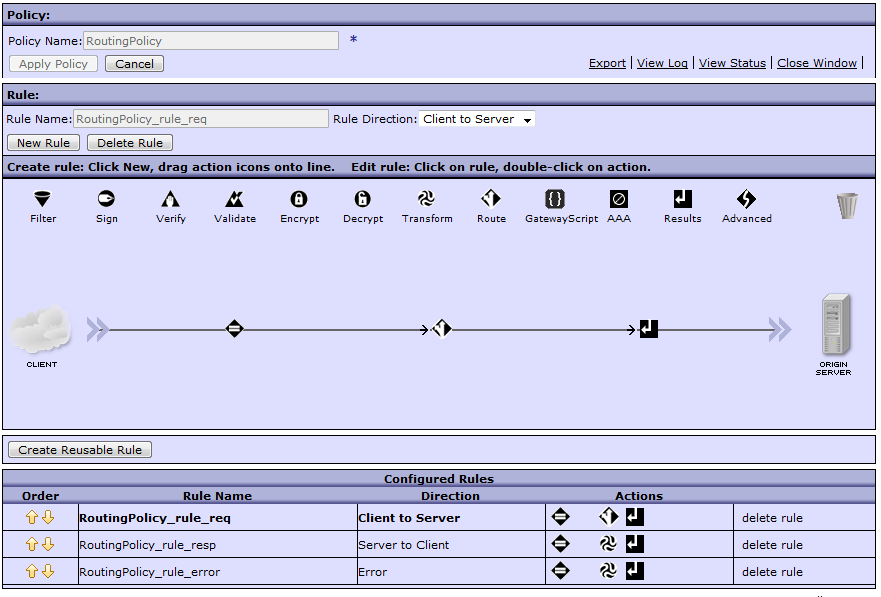
- The final policy result should look like this:
- MPG creation is complete, save the changes.
- Using, for example, the curl utility, run the following query:
curl -vv -k "http://192.168.99.100:7170/dp/test/transformMessage" - If you get the following error, then everything is done correctly. This error means that the message was successfully received and processed, but the attempt to call the backend (in this case IIBMPG) was unsuccessful. Go to the next step.

4.2.4. Creation of IIBMPG
The next step is to create a transformational MPG. Suppose the external system is in the JSON request format and the internal is XML. We need to transform the input message so that the internal system can understand it. It is worth noting that this is not always a simple conversion of the entire message. It is often required to convey a truncated or augmented message, sometimes with a completely redesigned structure.
- Go to the trunk domain.
- Create a new Multi-Protocol Gateway in accordance with clauses 2-10 of section 4.2.2 using the following values:
- 3 - name: IIBMPG, backend type: Dynamic
- 4 - Rq: JSON, Rs: XML
- 6 - name: IIBHTTP_FSH, ip: 127.0.0.1 (only requests from the same DataPower), port: 7172, + Get method
- 8 - Name: IIBPolicy
- 9 - name: IIBPolicy_rule_req, direction: Client to Server
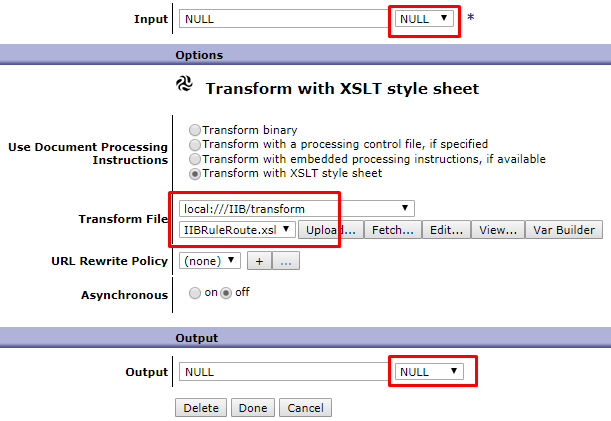
- Add a description. Based on the X-DP-Transform-Name in the request headers, the IIBRuleRoute.xsl file receives from the local: ///IIB/route/IIBRouteRules.xml file the names of the request transformation, response and error files for this service and sets their values to the corresponding context variables var: // context / IIB / reqTransform, var: // context / IIB / ansTransform, var: // context / IIB / errTransform. Other values from headers (url, uri, expire, timeout) are also placed in context variables.
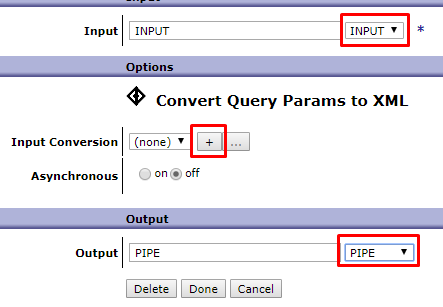
- Add another action by dragging Advanced to your rule and selecting Convert Query Params to XML from the list, configure. You need to add a new input conversion map, giving it a name (cmnJSONParseCNVM) and the required type (JSON).
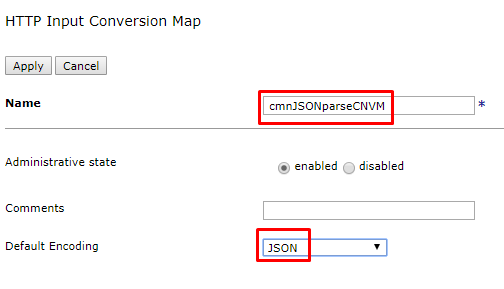
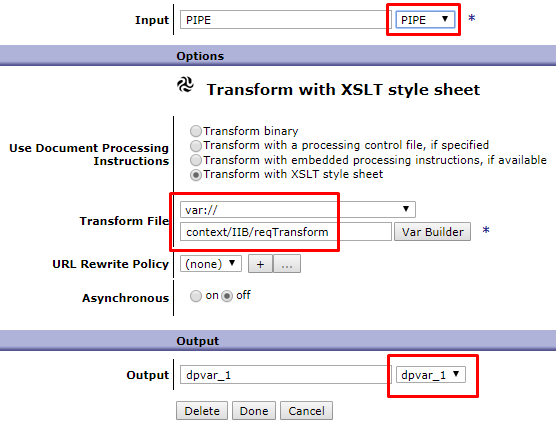
- Add the transformation after the standard conversion and configure it. In this case, the variable set in the previous transformation is used to indicate the transformation file. This is done so that the transformation is universal, and the file itself is substituted "on the fly" depending on the input message. The message body is ready. The next step is to route the message, and the message body will not change, so we create the dpvar_1 variable and save the result in it. It is this variable that we point to the input to the Results action. Save the changes.
- Add a routing action and set the following parameters. The IIBURLRoute.xsl file receives the values of context variables, some of them are set as service request variables, and from the rest it forms a URI for the request to the destination system, which also stores in the service variable.

- Similarly, create 2 more rules and save all changes:
- Direction: Server-Client, name: IIBPolicy_rule_resp;
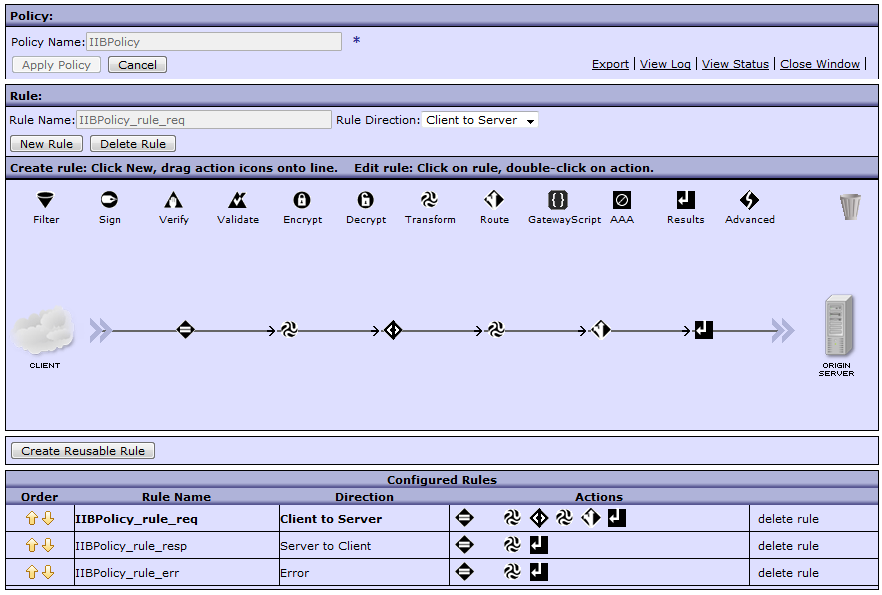
Transformation: Input INPUT, Output PIPE, transformation file var: // context / IIB / ansTransform (context variable for substituting the transformation of the response "on the fly"). - Direction: Error, name: IIBPolicy_rule_error;
Transformation: Input NULL, Output PIPE, transformation file var: // context / IIB / errTransform (context variable to substitute error transformation on the fly).
- Direction: Server-Client, name: IIBPolicy_rule_resp;
- The final policy result should look like this:
- MPG creation is complete, save the changes.
Part 5. Testing
5.1. Training
- Download, for example, the rfhutil utility for reading and writing messages to the queue;
- Test files are located in the tests folder of the same directory as the project files.
5.2. Health Check
- Send the request using the curl utility (for the request below, the current directory should be the same as example.json).
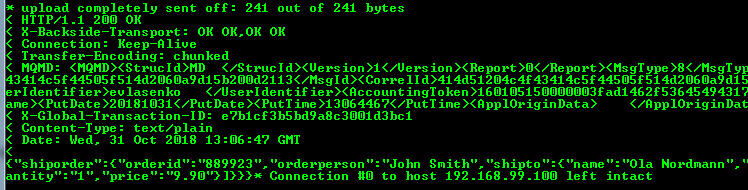
curl -vv -k "http://192.168.99.100:7170/dp/test/transformMessage" -H "Content-Type: application/json" --data-binary @example.json - Open 2 instances of rfhutil utility and subtract the message from the DP.IIB.REQIN queue with the first instance;
- Go to the MQMD tab and copy the MessageID;
- In the second instance, open the rs.xml file, in the MQMD tab, insert the message identifier in CorrelID and put the message in the DP.IIB.RESIN queue;
- You should get a similar answer:
- Repeat steps 1-3;
- In the second instance, open the rs_error.xml file and send a message to the queue by filling in correllId;
- The answer will change as follows

Part 6. Logging
6.1. Theory
Log Targets capture various messages that occur in the system and save them in the specified form.
On the project, we created Log Targets for each gateway separately. Logs are stored in text form, for each gateway 4 files are allocated for logs with a volume of 1000Kb, if the limit is exceeded, the files are overwritten cyclically. With an average activity with such parameters, information about the request can be extracted within 2-4 days after its completion. Ideally, it is better to make external log collectors, since at the slightest increase in load, everything will be overwritten. In addition, DataPower, at least virtual, has a tendency to die when it runs out of space on its hard drive, which can be noticed far from immediately, but only when the logs of some quiet MPG that everyone has long forgotten about are full.
6.2. Practice
- Go to the trunk domain;
- In the search, type Log Target and click add;
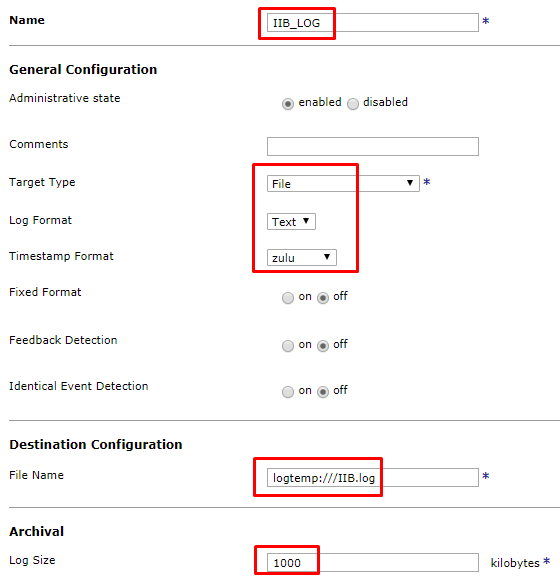
- On the main tab, fill in the following fields:
- Title (IIB_LOG);
- Type (File);
- Format (Text);
- Format timestamp (zulu);
- File Name (logtemp: ///IIB.log - for IIBMPG);
- File size (1000).
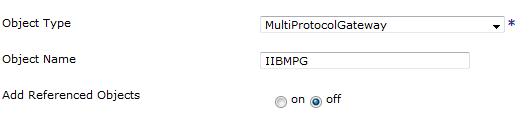
- Add an object filter. In our case, we want to follow the MPG named IIBMPG.
- Add a subscription to the events, indicating the category and priority of the events that you want to pledge (the priority of the events indicates that events of this priority and higher will be pledged).

- Other parameters may be left at default values;
- Save the configuration of the entire domain;
- To view the logs, open the file you specified in the file manager.
- By analogy, you can create Log Targets for other MPGs.
- Repeat test requests:
- If successful, you will not see anything in the logs or see the following messages, meaning that you are working in debug mode and harm performance.

- And in case of an error, you will see the text of the error that occurred.

- If successful, you will not see anything in the logs or see the following messages, meaning that you are working in debug mode and harm performance.
Part 7. If something went wrong
- If you manage to get to logging, you know where to look for logs. If they are not enough - log the body, headers and everything that could somehow indicate to you the cause of the error.
- Often you can not do without system logs. Go to the control panel in the View Logs section. Here you can always find system errors, such as “file not found”, “failed to parse the answer” and all sorts of things of this kind.
- For beginners, the debug mode will be very useful. It allows you to step by step to trace your message as you go through each action. To activate, go to the MPG you need and in the upper menu on the right click Show Probe -> Enable Probe. After sending the request, refresh the list and click on the magnifier. Passing through the actions, you can observe all the transformations of your request.

- Turn off debug mode when you no longer need it.
If all else fails, ask questions in the comments.