Optimizing Prometheus 2.6.0 startup times with pprof
- Transfer
Prometheus 2.6.0 optimizes WAL loading, which speeds up the startup process.
The unofficial goal of the development of Prometheus 2.x TSDB is to speed up the launch so that it takes less than a minute. In recent months, there have been reports that the process is a bit delayed, and if Prometheus restarts for some reason, this is already a problem. Almost all this time, WAL is loaded (pre-registration recording), which includes samples from the last few hours that have yet to be compressed into a block. In late October, I finally managed to figure it out; the result is PR # 440 , which reduces the CPU time by 6.5 times and the calculation time by 4 times. Consider how I achieved these improvements.

First, a test setup is needed. I created a small Go program that generates TSDB with WAL with a billion samples scattered over 10,000 time series. Then I opened this TSDB and looked at how long it took to use the utility time(not the built-in structure, because it does not include memory statistics), and also created a CPU profile using the runtime / pprof package :
f, err := os.Create("cpu.prof")
if err != nil {
  log.Fatal(err)
}
pprof.StartCPUProfile(f)
defer pprof.StopCPUProfile()
The CPU profile does not allow us to directly establish the calculation time of interest, however, there is a significant correlation. As a result, on my desktop computer (i7-3770 processor with 16 GB of RAM and solid-state drives) the download took about 4 minutes and a little less than 6 GB of RAM at the peak:
1727.50user 16.61system 4:01.12elapsed 723%CPU (0avgtext+0avgdata 5962812maxresident)k
23625165inputs+95outputs (196major+2042817minor)pagefaults 0swaps
This is not gud, so let's load the profile with go tool pprof cpu.profand see how long the process takes if we use the command top.

Here flatis the amount of time spent on this function, and the cumtime spent on this function and on all functions called to it. It may also be useful to view this data in a graph to get an idea of the question. I prefer to use a command for this web, but there are other options, including svg, png and pdf files.
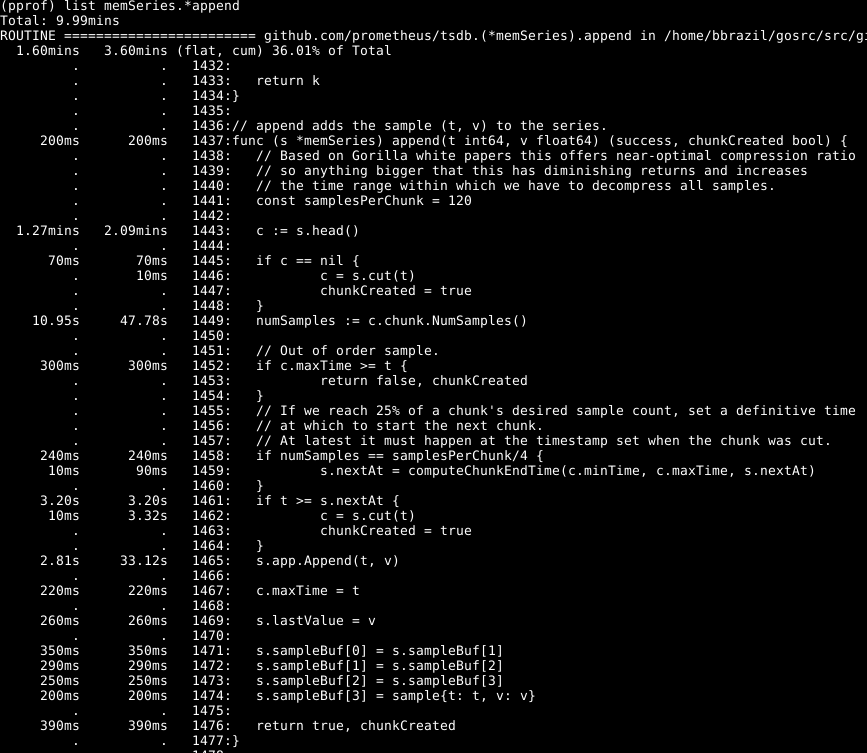
It can be seen that about a third of our CPU is spent on adding samples to the internal database, about two thirds on processing WAL as a whole, and a quarter on clearing the memory ( runtime.scanobject). Let's look at the code for the first of these processes using list memSeries.*append:

Here the following is striking: more than half of the time is spent on getting the head piece of data for the series in line 1443. Also, it is not a short time to set the number of samples in this piece of data in line 1449. The time required to complete line 1465 - expected, since this is the core of the actions of this function. Accordingly, I expected the operation to take up most of the time.
Take a look at the item memSeries.head: it calculates a piece of data that is returned each time. The data fragment is only changed after every 120 additions, and so we can save the current head fragment in the data structure of the series . This takes up some of the RAM ( which I will return to later ), but saves a significant amount of CPU. And in general, also accelerates the work of Prometheus.
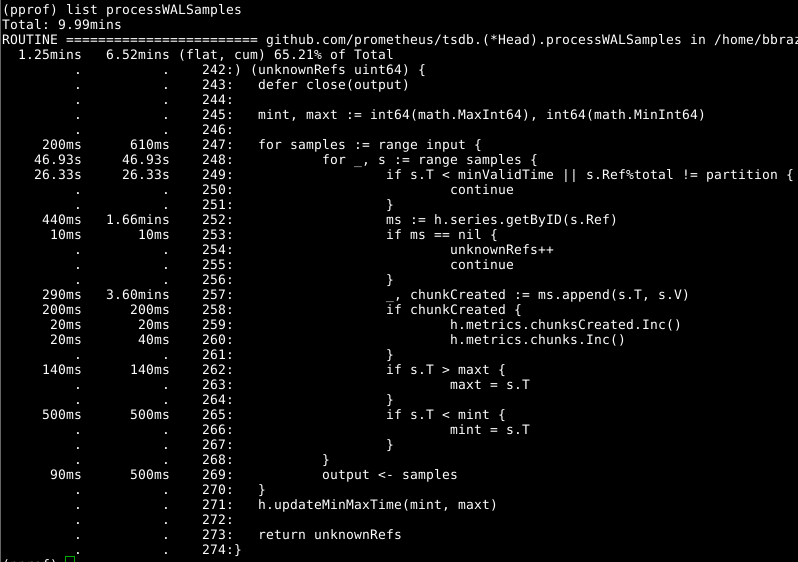
Then let's take a look at Head.processWALSamples:

This addition is already optimized above, so look at the next obvious culprit, getByIDin line 252:
(code)
It seems that there is a certain blocking conflict, and time is spent on performing a search on a two-level map. The cache for each identifier significantly reduces this figure.
It is worth Head.processWALSamplestaking another look at and wondering how much time is spent on line 249. Let's go back a little, to the question of how WAL loading works: a homepage Head.processWALSamplesis created for each available CPU, in addition to another one for reading and decoding WAL from a disk. Rows are segmented by these gorutinami, so that parallelism can be an advantage. The method of implementation is as follows: all samples are sent to the first grade that processes the elements it needs. She then sends all the samples to the second gorutina, which processes the elements she needs, and so on, until the last gorutina Head.processWALSamplessends all the data back to the control gorutina.
In the meantime, the additions are distributed among the cores - which is what you need - there are also many duplicate tasks in each plan, which must process all the samples and calculate the module. In fact, the more cores, the more work is duplicated. I made changes to segment the data in the controller's gorutin, so that each state Head.processWALSamplesnow receives only the samples it needs . On my computer - 8 running gourutin - the calculation time was saved a little, but the CPU volume is decent. For computers with a large number of cores, the advantages should be greater.
And back to the question: time to clear the memory. We cannot (usually) determine this through the CPU profiles. Instead, you should pay attention to the dynamic memory profiles to find the elements that stand out. This requires some extension of the code at the end of the program:
runtime.GC()
hf, err := os.Create("heap.prof")
if err != nil {
  log.Fatal(err)
}
pprof.WriteHeapProfile(hf)
Formal memory cleaning is associated with some information in dynamic memory, which is collected and cleaned only during memory cleaning.
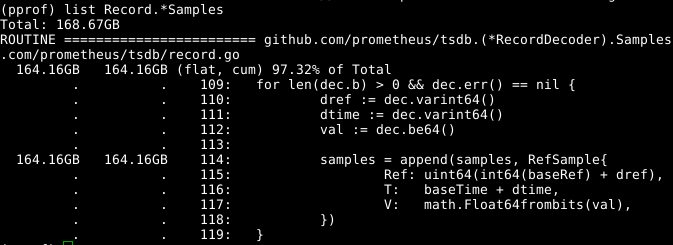
We use the same tool again, but specify the label -alloc_space, because we are interested in all memory allocation operations, and not only operations that use memory at a particular moment; thus, we execute go tool pprof -alloc_space heap.prof. If you look at the upper distributor, then the culprit is obvious:

Take a look at the code:

It seems that an expandable array samplesis a problem. If we could reuse the array at the same time as the call RecordDecoder.Samples, it would save a significant amount of memory. It turns out that the code was composed in this way, but a small coding error led to the fact that it did not work. If corrected , the memory is cleared in 8 seconds of the CPU instead of 151 seconds.
The overall results are quite tangible:
269.18user 10.69system 1:05.58elapsed 426%CPU (0avgtext+0avgdata 3529556maxresident)k
23174929inputs+70outputs (815major+1083172minor)pagefaults 0swap
In our country, not only the calculation time was reduced by 4 times, and the CPU operating time - by 6.5 times, but also the amount of occupied memory is reduced by more than 2 GB.
It looks as if everything is simple, but the trick is this: I decently rummaged through the code base and analyze everything as if in hindsight. Studying the code, I came to a standstill several times, for example, when deleting a call NumSamples, performing reading and decoding in separate streams, as well as in several variants of work segmentation processWALSamples. I am almost sure that by adjusting the amount of gorutin, more can be achieved, but for this, tests should be carried out on machines more powerful than mine, so that there are more cores. I have achieved my goal: productivity has increased, and I realized that it is better not to make the registry of programs too large, and therefore I decided to stop at what had been achieved.
