Is it possible to count statistics with a small amount of data?
In general, the answer is yes. Especially when there are brains and knowledge of the Bayes theorem.
Let me remind you that the average and variance can be considered only if you have a certain number of events. In the old USSR textbooks, the RTM (technical guidance material) stated that 29 measurements are necessary to calculate the mean and variance. Now in the universities a little rounded and use the number of 30 measurements. What is the reason - a philosophical question. Why can't I just take and calculate the average if I have 5 measurements? In theory, nothing interferes, only the average turns out to be unstable. After another measurement and recalculation, it can change greatly and rely on it starting somewhere from 30 measurements. But even after the 31st dimension, it will also be shaken, just not so noticeable. Plus, the problem is added, that the average can be read differently and get different values. That is, from a large sample, you can choose the first 30 and calculate the average, then choose another 30, etc. ... and get a lot of averages, which can also be averaged. The true average is unattainable in practice, since we always have a finite number of measurements. In this case, the mean is a statistic with its mean and variance. That is, by measuring the average in practice, we mean the “estimated average”, which may be close to the ideal theoretical value.
Let's try to understand the question, at the entrance we have a number of facts and we want to build on the output an idea of the source of these facts. We will build a mat model and use Bayes theory for a bunch of models and facts.

Consider the already hackneyed model with a bucket in which a lot of black and white balls are poured and thoroughly mixed. Let black correspond to the value 0, and to white 1. We will randomly pull them out and count the notorious mean value. In essence, this is a simplified measurement, since numbers are assigned and therefore, in this case, there is an average measurement value, which depends on the ratio of different balls.
Here we come across an interesting moment. The exact ratio of the balls we can calculate with a large number of measurements. But if the number of measurements is small, then special effects are possible in the form of deviations from the statistics. If there are 50 white and 50 black balls in the basket, then the question arises - is there a chance of pulling out 3 white balls in a row? And the answer - of course there is! And if in 90 white and 10 black, then this probability increases. And what to think about the contents of the urn, if it’s so lucky that at the very beginning, exactly 3 white balls were accidentally pulled out? - we have options.
Obviously, getting 3 consecutive white balls is equal to one when we have 100% white balls. In other cases, this probability is less. And if all the balls are black, then the probability is zero. Let's try to systematize these arguments and give formulas. It comes to the aid of the method of Bayes, which allows you to rank the assumptions and give them numerical values that determine the probability that this assumption will correspond to reality. That is, to move from a probabilistic interpretation of data to a probabilistic interpretation of causes.
How exactly can you numerically evaluate this or that assumption? This will require a model in which we will act. Thank God, it is simple. We can write a lot of assumptions about the contents of the basket in the form of a model with a parameter. In this case, one parameter is enough. This parameter essentially sets a continuous set of assumptions. The main thing is that he fully describes the possible options. The two extreme options are only white or only black balls. The remaining cases are somewhere in the middle.
Assume that- This is the proportion of white balls in the basket. If we iterate over the entire basket and add all the corresponding balls to the zeros and ones and divide by the total quantity, then- will also mean the average value of our measurements. . (nowoften used in the literature, as a set of free parameters that requires optimization).
It's time to go to Bayes. Thomas Bayes himself forced his wife to accidentally throw a ball, sitting with her back and writing down how his assumptions relate to the facts where he actually flew. Thomas Bayes tried to improve the predictions of the next shots based on the facts obtained. We will like Thomas Bayes to count and think, and the spontaneous and unpredictable girlfriend will take the balls.
Let be- this is an array of measurements (data). Use the standard entry where the signmeans the probability of an event to the left if it is already known that another event on the right has been executed. In our case, this is the probability of receiving data if the parameter is known.. And also there is a case of the opposite - the probability of havingif data is known.
Bayes Formula allows you to consider , as a random variable, and find the most likely value. That is, find the most likely ratioif it is unknown.
In the right part we have 3 members that need to be assessed. Let's analyze them.
1) It is required to know or calculate the probability of obtaining such data with a particular hypothesis. You can get three white balls in a row, even if it's full of black ones. But most likely to get them with a large number of whites. The probability of getting a white ball isand black . Therefore, if dropped white balls and black balls then . and We will consider the input parameters of our calculations, and - output parameter.
2) It is necessary to know the prior probability. Here we come across a delicate moment of model construction. We do not know this function and we will build assumptions. If there is no additional knowledge, then we will assume thatequally likely in the range from 0 to 1. If we had insider information, we would know more about which values are more likely and build a more accurate forecast. But since such information is not available, we set. Since the value does not depend on then when calculating it will not matter.
3) - is the probability to have such a data set if all values are random. We can get this set at differentwith different probability. Therefore, all possible ways of obtaining a set are taken into account.. Since at this stage the value is still unknownthen it is necessary to integrate by . In order to better understand this, it is necessary to solve elementary problems in which a Bayesian graph is constructed, and then go from the sum to the integral. You’ll get a wolframalpha expression that looks for the maximum will not be affected, since this value is independent of . The result is expressed in terms of factorial for integer values or, in general, through the gamma function.
In fact, the probability of a particular hypothesis is proportional to the probability of obtaining a data set. In other words, - under what scenario, we are likely to get the result, that one and the most correct one.
We get this formula
To search for the maximum differentiate and equate to zero:
.
In order for the product to be equal to zero, one of the members must be zero.
We are not interested and , since there is no local maximum at these points, and the third factor indicates a local maximum, therefore
.
We obtain a formula that can be used for predictions. If it fell whites and black then probability the next one will be white. For example, if there were 2 black and 8 white, then the next white will be with a probability of 80%.
Those interested can play with the schedule, introducing different exponents: a link to wolframalpha .
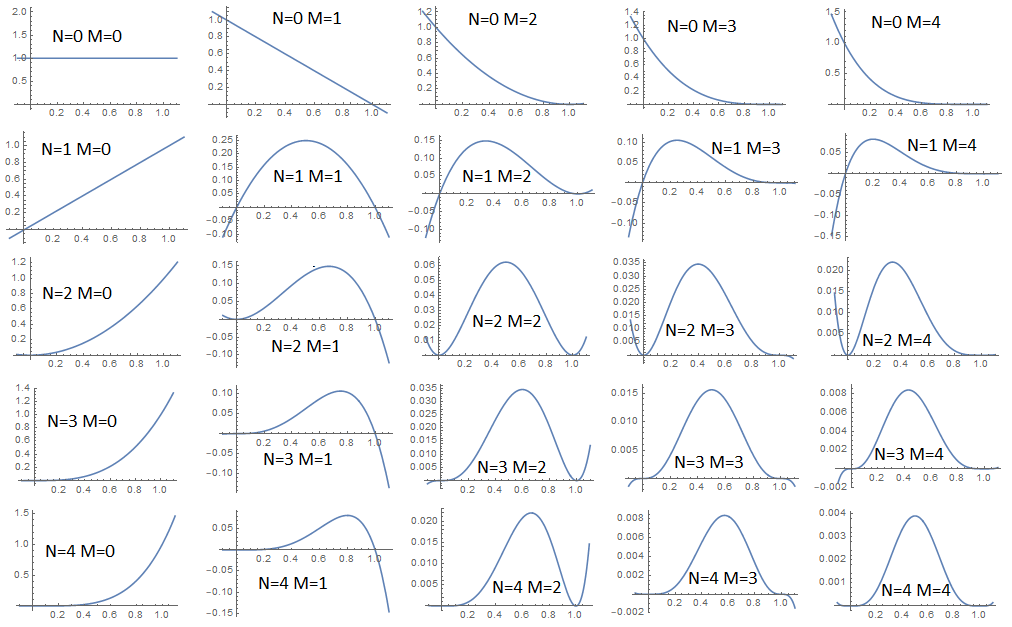
As you can see from the graph, the only case is does not have a point maximum - this is when there is no data . If we have at least one fact, then the maximum is reached on the intervalat one single point. If a, then the maximum is reached at point 0, that is, if all the balls fall out black, then most likely all other balls will also be black and vice versa. But as already mentioned, unlikely combinations are also possible, especially if the dome of our distribution is flat. In order to estimate the uniqueness of our forecast, it is required to estimate the variance. Already from the graph it is clear that with a small number of facts, the dispersion is large and the dome is gently sloping, while adding new facts, the dispersion decreases and the dome becomes more acute.
Mean (first moment) by definition
.
By definition, variance (second central moment). His then we will be considered further in the hidden section.
.
In the end, we get:
As you can see, the variance decreases as data is added and it is symmetrical about the change and in places.
You can summarize the calculations. With a small amount of data, you need to have a model, the parameters of which we will optimize. The model describes a set of assumptions about the real state of affairs and we select the most appropriate assumption. We consider a posteriori probabilities, if a priori are already known. The model should cover the possible options that we will find in practice. With a small amount of data, the model will produce a large variance for the output parameters, but as the amount of data increases, the variance will decrease and the forecast will be more unambiguous.
We must understand that the model is just a model that does not take into account much. It is created by the person and invests in it limited opportunities. With a small amount of data, the person’s intuition will most likely work, since the person receives much more signals from the outside world and will be able to draw conclusions faster. Such a model is more suitable as an element of more complex calculations, since Bayes is scaled and allows you to make cascades of formulas that refine each other.
On this I would like to finish my post. I will be glad to your comments.

Wikipedia Links : Bayes Theorem
Wikipedia: Dispersion
Let me remind you that the average and variance can be considered only if you have a certain number of events. In the old USSR textbooks, the RTM (technical guidance material) stated that 29 measurements are necessary to calculate the mean and variance. Now in the universities a little rounded and use the number of 30 measurements. What is the reason - a philosophical question. Why can't I just take and calculate the average if I have 5 measurements? In theory, nothing interferes, only the average turns out to be unstable. After another measurement and recalculation, it can change greatly and rely on it starting somewhere from 30 measurements. But even after the 31st dimension, it will also be shaken, just not so noticeable. Plus, the problem is added, that the average can be read differently and get different values. That is, from a large sample, you can choose the first 30 and calculate the average, then choose another 30, etc. ... and get a lot of averages, which can also be averaged. The true average is unattainable in practice, since we always have a finite number of measurements. In this case, the mean is a statistic with its mean and variance. That is, by measuring the average in practice, we mean the “estimated average”, which may be close to the ideal theoretical value.
Let's try to understand the question, at the entrance we have a number of facts and we want to build on the output an idea of the source of these facts. We will build a mat model and use Bayes theory for a bunch of models and facts.
Consider the already hackneyed model with a bucket in which a lot of black and white balls are poured and thoroughly mixed. Let black correspond to the value 0, and to white 1. We will randomly pull them out and count the notorious mean value. In essence, this is a simplified measurement, since numbers are assigned and therefore, in this case, there is an average measurement value, which depends on the ratio of different balls.
Here we come across an interesting moment. The exact ratio of the balls we can calculate with a large number of measurements. But if the number of measurements is small, then special effects are possible in the form of deviations from the statistics. If there are 50 white and 50 black balls in the basket, then the question arises - is there a chance of pulling out 3 white balls in a row? And the answer - of course there is! And if in 90 white and 10 black, then this probability increases. And what to think about the contents of the urn, if it’s so lucky that at the very beginning, exactly 3 white balls were accidentally pulled out? - we have options.
Obviously, getting 3 consecutive white balls is equal to one when we have 100% white balls. In other cases, this probability is less. And if all the balls are black, then the probability is zero. Let's try to systematize these arguments and give formulas. It comes to the aid of the method of Bayes, which allows you to rank the assumptions and give them numerical values that determine the probability that this assumption will correspond to reality. That is, to move from a probabilistic interpretation of data to a probabilistic interpretation of causes.
How exactly can you numerically evaluate this or that assumption? This will require a model in which we will act. Thank God, it is simple. We can write a lot of assumptions about the contents of the basket in the form of a model with a parameter. In this case, one parameter is enough. This parameter essentially sets a continuous set of assumptions. The main thing is that he fully describes the possible options. The two extreme options are only white or only black balls. The remaining cases are somewhere in the middle.
Assume that- This is the proportion of white balls in the basket. If we iterate over the entire basket and add all the corresponding balls to the zeros and ones and divide by the total quantity, then- will also mean the average value of our measurements. . (nowoften used in the literature, as a set of free parameters that requires optimization).
It's time to go to Bayes. Thomas Bayes himself forced his wife to accidentally throw a ball, sitting with her back and writing down how his assumptions relate to the facts where he actually flew. Thomas Bayes tried to improve the predictions of the next shots based on the facts obtained. We will like Thomas Bayes to count and think, and the spontaneous and unpredictable girlfriend will take the balls.
Let be- this is an array of measurements (data). Use the standard entry where the signmeans the probability of an event to the left if it is already known that another event on the right has been executed. In our case, this is the probability of receiving data if the parameter is known.. And also there is a case of the opposite - the probability of havingif data is known.
Bayes Formula allows you to consider , as a random variable, and find the most likely value. That is, find the most likely ratioif it is unknown.
In the right part we have 3 members that need to be assessed. Let's analyze them.
1) It is required to know or calculate the probability of obtaining such data with a particular hypothesis. You can get three white balls in a row, even if it's full of black ones. But most likely to get them with a large number of whites. The probability of getting a white ball isand black . Therefore, if dropped white balls and black balls then . and We will consider the input parameters of our calculations, and - output parameter.
2) It is necessary to know the prior probability. Here we come across a delicate moment of model construction. We do not know this function and we will build assumptions. If there is no additional knowledge, then we will assume thatequally likely in the range from 0 to 1. If we had insider information, we would know more about which values are more likely and build a more accurate forecast. But since such information is not available, we set. Since the value does not depend on then when calculating it will not matter.
3) - is the probability to have such a data set if all values are random. We can get this set at differentwith different probability. Therefore, all possible ways of obtaining a set are taken into account.. Since at this stage the value is still unknownthen it is necessary to integrate by . In order to better understand this, it is necessary to solve elementary problems in which a Bayesian graph is constructed, and then go from the sum to the integral. You’ll get a wolframalpha expression that looks for the maximum will not be affected, since this value is independent of . The result is expressed in terms of factorial for integer values or, in general, through the gamma function.
In fact, the probability of a particular hypothesis is proportional to the probability of obtaining a data set. In other words, - under what scenario, we are likely to get the result, that one and the most correct one.
We get this formula
To search for the maximum differentiate and equate to zero:
.
In order for the product to be equal to zero, one of the members must be zero.
We are not interested and , since there is no local maximum at these points, and the third factor indicates a local maximum, therefore
.
We obtain a formula that can be used for predictions. If it fell whites and black then probability the next one will be white. For example, if there were 2 black and 8 white, then the next white will be with a probability of 80%.
Those interested can play with the schedule, introducing different exponents: a link to wolframalpha .
As you can see from the graph, the only case is does not have a point maximum - this is when there is no data . If we have at least one fact, then the maximum is reached on the intervalat one single point. If a, then the maximum is reached at point 0, that is, if all the balls fall out black, then most likely all other balls will also be black and vice versa. But as already mentioned, unlikely combinations are also possible, especially if the dome of our distribution is flat. In order to estimate the uniqueness of our forecast, it is required to estimate the variance. Already from the graph it is clear that with a small number of facts, the dispersion is large and the dome is gently sloping, while adding new facts, the dispersion decreases and the dome becomes more acute.
Mean (first moment) by definition
.
By definition, variance (second central moment). His then we will be considered further in the hidden section.
.
--- section for inquiring minds ---
Let's get analytically completely, if not yet tired. To do this, we will reiterate all the terms from the Bayes formula, including the constant ones:
link to wolframalpha
The Bayes formula is completely as follows for our case:
Hence the mean after substitution
.
We use elementary knowledge and reducing fractions
The formula of the first moment corresponds to the meaning of the experiment. With the predominance of white balls, the moment goes to 1, and with the predominance of black, it tends to 0. It doesn’t even be capricious when there are no balls, and quite honestly shows 1/2.
Dispersion is also expressed by the formula with which we will work.
.
First member по большей части повторяет формулу для , используется —
,a второй уже подсчитан, поэтому
In the end, we get:
As you can see, the variance decreases as data is added and it is symmetrical about the change and in places.
You can summarize the calculations. With a small amount of data, you need to have a model, the parameters of which we will optimize. The model describes a set of assumptions about the real state of affairs and we select the most appropriate assumption. We consider a posteriori probabilities, if a priori are already known. The model should cover the possible options that we will find in practice. With a small amount of data, the model will produce a large variance for the output parameters, but as the amount of data increases, the variance will decrease and the forecast will be more unambiguous.
We must understand that the model is just a model that does not take into account much. It is created by the person and invests in it limited opportunities. With a small amount of data, the person’s intuition will most likely work, since the person receives much more signals from the outside world and will be able to draw conclusions faster. Such a model is more suitable as an element of more complex calculations, since Bayes is scaled and allows you to make cascades of formulas that refine each other.
On this I would like to finish my post. I will be glad to your comments.
Wikipedia Links : Bayes Theorem
Wikipedia: Dispersion