Liveprof will show when and why your PHP application performance has changed.

Hi, Habr! My name is Timur Shagiakhmetov, I'm a PHP developer at Badoo .
Application performance is one of the most important criteria for the quality of a programmer’s work. In the optimization of PHP-applications assistant profiler is.
Recently we talked about what tools we use for profiling. Let me remind you: one of the tools for analyzing performance, when it is unclear which parts of the code most influenced the increase in response time, is XHProf . This is an extension for PHP that allows you to profile the code on the combat server and subsequently improve it.
But I would also like to have a history of performance changes, so that you can track what and when affected its deterioration, right? About a year ago, we developed Liveprof for this - a tool for automatic profiling of all requests with an interface for analyzing changes in application performance.
Our tool allows you to analyze the change in the performance of any part of the code, to find the places where it fell most heavily. At the same time, it is not necessary to specifically include it and wait for statistics to accumulate, it is always active and collects data for a certain percentage of all requests.
In this article I will talk about the details of the implementation and features of the use of this tool.
Little about XHProf
First, a few words about the capabilities of XHProf itself. This is a PHP profiler written in C as an extension. It was developed on Facebook and made public. It has several forks ( uprofiler , Tideways ), fully compatible at the level of the output data format.
XHProf places timers around all function / method calls. Its use is associated with some overhead. But they are not so big and allow you to use it in production.
The result of XHProf is an array of elements in the following format:
$data = [
   'parentMethodName==>childMethodName' => [
        'ct' => 1'wt' => 8'cpu' => 11'mu' => 528'pmu' => 0
    ]
];
where
parentMethodNameand childMethodNameare the parent and child methods, respectively; ct- the number of calls in the context of the request; wt- request execution time (consists of the time spent by the processor and the waiting time for input / output or another service response); cpu- time spent by the processor to process the request; mu- change in memory consumption after calling the method; pmu- change of peak memory consumption after calling the method. Some other options are also possible.
XHProf also contains tools for visualizing the results thus obtained. For each profiling operation, we obtain a table with a set of parameters for each method.
For example,
bubble sort result
<?phpclassArrayGenerator{
    publicfunctiongetRandomArray(int $count): array{
        $array = [];
        for ($i = 0; $i < $count; $i++) {
            $array[] = rand(0, 1000);
        }
        return $array;
    }
}
classBubbleSorter{
    publicfunctionsort(&$array): void{
        $len = count($array);
        for ($i = 0; $i < $len ; $i++) {
            for ($j = 0; $j < $len - $i - 1; $j++) {
                if ($array[$j] > $array[$j + 1]) {
                    $this->swap($array[$j], $array[$j + 1]);
                }
            }
        }
    }
    privatefunctionswap(&$a, &$b): void{
        $tmp = $a;
        $a = $b;
        $b = $tmp;
    }
    publicfunctionisSorted(array $array): bool{
        $len = count($array);
        for ($i = 0; $i < $len - 1; $i++) {
            if ($array[$i] > $array[$i + 1]) {
                returnfalse;
            }
        }
        returntrue;
    }
}
classArrayPrinter{
    publicfunctionprint(array $array, string $delimiter = ' '): void{
        echo implode($delimiter, $array) . PHP_EOL;
    }
}
xhprof_enable();
$n = 10;
$arrayGenerator = new \ArrayGenerator();
$array = $arrayGenerator->getRandomArray($n);
$sorter = new BubbleSorter();
if (!$sorter->isSorted($array)) {
    $sorter->sort($array);
}
$printer = new \ArrayPrinter();
$printer->print($array);
$xhprof_data = xhprof_disable();

You can go inside each method to find out which methods how many resources are used.
You can also look at the call graph with highlighting the most

demanding methods: XHProf is useful for analyzing the performance of each request manually. But it is also important for us to see the whole picture. You need to understand how performance has changed over time. For this purpose, a tool was developed that profiles queries automatically and allows you to analyze them in the web interface.
Liveprof: aggregate results and store history
How to get profiling history?
First you need to configure the automatic launch of the profiler and save the results. Productivity is not constant, and from start to start it fluctuates. To avoid the influence of such fluctuations, we use the averaged data of several queries. As a result, we get aggregated results for each query, for example, minimum, maximum, average, and 95th percentile. It helps to find heavy things that may not be called for every request.
Our tool has both advantages and some limitations.
What can aggregator:
- Automatic profiling of every Nth query.
- Daily aggregation of collected profiles.
- Ability to view graphs of changes in each parameter measured by the profiler. For example, wt, cpu, mu, pmu, described above.
- View the performance change of any method for a certain interval.
- Flamegraph built on the latest aggregated data.
- Find queries that called a specific method.
Limitations:
- Since our tool is aggregating, it is impossible to know the performance of a single query (for example, the slowest one) - the results are averaged over the last 24 hours. But this is enough to assess the overall performance dynamics. If a query has subsided in execution speed, then the average value, 95th percentile, and maximum execution time will change.
- It is impossible to unambiguously restore the full call stack, since XHProf returns only unique parent-child pairs with the sum of the values of resources expended.
- Query time error due to XHProf overhead. The difference is not so big, but it must be taken into account when measuring the query execution time.
How to use profiler
- First, you need to connect the profiler to the site or script. The most convenient way to use the tool is to automatically launch the profiler :
php composer.phar require badoo/liveprof
# Run a script to configure database
LIVE_PROFILER_CONNECTION_URL=mysql://db_user:db_password@db_mysql:3306/Profiler?charset=utf8 php vendor/badoo/liveprof/bin/install.php
It supports PHP versions starting from 5.4, and its use involves minimal overhead, which allows it to be used in a combat environment. The tool automatically determines which profiler extension to use: XHProf , uprofiler or Tideways . At startup, you need to specify the parameters for connecting to the database and profiling settings.
An example of using in code with default settings:<?phpinclude'vendor/autoload.php'; \Badoo\LiveProfiler\LiveProfiler::getInstance()->start(); // Code is here
Profiling results are saved to the database. Once a day there is an aggregation process. To do this, select all records for a specific query for the day and calculate the aggregated functions for each of the parameters. Aggregation functions can be extended or redefined.
The following are now available:- at least one day;
- maximum per day;
- average value per day;
- 95th percentile per day.
- The aggregator web client is used to set up aggregation and view the results . The easiest way to install it is in the docker container:
git clone https://github.com/badoo/liveprof-ui.git cd liveprof-ui docker-compose up web - Before the first start, you need to configure the database connection parameters, the list of fields and the used aggregated functions in the src / config / services.yaml configuration file. Then run the installation script:
docker-compose exec web bash install.sh - It is necessary to register automatically running scripts of aggregation and cleaning of old data in crones:
# script aggregates all profiles for previous day, add it if you don't use a queue for aggregation jobs (parameter aggregator.use_jobs_in_aggregation=false)02 * * * docker-compose -f %PATH_TO_PROJECT%/docker-compose.yml run --rm --entrypoint '/usr/local/bin/php /app/bin/cli.php cron:aggregate-all-profiles' web # script removes old aggregated data, by default > 200 days01 * * * docker-compose -f %PATH_TO_PROJECT%/docker-compose.yml run --rm --entrypoint '/usr/local/bin/php /app/bin/cli.php cron:remove-old-profiles' web 200 - To fill in the test data, you can run the script:
docker-compose exec web php /app/bin/cli.php example:a-week-degradation
Interface Description
The web interface is available at: 127.0.0.1:8000.
By default, a page with a list of aggregated queries opens. It makes it easy to find a query of interest, sort all queries by any of the parameters, and also re-aggregate a specific query to view the latest results: The

page with a list of methods and performance graphs is most used when working with the tool. Allows you to go through the call stack, watch the consumption of each parameter, as well as graphs of performance changes for a certain interval: A

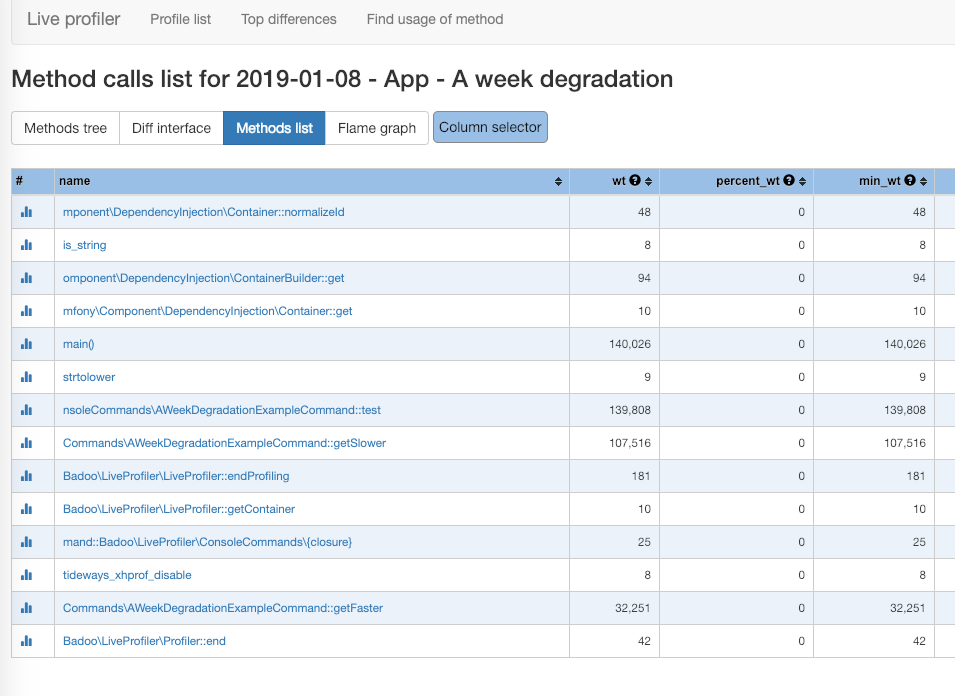
page with a full list of methods invoked allows you to quickly find the method of interest and see graphs by going to a page with graphs: A

page with a flamegraphThe last aggregated query allows you to visually identify the most difficult parts.
Using XHProf imposes some limitations on the accuracy of the result. This is due to the fact that the profiler does not return a full tree of calls, but only parent-child pairs. Moreover, if some pair of methods was called from different places of the application, then as a result we get the sum of the time spent. For a flamegraph you need to have a full call tree. When such a tree is restored, the values of the parameters are normalized taking into account the time spent by the parents.

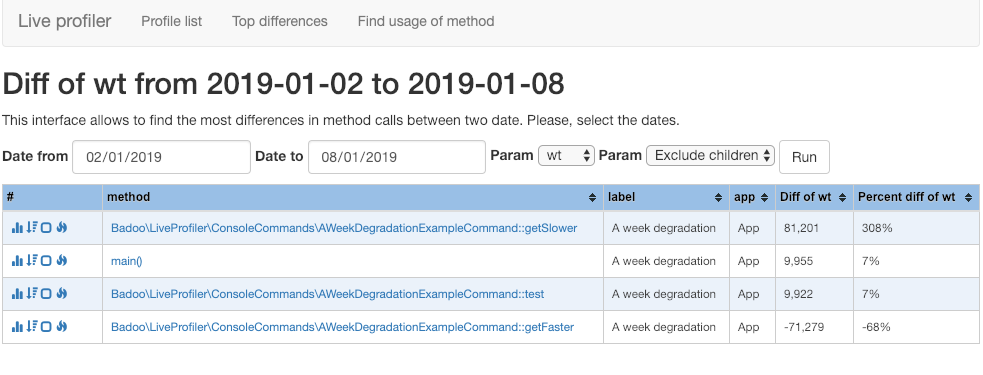
A page with a list of methods that have become slower during the selected interval.
Also, for each method, you can see which of the child calls affected the most performance. For example, in the screenshot below you can see that the method
ServiceApi::getAvailableServices()began to run 116 ms slower. The reason for this was the addition of a call ServiceApi::getGifts()(56 ms change) and an increase in the number of method calls ServiceApi::getConfigForList() from 1 to 5 (another 50 ms):
If it is not known in advance which query has the most noticeable performance change, then the page with the list of methods that have started to work slower will help bindings to a specific request: A page with a search for requests that called a specific method.
It allows you to compare execution time in different requests. It is also useful in finding unused code:


Customization options
The tool has wide possibilities for customization:
- You can add your own aggregation functions that calculate a certain value based on the transferred array of parameter values;
- You can change the database to store profiles and aggregated results (SQLite, MySQL and PostgreSQL are now supported, but you can also use others from the list available for Doctrine DBAL );
- You can override either the database connection manager or implement your own data retrieval methods;
- You can use the web interface both as a stand-alone project, and within any framework (for example, the control panel of the site). Example:
publicfunctionprofileListAction(){
    <i>//Some custom logic before</i>
    $this->checkPermissions();
    $App = new \Badoo\LiveProfilerUI\LiveProfilerUI();
    $Page = $App->getPage('profile_method_list_page');
    return $Page->setData($data)->render();
}
Conclusion
I hope our tool will be useful to other developers. It will provide an opportunity to check the performance change of any part of the code without using additional timers. It will also facilitate the optimization process, since now you can see what has affected the application performance over time.
It is available on GitHub: github.com/badoo/liveprof , the web interface is github.com/badoo/liveprof-ui .
The tool is in active development and may contain some errors. I hope that with the participation of the community he will become even better. Plans to add support for other profilers besides XHProf, as well as expand the list of supported databases.
Send feedback and questions on use to Telegram., bugs and pull requests - straight to GitHub . We welcome comments and suggestions!
Special thanks to Grigory for the idea and the first implementation.
