Clean, mark: how we taught chatbot to distinguish between client questions

 Anton Chaynikov, developer of Data Science, Redmadrobot
Hi, Habr! Today I will talk about thorns on the way to chatbot, which facilitates the work of the insurance company chat operators. Or rather, as we taught the bot to distinguish requests from one another through machine learning. What models they experimented with and what results they got. How did four approaches to cleaning and enriching the data of decent quality and five attempts to clean the data quality "indecent".
Task
+100500 customer calls per day come to the insurance company chat. Most of the questions are simple and repetitive, but the operators are no better at it, and customers still have to wait five to ten minutes. How to improve the quality of service and optimize labor costs so that operators have less routine work, and users have more pleasant sensations from quickly solving their questions?
And we will make chatbot. Let him read user messages, give simple instructions for simple cases, and ask standard questions for complex cases to get the information the operator needs. A live operator has a script tree — a script (or a block diagram) that says what questions users can ask and how to respond to them. We would take this scheme and put it in the chatbot, but what a bad luck - the chatbot does not understand humanly and does not know how to relate the user's question to the script branch.
So, we will teach him with the help of the good old machine learning. But you can not just take a piece of data generated by users, and teach him a model of decent quality. To do this, you need to experiment with the architecture of the model, to clean the data, and sometimes to collect it again.
How to learn bot:
- Let us consider the variants of the models: how the dataset size, text vectorization details, dimension reduction, classifier and final accuracy are combined.
- Clean up decent data: find the classes that you can safely throw; find out why the last six months of markup better than the previous three; determine where the model is lying, and where the markup; find out what typos can be useful for.
- Let's clean up the “indecent” data: let's see when clustering is useful and useless, how users and operators talk, when it's time to stop suffering and go collect the markup.
Texture
We had two clients - insurance companies with online chat rooms and chatboat training projects (we’re not going to call them, it doesn’t matter), with dramatically different data quality. Well, if half of the problems of the second project were solved by manipulations from the first. Details below.
From a technical point of view, our task is to classify texts. This is done in two stages: first, the texts are vectorized (using tf-idf, doc2vec, etc.), then the classifying model is studied on the vectors (and classes) - random forest, SVM, neural network, and so on. and so on
Where does the data come from:
- Sql-upload history messages in the chat. Relevant upload fields: text messages; author (client or operator); group messages in dialogs; timestamp; category of client’s application (questions about CTP, CASCO, LCA; questions about the site’s work; questions about loyalty programs; questions about changing insurance conditions, etc.).
- The tree of scenarios, or the sequence of questions and answers of operators to customers with different requests.
Without validation, of course, nowhere. All models were trained on 70% of the data and evaluated on the results for the remaining 30%.
Quality metrics for the models we used:
- When training: logloss, for differentiability;
- When writing reports: classification accuracy on a test sample, for simplicity and clarity (including for the customer);
- When choosing a direction for further action: the intuition of the data scientist, who is closely looking at the results.
Experiments with models
Rarely, when the task is immediately clear which model will give the best results. So here: no experiments anywhere.
We will try vectorization options:
- tf-idf on separate words;
- tf-idf on triplets of characters (hereinafter: 3-grams);
- tf-idf on 2-, 3-, 4-, 5-grams separately;
- tf-idf on 2-, 3-, 4-, 5-grams, taken all together;
- All of the above + bringing words in the source text to the dictionary form;
- All of the above + dimension reduction using the Truncated SVD method;
- With the number of measurements: 10, 30, 100, 300;
- doc2vec, trained on the body of texts from the task.
The classification options on this background look rather poor: SVM, XGBoost, LSTM, random forests, naive bayes, random forest on top of the SVM and XGB predictions.
And although we checked the reproducibility of the results on three independently assembled datasets and their fragments, we will only vouch for the wide applicability.
The results of the experiments:
- In the chain of “preprocessing-vectorization-lowering dimensionality-classification,” the effect of the choice at each step is almost independent of the other steps. What is very convenient, you can not go through a dozen options for each new idea and use the best known option at every step.
- tf-idf in words loses to 3 grams (accuracy 0.72 vs 0.78). 2-, 4-, 5-grams lose to 3-grams (0.75–0.76 vs 0.78). {2; 5} -grams all together gain very little from 3-grams. Taking into account the sharp increase in the required memory, for training, we decided to neglect the gain of 0.4% accuracy.
- Compared to tf-idf, all doc2vec varieties were helpless (accuracy 0.4 and lower). It would be worth trying to train him not on the corpus of the task (~ 250000 texts), but on a much larger one (2.5–25 million texts), but so far, alas, have not reached the hands.
- Truncated SVD did not help. Accuracy increases monotonically with increasing measurements, smoothly reaching accuracy without TSVD.
- Among the classifiers, XGBoost wins by a significant margin (+ 5–10%). The closest competitors are SVM and random forests. Naive Bayes is not a competitor even to random forests.
- The success of LSTM is highly dependent on the size of the dataset: on a sample of 100,000 objects, it can compete with XGB. On a sample of 6000 - lagging behind along with Bayes.
- A random forest over SVM and XGB either always agrees with XGB, or makes more mistakes. This is very sad, we hoped that SVM would find in the data at least some regularities inaccessible to XGB, but alas.
- At XGBoost everything is difficult with stability. For example, updating it from version 0.72 to 0.80 inexplicably reduced the accuracy of the models being trained by 5–10%. And one more thing: XGBoost supports changing workout parameters during a workout and compatibility with the standard scikit-learn API, but strictly separately. You cannot do both together. I had to fix it.
- If you bring words to vocabulary form, it improves the quality a bit, in combination with tf-idf in words, but it is useless in all other cases. In the end, we turned it off to save time.
Experience 1. Data cleaning, or what to do with markup
Chat operators are just people. In determining the category of user query, they often make mistakes and differently understand the boundaries between categories. Therefore, the source data must be ruthlessly and intensively cleaned.
Our data on the training model on the first project:
- History of online chat messages for several years. This is 250,000 messages in 60,000 dialogs. At the end of the dialogue, the operator chose the category to which the user's appeal relates. In this dataset about 50 categories.
- Script tree. In our case, the operators did not have working scripts.
What exactly the data is bad, we formulated as hypotheses, then checked and, where we could, corrected. Here's what happened:
Approach the first. From the entire huge list of classes, you can safely leave 5-10.
We reject small classes (<1% of sample): little data + small impact. We combine difficult classes, to which the operators still react the same way. For example:
'dms' +' how to sign up for a doctor '+' question about filling the program '
' cancellation '+' status of cancellation '+' cancellation of a paid policy "
'question about extending' + 'how to extend the policy?'
Next, we throw out classes like “other”, “other” and the like: they are useless for chatbot (redirect to the operator anyway), and at the same time spoil the accuracy, because 20% (30, 50, 90) of requests are classified by operators not where it should be and here. Now we throw out a class with which the chatbot cannot work (yet).
Result: in one case - growth from accuracy 0.40 to 0.69, in the other - from 0.66 to 0.77.
Approach the second. At the beginning of the chat, the operators themselves are poorly aware of how to choose a class for the user's appeal, so there is a lot of “noise” and errors in the data.
Experiment: we take only the last two (three, six, ...) months of dialogues and train the model on
them.
Result: in one remarkable case, the accuracy increased from 0.40 to 0.60, in the other - from 0.69 to 0.78.
Approach the third. Sometimes an accuracy of 0.70 means not “in 30% of cases the model is mistaken”, but “in 30% of cases the marking is lying, and the model corrects it very reasonably”.
You cannot test this hypothesis with metrics such as accuracy or logloss. For the purposes of the experiment, we limited ourselves to the data scientist's gaze, but in the ideal case, it is necessary to re-map datasets in a qualitative way, without forgetting about cross-training.
To work with such samples, we came up with the process of "iterative enrichment":
- Split datasets into 3-4 fragments.
- To train the model on the first fragment.
- Predict the trained model classes second.
- Closely look at the predicted classes and the degree of confidence of the model, choose the boundary value of confidence.
- Remove from the second fragment texts (objects), predicted with certainty below the boundary, to train the model on this.
- Repeat until you get bored or fragments run out.
On the one hand, the results are excellent: the model of the first iteration has an accuracy of 70%, the second - 95%, the third - 99 +%. A close look at the results of the predictions fully confirm this accuracy.
On the other hand, how to systematically make sure in this process that subsequent models are not learned from the errors of the previous ones? There is an idea to test the process on a manually “noisy” dataset with high-quality source markup, such as MNIST. But time for this, alas, was not enough. And without verification, we did not dare to launch an iterative enrichment and the resulting models in production.
Approach the fourth. Dataset can be expanded - and thus increase the accuracy and reduce retraining, adding to the existing texts many variants of typos.
Types of typos - doubling a letter, skipping a letter, rearranging adjacent letters in places, replacing a letter with a neighboring one on the keyboard.
Experiment: The proportion of p letters in which a typo will occur: 2%, 4%, 6%, 8%, 10%, 12%. Increase dataset: usually up to the size of 60,000 replicas. Depending on the initial size (after the filters), this meant an increase of 3–30 times.
Result: depends on dataset. On a small dataset (~ 300 replicas), 4–6% of typos give a stable and significant increase in accuracy (0.40 → 0.60). On big it is worse. With a share of misprints of 8% or more, the texts turn into nonsense and the accuracy drops. With an error rate of 2–8%, accuracy varies in the range of a few percent, very rarely exceeds accuracy without typing errors and, by sensation, it is not worth increasing the training time several times.
As a result, we obtain a model that distinguishes 5 classes of references with an accuracy of 0.86. We coordinate with the client the texts of questions and answers for each of the five forks, fasten the texts to the chatbot, send it to QA.
Experience 2. Knee-high in the data, or what to do without markup
Having obtained good results on the first project, we approached the second with all confidence. But, fortunately, we have not forgotten how to be surprised.
What we met:
- Tree of scenarios with five branches, agreed with the client about a year ago.
- A tagged sample of 500 messages and 11 classes of unknown origin.
- A selection of 220,000 messages, 21,000 dialogs and 50 other classes, marked up by chat operators.
- SVM-model, trained on the first sample, with an accuracy of 0.69, which was inherited from the previous team of data scientists. Why SVM, history is silent.
First of all, we look at the classes: in the script tree, in the sample of the SVM model, in the main sample. And that's what we see:
- The classes of the SVM models roughly correspond to the script branches, but they do not correspond at all to the classes from the large sample.
- The scenario tree was written on business processes a year ago, and became outdated almost to no avail. The SVM model is outdated with it.
- The two largest classes in the large sample are Sales (50%) and Others (45%).
- Of the five next largest classes, three are as common as Sales.
- The remaining 45 classes contain less than 30 dialogues each. Those. We do not have a script tree, no list of classes, and no markup.
What to do in such cases? We rolled up our sleeves and went on our own to pull out the classes and markup from the data.
Attempt the first. Let's try to cluster user questions, i.e. The first messages in the dialogue, with the exception of greetings.
We are checking. We vector replicas counting 3 grams. We lower the dimension to the first ten measurements of TSVD. Cluster agglomerative clustering with Euclidean distance and the Ward objective function. Once again, we lower the dimension using t-SNE (to two dimensions, so that the results can be viewed with the eyes). We draw replica points on the plane, painting in the color of clusters.
Result: fear and horror. Sane clusters, we can assume that there is no:
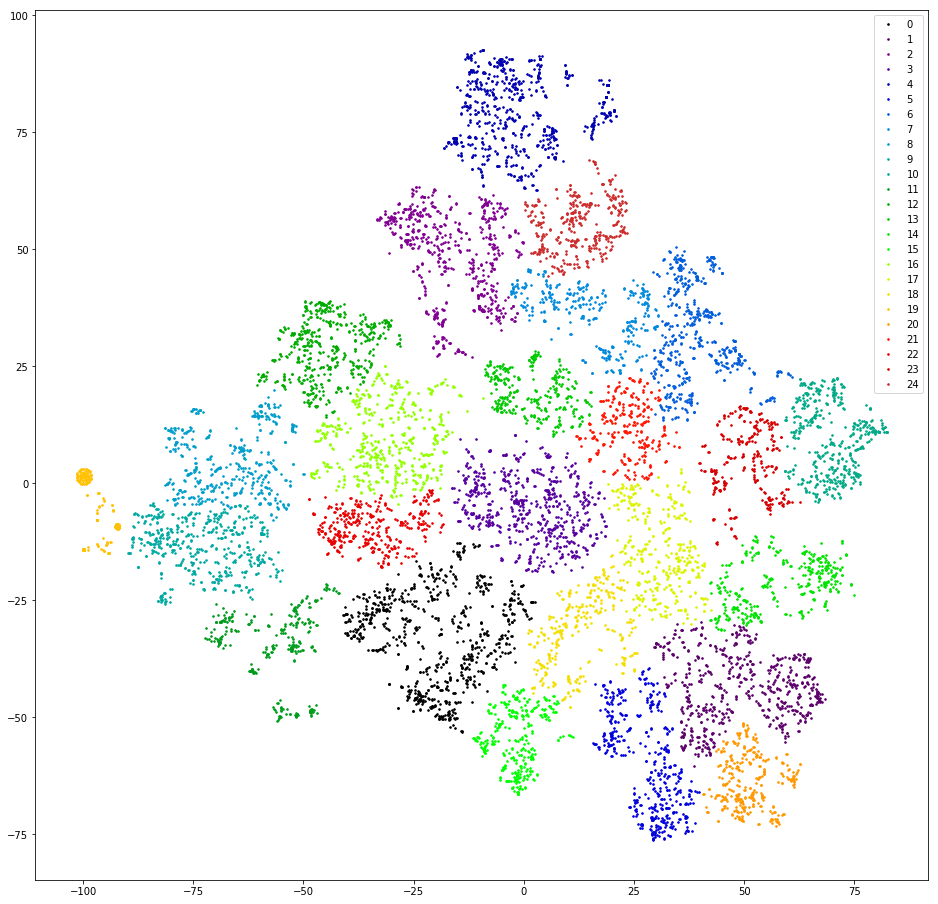
Almost not - there is one, orange on the left, this is because all the messages in it contain a 3-gram "@". This 3G is a preprocessing artifact. Somewhere in the process of filtering the punctuation marks “@” was not only not filtered out, but also overgrown with spaces. But the artifact is useful. In this cluster were users who first write their email. Unfortunately, only by the presence of mail it is not at all clear what the user's request is. Moving on.
Attempt the second. What if operators often respond with more or less standard links?
We are checking. We pull out link-like substrings from operator messages, we slightly edit the links, differing in spelling, but identical in meaning (http / https, / search? City =% city%), we consider the link frequencies.
Result: unpromising. First, operators respond with links to only a small proportion of requests (<10%). Secondly, even after manual cleansing and filtering out the links that have been met once, there are more than thirty of them. Thirdly, there is no particular similarity in the behavior of users who end the dialogue with a link.
Attempt the third. Let's look for the standard answers of the operators - what if they are indicators of some sort of message classification?
We are checking. In each dialogue, we take the last remark of the operator (not counting the farewells: “I can help with something else,” etc.) and consider the frequency of the unique replicas.
Result: promising, but inconvenient. 50% of operators' responses are unique, another 10–20% are met twice, the remaining 30–40% are covered by a relatively small number of popular templates. Relatively small - about three hundred. A close look at these templates shows that many of them are variants of the same meaning of the answer - where they differ by one letter, where by one word, and by one paragraph. I would like to group these similar answers.
Attempt fourth. We cluster the last replicas of the operators. These clusters are much better:
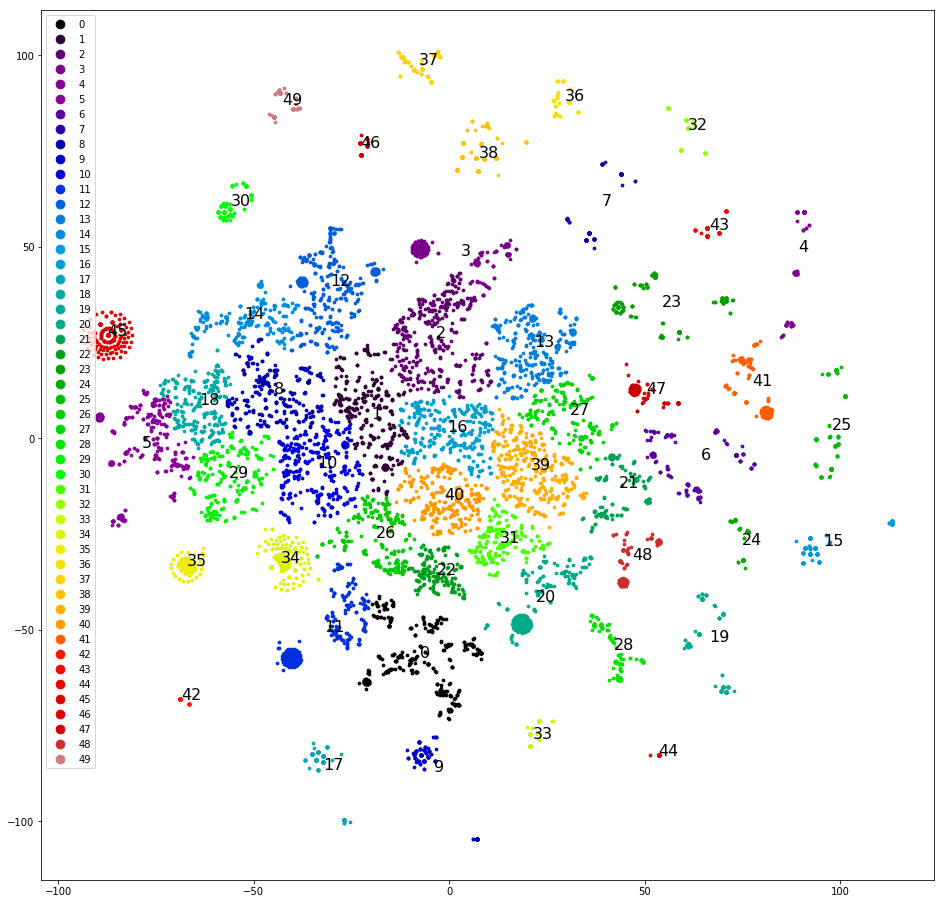
With this you can already work.
Clustering and drawing replicas on the plane, as in the first attempt, manually defining the most distinct clusters, removing them from the dataset and clustering again. After the separation of about half of the dataset, the clear clusters end, and we begin to think about which classes to assign to them. We scatter clusters according to the original five classes - the sample is “skewed”, and three of the five original classes do not receive a single cluster. Poorly. We scatter clusters in five classes, which we plan randomly, to: “call”, “come”, “wait for an answer a day”, “problems with captcha”, “other”. The skew is smaller, but the accuracy is only 0.4–0.5. Bad again. We assign each of the 30+ clusters its own class. The sample is again “skewed”, and the accuracy is again 0.5, although about five selected classes have decent accuracy and completeness (0.8 and higher).
Attempt the fifth. We need all the ins and outs of clustering. Extract the full clustering dendrogram instead of the top thirty clusters. We save it in a format that is accessible to client analysts, and we help them to make markup - we sketch the list of classes.
For each message, we compute a chain of clusters that include each message, starting from the root. We build a table with columns: text, id of the first cluster in the chain, id of the second cluster in the chain, ..., id of the cluster corresponding to the text. We save the table in csv / xls. Then you can work with it with office tools.
We give the data and a sketch of the list of classes for marking the client. Client analysts have redefined ~ 10,000 first user posts. We have already learned from experience, asked to mark each message at least twice. And for good reason - 4000 of these 10,000 have to be thrown away, because the two analysts have marked out differently. On the remaining 6,000, we rather quickly repeated the successes of the first project:
- Baseline: we do not filter in any way - the accuracy is 0.66.
- We unite the classes identical from the point of view of the operator. We get the accuracy of 0.73.
- We remove the class "Other" - the accuracy increases to 0.79.
The model is ready, now you need to draw a script tree. For reasons that we will not undertake to explain, we did not have access to the scripts of operator responses. We were not taken aback, pretended to be users, and for a couple of hours in the field we collected response templates and clarifying questions from operators for all occasions. Decorated them in a tree, packed in a bot and went to test. Customer approved.
Conclusions, or that experience has shown:
- You can experiment with parts of the model (pre-processing, vectorization, classification, etc.) separately.
- XGBoost still reigns, although if you need something unusual from him, you have problems.
- The user is a peripheral device of random input, so it is necessary to clean user data.
- Iterative enrichment is cool, albeit dangerous.
- Sometimes it is necessary to give the data back to the markup client. But do not forget to help him get a quality result.
To be concluded.