We are looking for problems with site conversion in Google Spreadsheets
Hello, Habr! My name is Dmitry Okunev, I work as a product manager in the fintech company ID Finance. This is the company's first blog post. Here we will share experience, including international expertise. Go.
In most online businesses, site conversion is the cornerstone of turning leads into customers. We at ID Finance are making a huge number of changes that can affect CR both positively and negatively, so without a constant, literally daily tracking of the effectiveness of the conversion funnel, it would be problematic.
There are many different approaches to measuring the conversion of your site, for such tracking we have developed our own dashboard format, which is based on a daily automated uploading of a funnel from Google Analytics. Why exactly this way?
History knows very few cases when a product from the first iteration begins to convert incoming traffic to customers as efficiently as we would like. We set traps ourselves: inefficient and complex UX, a large number of forms to fill out, bugs, the number of which grows with each delivery - you can and should work with all this. But in order to understand what to work with, problems must first be: a) localized, b) constantly monitored, because both the product and the quality of traffic are constantly changing. Having a tool at hand to display the current situation, you can quickly make decisions on improvement, track problems, implement additional tracking (if they affect user flow).
Now each of our projects (the company operates in eight countries under four brands) contains its own report, each of which contains 10-15 dashboards covering all the main user cases for both new and repeat customers, including the mobile application.
Any funnel on the site can be described as a sequence of some user actions. Google Analytics provides an opportunity to describe this sequence as a segment.
The segments themselves are divided into conditions and sequences, and are also defined by the scope: users (users) or sessions (sessions). To obtain the desired user group, you can specify intersections (impose a condition on the sequence). For example, if we want to get a picture of the customer’s funnel only from mobile devices, with participants in a certain variation of the AB test.
Google Analytics provides a special Core Reporting API to access the data we need. You can familiarize yourself with it at the link. We will not dwell on the syntax of queries in detail here - the Google documentation will in any case be much more comprehensive.
Here are just a few examples of the segment that can be requested in the Core Reporting API:
It is easy to guess that if we want to look at the conversion of the transition from the page / registration / step1 to / registration / step2, and then from the second to the third and so on, we need to sequentially make a request to step 1, then to step 1 and step 2, and so on until the end. To do this, we use a small script, which is described below.
Through many experiments, we came to the following dashboard format - for each project, its own Google Spreadsheet document is created with a set of funnels of interest to us and a couple of pages for the configuration.
Here it is in its original state (plus a simple example). Link .
The file is in read-only mode, so the easiest way is to copy it to yourself and conduct all experiments from there.
File structure:
The 'Funnels' sheet contains descriptions of all segments, in our case, funnels describing various user flow. For example, there will certainly be described the flow of filling out the questionnaire for a new client, all the ways for repeated ones (they may have several entry points), a funnel for pre-approved customers, etc.
Parameters of this sheet:
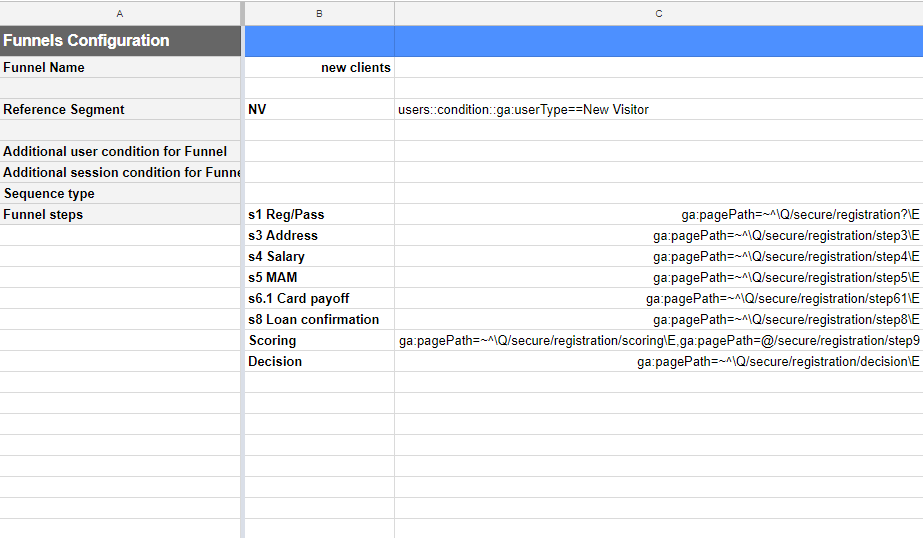
For example, filling out a new questionnaire will look like this:

When a report is uploaded, all the rows from the right column will be merged through the characters '- >>', which in the GA syntax means a loose sequence of actions (each next step is searched after the previous, but not necessarily immediately). The report also supports the “immediately follows” sequence format; for this, the characters '->' must be set at the beginning of the desired line. That is, the string 'ga: pagePath = ~ ^ \ Q / secure / registration / step4 \ E' tells the script to download the number of users who for the given period were on the URL / secure / registration / step4 , and before that on / secure / registration / step3 , but not necessarily in a row. The string is '-> ga: pagePath = ~ ^ \ Q / secure / registration / step4 \ E'make the script search for a strict sequence where the user visited questionnaire step 3 and immediately went to step 4 (it is understood that no other calls, including events, were sent between them either).
'Configuration' sheet - here we store the report configurations. Each report is uploaded and saved in a separate sheet of the document.
Sheet Options:
The lines below, up to 'Funnels', contain GA response data, nothing needs to be filled in here.
Funnels - here we select one or several funnels from the 'Funnels' sheet, on the basis of which the report will be unloaded.
Go to Tools - Script Editor. Here is a small script for uploading data:
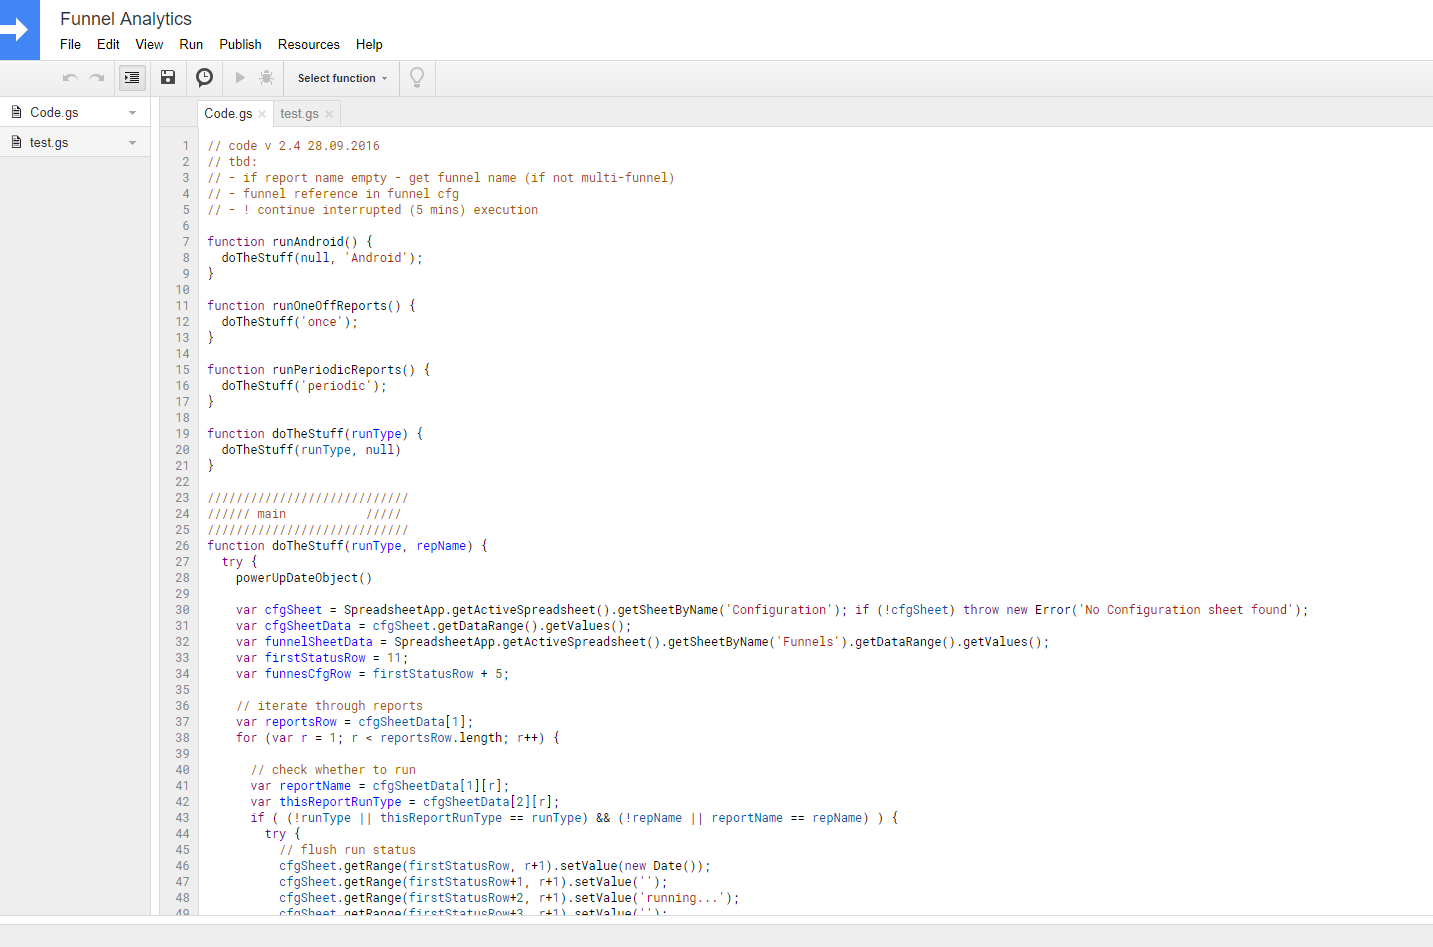
The script has not been updated for quite some time and there are still a lot of improvement plans for it. For example, if the unloading time exceeds 5 minutes, the script may stop giving an error - you must continue unloading from this moment on with a new request.
We post it “as is”, you can use it, modify it to your liking or write your own.
To run the script, you first need to give it permission to access your Google Analytics profile and open access to the GA API in the Google Cloud Console. When you run the script for the first time, you will receive an error with a link in the 'Last Run Status' line of the 'Configuration' sheet, follow the link and enable access to the API. If necessary, you can also increase quotas for API requests in the same place if there are not enough current ones.

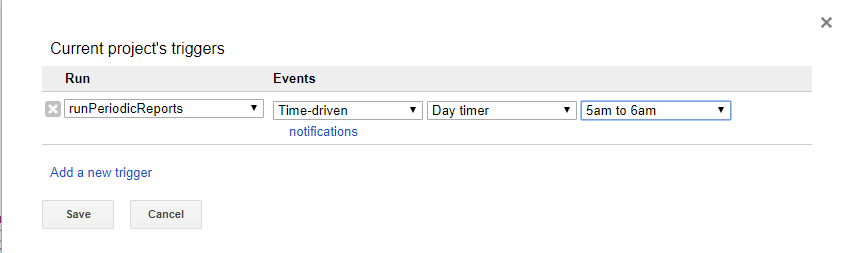
The main cases that we solve with its help - periodic and one-time unloading of certain reports - are covered by the functions 'runPeriodicReports' and 'runOneOffReports'. To run the 'Periodic' report, use the 'Current Project's Triggers' function, where we select 'runPeriodicReports' and the frequency of the launch.
Suppose we are interested in how the funnel of the new customer profile has changed over the course of a month. To do this, create the desired sequence on the sheet 'Funnels'. Let it be the sequence described above - let's call it 'new clients'.
Now create a report configuration that will upload us data on the 'new clients' funnel. To do this, we select the period from January 10, 2018 to January 31, 2018, we set the unloading period 'daily' and the frequency 'once'.

Now go to 'Tools' - 'Script Editor', select 'runOffReports' (because we have chosen the frequency of unloading 'Once', and click 'Run'.

We will create a new sheet on which data will appear after a while: number users at each stage of the funnel.

We divide each next step into the previous one with the simplest formula and translate the result in percent to get the percentage conversion. We’ll also add aggregated conversion, let it be the value of decision (our 'thank you page') / s1 - the way our profile works from start to finish. This will be useful to the marketing department.

Build the graphs.
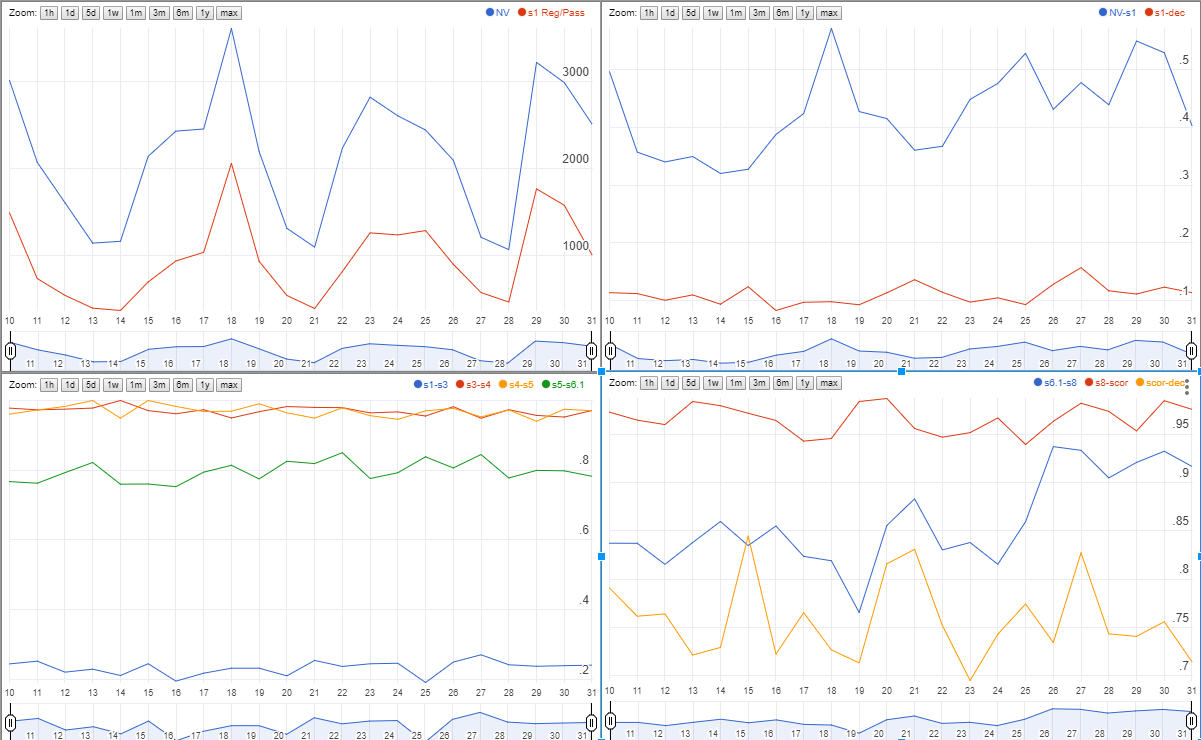
It can be seen that on January 26, at the next delivery, we improved the conversion closer to the end of the funnel. The conversion at the first step of the funnel is rather low - the place where the user is created in the database. This may be the traffic structure (many non-target clients), and UI problems.
Sometimes the picture is less pleasant.

It can be seen that some changes worsened our conversion in several places. It makes sense to look at the recordings of sessions, give the QA task to look for bugs, and perhaps think about how much we made the right changes in these places of the product.
If we are satisfied with the report, set the 'Start Project Triggers' launch frequency to daily (set the start time at night so that there is already something to see in the morning), and put it on the 'Configuration' sheet in the 'Periodic' mode. From now on, our schedule will be updated daily.
In this way, you can not only get daily conversion charts. We use it to quickly evaluate AB tests, find problems with traffic partners and some other tasks. Of course, it’s not worth it to be limited to one, and you certainly shouldn’t refuse to look at the numbers in your database in favor of this report, but you can safely use it to search for bottlenecks in your funnel and monitor it.
If you use your own custom solutions for conversion tracking, share in the comments - we will be happy to discuss!
Fintech Holding ID Financespecializes in data science and credit scoring. As an application of our expertise in the field of data collection and analysis, as well as building scoring models, the company launched its own financial services under the brands MoneyMan, Solva, Plazo and AmmoPay. These are projects of lending to individuals and microbusiness, automation of POS-loans and installment programs. We operate in eight countries on four continents, including Europe, Asia and both Americas. The company is headquartered in Barcelona, the R&D center in Minsk, and a team of data analysts and risk managers in Moscow. In addition to me, about 600 people work in the company. It may seem that we are a little-known company. But it is not so. They know us well in the West. Forbes, Business Insider, Finextra, Venture Beat, Crowdfund Insider, The Banker and BBC write about us, for example. Thanks to the guys from PR, we also publish in Russian-language media: Forbes, VC, Roem, RusBase, etc. Several times a month we will publish our posts, share our news, successful and not quite cases. We will be in touch!
In most online businesses, site conversion is the cornerstone of turning leads into customers. We at ID Finance are making a huge number of changes that can affect CR both positively and negatively, so without a constant, literally daily tracking of the effectiveness of the conversion funnel, it would be problematic.
There are many different approaches to measuring the conversion of your site, for such tracking we have developed our own dashboard format, which is based on a daily automated uploading of a funnel from Google Analytics. Why exactly this way?
- Google Analytics is session analytics, but in most cases we are interested in users, i.e. unique clientID. This data is easiest to obtain by querying the users metric from GA.
- A dashboard in our case is a regular Google Spreadsheet file that can be easily shared, set permissions for different users, and reading it does not require much experience working with analytics.
- Report data is suitable for periodic reports to stakeholders, they are easily read and updated, they immediately show the conversion changes in the product.
- The flexible report format allows, in addition to monitoring CR, to perform a number of other tasks: quickly find problem areas of user flow, measure AB tests, test hypotheses, perform quick calculations on data, etc.
Why is this needed?
History knows very few cases when a product from the first iteration begins to convert incoming traffic to customers as efficiently as we would like. We set traps ourselves: inefficient and complex UX, a large number of forms to fill out, bugs, the number of which grows with each delivery - you can and should work with all this. But in order to understand what to work with, problems must first be: a) localized, b) constantly monitored, because both the product and the quality of traffic are constantly changing. Having a tool at hand to display the current situation, you can quickly make decisions on improvement, track problems, implement additional tracking (if they affect user flow).
Now each of our projects (the company operates in eight countries under four brands) contains its own report, each of which contains 10-15 dashboards covering all the main user cases for both new and repeat customers, including the mobile application.
How it works?
Any funnel on the site can be described as a sequence of some user actions. Google Analytics provides an opportunity to describe this sequence as a segment.
The segments themselves are divided into conditions and sequences, and are also defined by the scope: users (users) or sessions (sessions). To obtain the desired user group, you can specify intersections (impose a condition on the sequence). For example, if we want to get a picture of the customer’s funnel only from mobile devices, with participants in a certain variation of the AB test.
Google Analytics provides a special Core Reporting API to access the data we need. You can familiarize yourself with it at the link. We will not dwell on the syntax of queries in detail here - the Google documentation will in any case be much more comprehensive.
Here are just a few examples of the segment that can be requested in the Core Reporting API:
- 1) Get a list of all users from mobile devices that were on the page / registration / step1:
users :: condition :: ga: deviceCategory == mobile; ga: pagePath == / registration / step1 - 2) Get a list of users who were on the page / registration / step1, and then on the page / registration / step2:
users :: sequence :: ga: pagePath == / registration / step1; - >> ga: pagePath == / registration / step2
It is easy to guess that if we want to look at the conversion of the transition from the page / registration / step1 to / registration / step2, and then from the second to the third and so on, we need to sequentially make a request to step 1, then to step 1 and step 2, and so on until the end. To do this, we use a small script, which is described below.
Our Spreadsheet
Through many experiments, we came to the following dashboard format - for each project, its own Google Spreadsheet document is created with a set of funnels of interest to us and a couple of pages for the configuration.
Here it is in its original state (plus a simple example). Link .
The file is in read-only mode, so the easiest way is to copy it to yourself and conduct all experiments from there.
File structure:
The 'Funnels' sheet contains descriptions of all segments, in our case, funnels describing various user flow. For example, there will certainly be described the flow of filling out the questionnaire for a new client, all the ways for repeated ones (they may have several entry points), a funnel for pre-approved customers, etc.
Parameters of this sheet:
- Reference Segment - reference segment. Here you can enter, for example, all customers with the first session on the site. This segment will not stick together in a sequence and is requested separately. It is optional.
- Additional user condition for Funnel - an additional user parameter that can be applied to the funnel (for example, a variation of the AB test, it needs to be written in GA, for example, in one of Custom Dimensions)
- Additional session condition for Funnel - an additional session parameter that can be applied to the funnel (for example, ga: source == google; ga: medium == cpc - only users from Google contextual advertising).
- Sequence type - users or sessions. The type of sequence to be requested, users or sessions. By default, users will be prompted.
- Funnel steps are what we have gathered for. Here we consistently introduce all the steps of the funnel that interest us. A step can be any type of hit (hit), in our case these are events (event) and pageviews (pageview).
For example, filling out a new questionnaire will look like this:
When a report is uploaded, all the rows from the right column will be merged through the characters '- >>', which in the GA syntax means a loose sequence of actions (each next step is searched after the previous, but not necessarily immediately). The report also supports the “immediately follows” sequence format; for this, the characters '->' must be set at the beginning of the desired line. That is, the string 'ga: pagePath = ~ ^ \ Q / secure / registration / step4 \ E' tells the script to download the number of users who for the given period were on the URL / secure / registration / step4 , and before that on / secure / registration / step3 , but not necessarily in a row. The string is '-> ga: pagePath = ~ ^ \ Q / secure / registration / step4 \ E'make the script search for a strict sequence where the user visited questionnaire step 3 and immediately went to step 4 (it is understood that no other calls, including events, were sent between them either).
'Configuration' sheet - here we store the report configurations. Each report is uploaded and saved in a separate sheet of the document.
Sheet Options:
- Run? - Available options are Periodic and Once. The first option is chosen if we want to do a periodic update of the report. In this case, one line at the top with new data corresponding to the selected period will be added to the corresponding sheet during execution. Once - for a single run. In this case, the whole sheet will be overwritten, so you need to be careful with choosing this option. It is better to create a new report in the 'Once' mode, and then simply switch to 'Periodic' if you want to continue uploading by timer.
- View (Profile) ID - View ID from Google Analytics, from where we upload data. It is recorded in the format 'ga: XXXXXXXXX'.
- Start / End Date - for what period we upload data. It will be ignored during repeated runs of the Periodic report - it will be based on dates in the upload itself.
- Period Type - options are available 'daily' - daily, 'WoD' - a sliding window of 7 days (we use in the reports for cases when there is little traffic, and 'daily' shows a lot of volatility), 'WoW' - calendar week, 'Whole Period '- get data for the entire period in one line (for obvious reasons it is not compatible with the reports' periodic').
- High precision? - level of data sampling. You can read more about it, for example, here . By default 'yes', it is better to leave it that way.
The lines below, up to 'Funnels', contain GA response data, nothing needs to be filled in here.
Funnels - here we select one or several funnels from the 'Funnels' sheet, on the basis of which the report will be unloaded.
Script to upload
Go to Tools - Script Editor. Here is a small script for uploading data:
The script has not been updated for quite some time and there are still a lot of improvement plans for it. For example, if the unloading time exceeds 5 minutes, the script may stop giving an error - you must continue unloading from this moment on with a new request.
We post it “as is”, you can use it, modify it to your liking or write your own.
To run the script, you first need to give it permission to access your Google Analytics profile and open access to the GA API in the Google Cloud Console. When you run the script for the first time, you will receive an error with a link in the 'Last Run Status' line of the 'Configuration' sheet, follow the link and enable access to the API. If necessary, you can also increase quotas for API requests in the same place if there are not enough current ones.
The main cases that we solve with its help - periodic and one-time unloading of certain reports - are covered by the functions 'runPeriodicReports' and 'runOneOffReports'. To run the 'Periodic' report, use the 'Current Project's Triggers' function, where we select 'runPeriodicReports' and the frequency of the launch.
Usage example
Suppose we are interested in how the funnel of the new customer profile has changed over the course of a month. To do this, create the desired sequence on the sheet 'Funnels'. Let it be the sequence described above - let's call it 'new clients'.
Now create a report configuration that will upload us data on the 'new clients' funnel. To do this, we select the period from January 10, 2018 to January 31, 2018, we set the unloading period 'daily' and the frequency 'once'.
Now go to 'Tools' - 'Script Editor', select 'runOffReports' (because we have chosen the frequency of unloading 'Once', and click 'Run'.
We will create a new sheet on which data will appear after a while: number users at each stage of the funnel.
We divide each next step into the previous one with the simplest formula and translate the result in percent to get the percentage conversion. We’ll also add aggregated conversion, let it be the value of decision (our 'thank you page') / s1 - the way our profile works from start to finish. This will be useful to the marketing department.
Build the graphs.
It can be seen that on January 26, at the next delivery, we improved the conversion closer to the end of the funnel. The conversion at the first step of the funnel is rather low - the place where the user is created in the database. This may be the traffic structure (many non-target clients), and UI problems.
Sometimes the picture is less pleasant.
It can be seen that some changes worsened our conversion in several places. It makes sense to look at the recordings of sessions, give the QA task to look for bugs, and perhaps think about how much we made the right changes in these places of the product.
If we are satisfied with the report, set the 'Start Project Triggers' launch frequency to daily (set the start time at night so that there is already something to see in the morning), and put it on the 'Configuration' sheet in the 'Periodic' mode. From now on, our schedule will be updated daily.
Conclusion
In this way, you can not only get daily conversion charts. We use it to quickly evaluate AB tests, find problems with traffic partners and some other tasks. Of course, it’s not worth it to be limited to one, and you certainly shouldn’t refuse to look at the numbers in your database in favor of this report, but you can safely use it to search for bottlenecks in your funnel and monitor it.
If you use your own custom solutions for conversion tracking, share in the comments - we will be happy to discuss!
A little bit about us
Fintech Holding ID Financespecializes in data science and credit scoring. As an application of our expertise in the field of data collection and analysis, as well as building scoring models, the company launched its own financial services under the brands MoneyMan, Solva, Plazo and AmmoPay. These are projects of lending to individuals and microbusiness, automation of POS-loans and installment programs. We operate in eight countries on four continents, including Europe, Asia and both Americas. The company is headquartered in Barcelona, the R&D center in Minsk, and a team of data analysts and risk managers in Moscow. In addition to me, about 600 people work in the company. It may seem that we are a little-known company. But it is not so. They know us well in the West. Forbes, Business Insider, Finextra, Venture Beat, Crowdfund Insider, The Banker and BBC write about us, for example. Thanks to the guys from PR, we also publish in Russian-language media: Forbes, VC, Roem, RusBase, etc. Several times a month we will publish our posts, share our news, successful and not quite cases. We will be in touch!