February 28, 2018 at 01:20
Richard Hamming: Chapter 29. You Get What You Measure
- Transfer
“The goal of this course is to prepare you for your technical future.”
 Hi, Habr. Remember the awesome article “You and Your Work” (+219, 2365 bookmarked, 360k reads)?
 So Hamming (yes, yes, self-checking and self-correcting Hamming codes ) has a whole book written based on his lectures. Let’s translate it, because the man is talking business.
This book is not just about IT, it is a book about the thinking style of incredibly cool people. “This is not just a charge of positive thinking; it describes conditions that increase the chances of doing a great job. ”
We have already translated 12 (out of 30) chapters.
Thanks for the translation to Valery Dmitrushchenkov, who responded to my call in the "previous chapter". Who wants to help with the translation - write in a personal email or mail [email protected](By the way, we also launched the translation of another cool book - “The Dream Machine: The History of the Computer Revolution” )
Chapter 29. You Get What You Measure
It may seem to you that the title of the chapter implies that with careful measurement we will get an accurate result and not otherwise, but in fact, it refers to a much more subtle thing - the measurement method you choose affects the result to a large extent. Recall Eddington's story of fishermen fishing net. They measured the fish caught and came to the conclusion that there is a minimum size of fish swimming in the sea. That is, the tool you use significantly affects what you see.
At the moment, a popular example of this effect is the use of the bottom line of the quarterly profit and loss statement to assess the success of the company. This works well for a company that is mainly interested in short-term profit, but is weakly connected with long-term profit.
If in the rating system everyone’s starting rating is 95%, then it’s clear that a person can do little to raise his rating, but much to lower it. Thus, a reasonable strategy for employees is to work without risk and, as a result, ultimately rise to the top. At higher levels, you might want to increase your risk tolerance, as the class of people you can choose from is mostly conservative.
The rating system in the early stages may tend to remove exactly those employees that you want to have at a later stage.
If we use a rating system in which the average person would have an estimate of about 50%, then this approach would be more balanced. And if you wanted to encourage risk, you could start with a rating of 20% or less, thereby encouraging people to increase their rating, using risky methods as well, because if they failed, their losses would not be too big, but if successful, the reward would fully justify the risk. To take risks in the organization, you must encourage a reasonable degree of risk in the early stages, using such an approach to career advancement, so that as a result, some risky employees may appear at the top.
Of the things you want to measure, some are quantifiable, such as height and weight, while others are only categorically measurable, in particular, social attitudes. There is always a tendency to deal with quantitative measurements, although this approach can be obviously losing compared to categorical measurements (estimates?), Which in the end may be more appropriate for your tasks. Measurement accuracy is often confused with the relevance (relevance?) Of measurements, and this happens much more often than most people think. Just because a measurement is accurate, reproducible, and easy to do does not mean that it should be done; instead, a measurement that is more complex, but more closely related to your goals, may be preferable. For instance,
Let me turn to another effect of the measuring system and illustrate it by defining and using the IQ metric. A list of questions is formed that seems acceptable, based on previous experience, and then it is tested on a small sample of people. Those questions that show an internal correlation with others remain, and those that do not correlate too well are discarded. Then the updated test is calibrated by testing on a much larger sample of people.
How? Just taking the accumulated points (the number of people who are below a given value) and plotting these numbers as a representation of the probabilities on which the cumulative probabilities of the normal distribution are represented by horizontal lines. Then the points at which the cumulative actual points fall in the given percentage points are connected through the calibration table with the corresponding points on the cumulative normal probability curve. The result is that the intelligence of the population has a normal distribution!
Of course, this is so - the method itself implied just such a result! Moreover, the IQ was determined as the result of a calibrated exam, and with this definition of intelligence, of course, it has a normal distribution. But if you think that the IQ is not exactly what a calibrated exam determines, then you have the right to doubt that this indicator has a normal distribution among the population. Again, you get what was measured, and the declared normal distribution is an artifact of the measurement method and is hardly related to reality.
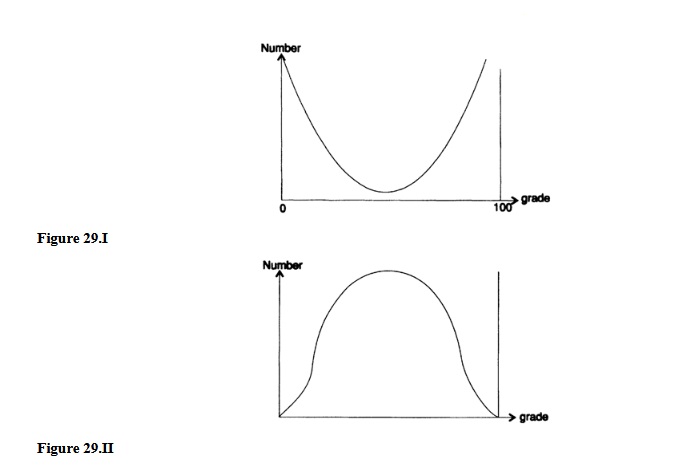
When passing the final exam for the course, say, mathematical analysis, I can get almost any distribution of grades that I want. If I could make an exam in which the questions would be of the same difficulty, then each student, as a rule, would receive all the right or wrong answers. Therefore, I get a distribution of ratings that peaks at both ends (Figure 29.I). If, on the contrary, I would ask some simple questions, most of the questions of medium complexity, and some very difficult ones, then I would get a typical normal distribution; a small number of ratings at each end and most of the ratings in the middle (Figure 29.II).
Obviously, if I know the class, then I can get almost any distribution I want. Usually, at the final exam, I am most interested in the “pass / fail” border and arrange the exam in such a way that I have as little doubt as possible about how to act, as well as have strong evidence that I am right in case of a complaint.
Another aspect of the rating system is its dynamic range. Suppose you are given a scale of 1 to 10, with 5 being average. Most people will assign ratings 4, 5, and 6, and rarely resort to extreme values of 1 and 9. If you give a rating of 6 to what you like, I will use the entire dynamic range and assign a rating of 2 to what I don't like , in this case, the result of our estimates gives, despite the differences in our opinion, the sum of the ratings is 6 + 2 = 8, while the average will be 4 - the effect of my opinion will be more, which erases your rating!
When using a rating scheme, you should try to use the entire dynamic range, in which case you will have a much greater influence on the final average - provided that it will be considered, as in most such cases, a blind averaging of assigned ratings. Remember that coding theory says that entropy (mean deviation) is maximum when the distribution is uniform. You have the most information when all estimates are used equally, as you know from Chapter 13, Information Theory.
If you consider assigning grades in the course as a communication channel, then, as has just been noted, the equal use of the frequency of all grades will give the maximum amount of information - while the typical postgraduate study uses mainly the two highest grades, A and B, significantly reduces the amount of information transmitted. I understand that the Naval Academy uses rank in the classroom, and, in a sense, this is the only protection against “rating inflation” and the inability to use the entire dynamic range of the scale uniformly, while reporting the maximum amount of information, given the fixed alphabet for ratings. The main mistake that occurs when using a rank as an assessment is when all very good people will be in a certain class, but some of them should still be down there!
The question also arises of how you initially attract people to a certain area of activity. In psychology, you can often notice that people entering a new field have much more confusion in their heads than the average professor and the average student in college - courses affect this to a lesser extent, although I suspect that they help to confuse the student further, but initial choice has a much greater impact. Similarly, the exact sciences and the humanities have their own attractive and negative sides, based more on the initially perceived features of the regions, and not necessarily on the actual features of the region. Thus, people tend to enter areas of activity that will be favorable to their characteristics, how they perceive them, and then, when they enter the field of activity, these features will often be further enhanced. The result is poorly balanced, but highly specialized people, who often cannot be dispensed with to succeed in the current situation.
In mathematics and computer science there is a similar effect of initial selection. At the earlier stages of the study of mathematics, up to mathematical analysis, just like in computer science, estimates are closely related to the ability to take into account a large volume of parts with high reliability. But later, especially in mathematics, the qualities necessary for success change, it is necessary to prove a greater number of theorems, better abilities to reason and assume new results, theorems and definitions that will be important. Even later, the ability to see the entire area as a whole, and not many fragments, comes to the fore. But the assessment process has largely removed earlier many of those you might want to use, and who would really be needed at a later stage! A very similar situation in computer science,
The Department of Employment also influences who exactly is being recruited into the system. If recruiting is required for research, then a typical human resources employee in a large organization will most likely not want to attract the right people. Due to the fact that good researchers have original thinking in science and technology, they are usually original in other aspects of their behavior and clothes, which means that they do not attract a typical recruiter from the human resources department. Therefore, as in Bell Telephone Laboratories, usually research people fail when they try to find work in the research field, and the human resources department shudders! This is not a trivial moment, as recruiting one generation determines the next generation of the organization.
There is also a vicious promotion feature in most systems. At higher levels, current participants choose the next generation - and they tend to choose people who are like themselves, people with whom they will feel comfortable. The company’s board of directors has strong control over the officers and future members of the board of directors nominated for elections (the results of which are often more or less predictable). You are prone to reproducing your own kind ("inbreeding"), but also, as a rule, you acquire organizational features. Therefore, the common method of promotion of one’s choice at higher levels of the organization has both good and bad features. This question is still on the topic “You get what you measure”, since there is a certain assessment question,
In the distant past, to combat “inbreeding”, most mathematical departments (a topic that I am more familiar with than other areas) adhered to the general rule that they did not hire their own graduates. The rule is not applied as widely as I can see, on the contrary, apparently, there is a tendency to prefer hiring own graduates over outsiders. There were several cases when the economic faculties were so prone to “inbreeding” that the top management of the University had to intervene and carry out the hiring procedure, so to speak, through the “corpses of professors” in order to organize a reasonable balance of different opinions at the University. The same thing happened at the faculties of psychology, jurisprudence and, no doubt, in others.
As already mentioned, the rating system, which allows those inside, to choose the next generation, has both good and bad traits and requires careful verification to prevent too much “inbreeding”. Some “inbreeding” means a common point of view and more harmonious work day after day, but probably will not allow for major innovations in the future. I suspect that in the future, constant changes will be a normal state of affairs, and this topic will become more important than it was in the past, and it definitely was a problem in the past!
I believe that you understand the fact that I am not trying to be too picky in this regard, rather I am trying to illustrate the theme of this chapter - “you get what you measure.” This is rarely thought of by people setting the rating, measurement methods or other schemes for registering things, and yet in the long run this has a huge impact on the entire system - usually in those areas that they never thought of at all!
Although the measurement is clearly bad when carried out unsuccessfully, there is still no way to avoid measurements, assessing things, people, etc. At the same time, only one person can be the head of the organization, and the selection should use education that is rated on a simple rating scale so that you can make a comparison. Despite the fact that people are at least as complex as vectors, and probably even more complex than matrices or tensors of numbers; a complex person, plus the effect of the environment in which he works, must somehow be reduced to a simple measure that will produce an ordered array of options.
This procedure can be performed in the mind, without sound thinking, but it must be carried out regardless of whether you believe in the rating of people or not - this cannot be avoided in any society in which there are differences in rank, ability to manage, or any other function which you wish. Even in the entertainment program there should be the first and last performer - all cannot be put on the same line. You may hate evaluating people like me, but this must be done regularly in our society, and in any society in which there is no absolute equality, this must happen very often. You can also accept this fact and learn how to do this work more efficiently than most people - they just continue to make choices, rather than analyze the whole process thoroughly, and observe how others do it and learn from them.
Now you see, I hope, how different scales of measurement influence what turns out as a result. They are fundamental, but usually very little attention is paid to them. To emphasize what I was talking about, I’ll just tell you more examples of how the measurement scale affects the system.
Earthquakes are almost always measured on the Richter scale, which effectively uses the logarithm of the estimated amount of energy in the earthquake. I'm not saying that this is a wrong measuring scale, but its effect is that you have few really strong earthquakes with magnitudes 7 and 8, and many weak ones with magnitudes 1 and 2. Think about it. I do not know the distribution on the scale of mother nature, but I doubt that she uses the Richter scale. Linear transformations, for example, from feet to meters, are not complicated, but other non-linear scale transformations are another matter.
Most of the time we measure incentives applied to people on a logarithmic scale, but for weight and height we use linear scales. They make it easy to add additivity, but for non-linear scales you don’t have this capability. For example, when measuring herd size, you tend to count the number of animals in the herd. Thus, you have additivity - combining two herds together gives the right amount of combined herd. If you have a herd of 3 goals and the same in number is added to it, this is one thing, but if you have a herd of 1000 goals and a herd of 3 goals is added to it, this is a completely different matter - therefore, the additivity of the number in the herd Not always an appropriate measure to use. In this case, the percentage change may be more informative.
How then to decide which scale to use when measuring things? I have no easy answer. Indeed, I have a terrible observation that one measurement scale is suitable for one type of result in some area, another measurement scale may be more suitable for some other type of result in exactly the same area! But how rarely is it recognized and used! Of course, you can sometimes observe that we calmly do the transformation when we apply the established formula, but which scale of measurement to use is difficult to decide in each case. Much depends on the field and existing theories, as well as new theories that you hope to find! All this will not help you in any particular situation.
There is another question that I mentioned in the previous chapter, and now I must return to it. This is the speed with which people respond to changes in the rating system. I told you how there was a constant battle between me and computer users, I tried to optimize the performance of the system as a whole, and they tried to optimize their own usage scenarios. Any change in the rating system that, in your opinion, will improve the performance of the system as a whole, will not work well if you have not thought through the reaction of people to the change - they will certainly change their behavior. You only need to think about your own optimization of your career, about how changes in the rating system in the past have changed some of your plans and strategies.
Some measurement systems obviously have bad features, but traditions and other subtleties support their existence. For example, the state of readiness of a military unit. In the Navy, ships are checked on a regular basis, one standard function after another, and the skipper gets the ship and crew ready for each of them, largely neglecting the others until they appear. Of course, the skipper gets high scores. But when we are faced with military exercises, what is the true readiness of the fleet? Certainly not the same as stated in the reports - as you can easily imagine. But what then should we use? Of course, we must use the data given - we would not be trusted if we used other data! Thus, we teach people in military exercises to use an idealized fleet, not real! The same thing happens in business games: we train executives to win in a simulated game, not in the real world. I leave this moment to you to think about how you will act when you are responsible, and want to know the true readiness of your organization. Will random checks solve everything? Not! But they will improve the situation a bit.
Every organization faces this problem. Now you are at low levels in your organization and you can see for yourself what is being reported about the events and how the reports differ from reality, and nothing will change until you get the power to radically change the situation. The air forces use supposedly random inspections, but, like my friend, a retired navy captain, he once noticed me that every base commander has a radar and knows what is in the air, and if the inspection team was a surprise to him, then he must be a round fool. However, in this case he has less time to prepare than in the case of scheduled inspections, therefore, apparently, inspection reports are probably closer to reality than when inspections occur only at a time known in advance. Yes, Inspections are measurements, and you "get what you measure." This situation does not differ too much in other organizations - the news of the upcoming measurement (inspection) "breaks into the vine of gossip", and the addressee of the news, pretending to be surprised, is often ready for it in the morning.
Another thing that is obvious, but it seems to me that it needs to be mentioned; the popularity of a particular form of measurement has little to do with its accuracy or relevance to the organization.
One more remark - everything from top to bottom in the organization, each person refracts the facts so that they themselves look good - at least from their point of view! The only thing that saves top management is that the different levels below, each of which can slightly refract facts, often have different goals, and therefore, many changes in facts most often partially cancel each other out because of the weak law of large numbers. If the whole organization works together to trick the elite, then leadership can do little about it. When I was on the Board of Directors, I was so clearly aware of this fact that I often came either a day earlier or delayed a day later, and just wandered around, asking questions, looking and asking myself if there were any facts about which it was reported. For example, once, when the stock was very large, due to a change in the line of computers that we made, which made us have parts of both lines on hand at the same time, I walked, suddenly turned to the pantry and just walked in. Then I looked around to decide if there was, in my opinion, any significant discrepancy or the amounts reported were accurate enough.
Again, were there computers that we had to send to the loading dock, or were they mythical, as happened in many companies? Sniffing around, I found that at the end of each quarter the cars that needed to be sent were indeed sent, but often in the process of releasing later cars on the production line, and therefore the next few weeks were spent on returning the cars that were released in proper condition. I could never stop this bad habit of employees, although I was on the Board of Directors! If you only look around in your organization you will find many strange things that really should not happen, but they are considered common practice by staff.
Another strange thing that happens is that it is considered at one level as one, otherwise it is considered at a higher level. For example, it often happens that evaluations of an organization’s capabilities at one level are interpreted as probabilities at a higher level! Why is this happening? Just because the lower level cannot fulfill what it wants the higher and, therefore, does what it can do, and the higher level intentionally, because it wants to get its numbers, it prefers to change the meaning of the reports.
I already discussed the question of life tests - what can be done and what is needed is not at all the same! At the moment, we do not know how to release what we need; ensure reliability over many years of operation with a high level of confidence in the parts that were first delivered to us yesterday. This problem will not disappear, but much can be done to design the necessary reliability of things. One of my first tasks at Bell Telephone Laboratories was to develop a series of concentric rings of copper and ceramic, such that for given radii, when the temperature changed, the ceramic would always be compressed and never stretched, since it has low strength. The design has a degree of reliability built into it! In my opinion, too little has been done in this direction, but, as I already noted, when they said that there was no time for this,
There are rating systems that have built some degree of human judgment into it - and that sounds good. But let me tell you a story that made a big impression on me. I developed a computational method for estimating phase shifts from measured gain factors at various signal frequencies, which replaced the manual method. I do not claim that it was better, but the manual method could not solve a new problem when we switched from voice to the range of the TV band. One smart man once told me: “Before, when people did things, we could not make further improvements due to random human variations; now that you have removed the random element, we can hope to find out things that were not obvious before. ” Valuation methods that do not have human judgment have some advantages, but do not consider that I am opposed to investing an element of human judgment. Most formal methods are necessarily finite, and the complexity of reality is almost infinite, so a reasonably applied human judgment is often a good thing - although, as just noted, it stands in the way of further progress with its subjective aspects.
From all this, please do not conclude that measurement cannot be made - it can be clear, but the issue of relevance and effects of the measurement form should be thought out as best as possible before you begin any new measurement in your organization . The inevitable changes that will occur in the future, and the increase in the power of computers for automatic monitoring of things, means that many new measuring systems will be used that you yourself will have to develop, create and install. So let me tell you another story about the influence of measurement.
In computer science, programming complexity is often measured by the number of lines of code — what could be simpler? From the point of view of the encoder, there is absolutely no reason to try to clear a piece of code; on the contrary, to get a higher rating on the performance scale, there is every reason to leave unnecessary instructions there, indeed, include a few "bells and whistles", if possible. This widely used indicator of software performance is one of the reasons why we have such bloated software systems these days. It does not encourage the development of clean, compact, and reliable code that we all need. In addition, the measure used affects the result in ways that damage the entire system! It also creates habits that are later difficult to eradicate.
When it is your turn to install a measuring system, or even comment on what someone else is using, try to think your way to all the hidden consequences that will occur with the organization. Of course, in principle, measurement is good, but it can often do more harm than good. I hope the idea sounded loud and clear:
you get what you measure.
To be continued ...
Who wants to help with the translation - write in a personal email or e-mail [email protected]
By the way, we have also launched the translation of another cool book - "The Dream Machine: The History of the Computer Revolution" )
Book Contents and Translated Chapters
Who wants to help with the translation - write in a personal email or mail [email protected]
- Intro to The Art of Doing Science and Engineering: Learning to Learn (March 28, 1995) (in work) Translation: Chapter 1
- “Foundations of the Digital (Discrete) Revolution” (March 30, 1995) Chapter 2. Fundamentals of the Digital (Discrete) Revolution
- History of Computers - Hardware (March 31, 1995) (in work)
- “History of Computers - Software” (April 4, 1995) Chapter 4. History of Computers - Software
- History of Computers - Applications (April 6, 1995) (in work)
- "Artificial Intelligence - Part I" (April 7, 1995) (in work)
- "Artificial Intelligence - Part II" (April 11, 1995) (in work)
- “Artificial Intelligence III” (April 13, 1995) Chapter 8. Artificial Intelligence-III
- “N-Dimensional Space” (April 14, 1995) Chapter 9. N-Dimensional Space
- “Coding Theory - The Representation of Information, Part I” (April 18, 1995) (in work)
- "Coding Theory - The Representation of Information, Part II" (April 20, 1995)
- “Error-Correcting Codes” (April 21, 1995) (in)
- Information Theory (April 25, 1995) (in work, Alexey Gorgurov)
- Digital Filters, Part I (April 27, 1995) is done
- Digital Filters, Part II (April 28, 1995) in work
- Digital Filters, Part III (May 2, 1995)
- Digital Filters, Part IV (May 4, 1995)
- “Simulation, Part I” (May 5, 1995) (in work)
- "Simulation, Part II" (May 9, 1995) is ready
- "Simulation, Part III" (May 11, 1995)
- Fiber Optics (May 12, 1995) at work
- Computer Aided Instruction (May 16, 1995) (in work)
- Mathematics (May 18, 1995) Chapter 23. Mathematics
- Quantum Mechanics (May 19, 1995) Chapter 24. Quantum Mechanics
- Creativity (May 23, 1995). Translation: Chapter 25. Creativity
- “Experts” (May 25, 1995) Chapter 26. Experts
- “Unreliable Data” (May 26, 1995) (in work)
- Systems Engineering (May 30, 1995) Chapter 28. Systems Engineering
- “You Get What You Measure” (June 1, 1995) Chapter 29. You Get What You Measure
- “How Do We Know What We Know” (June 2, 1995) in work
- Hamming, “You and Your Research” (June 6, 1995). Translation: You and Your Work
Who wants to help with the translation - write in a personal email or mail [email protected]