Monitoring IT system performance with Splunk IT Service Intelligence
It's no secret that business is constantly striving to increase its competitiveness. It seems that the easiest way to do this is through innovation, let's increase the efficiency of one to two or three business processes using a modern, high-tech system and we will be happy. This scheme works until the complexity of our IT system begins to work against us.
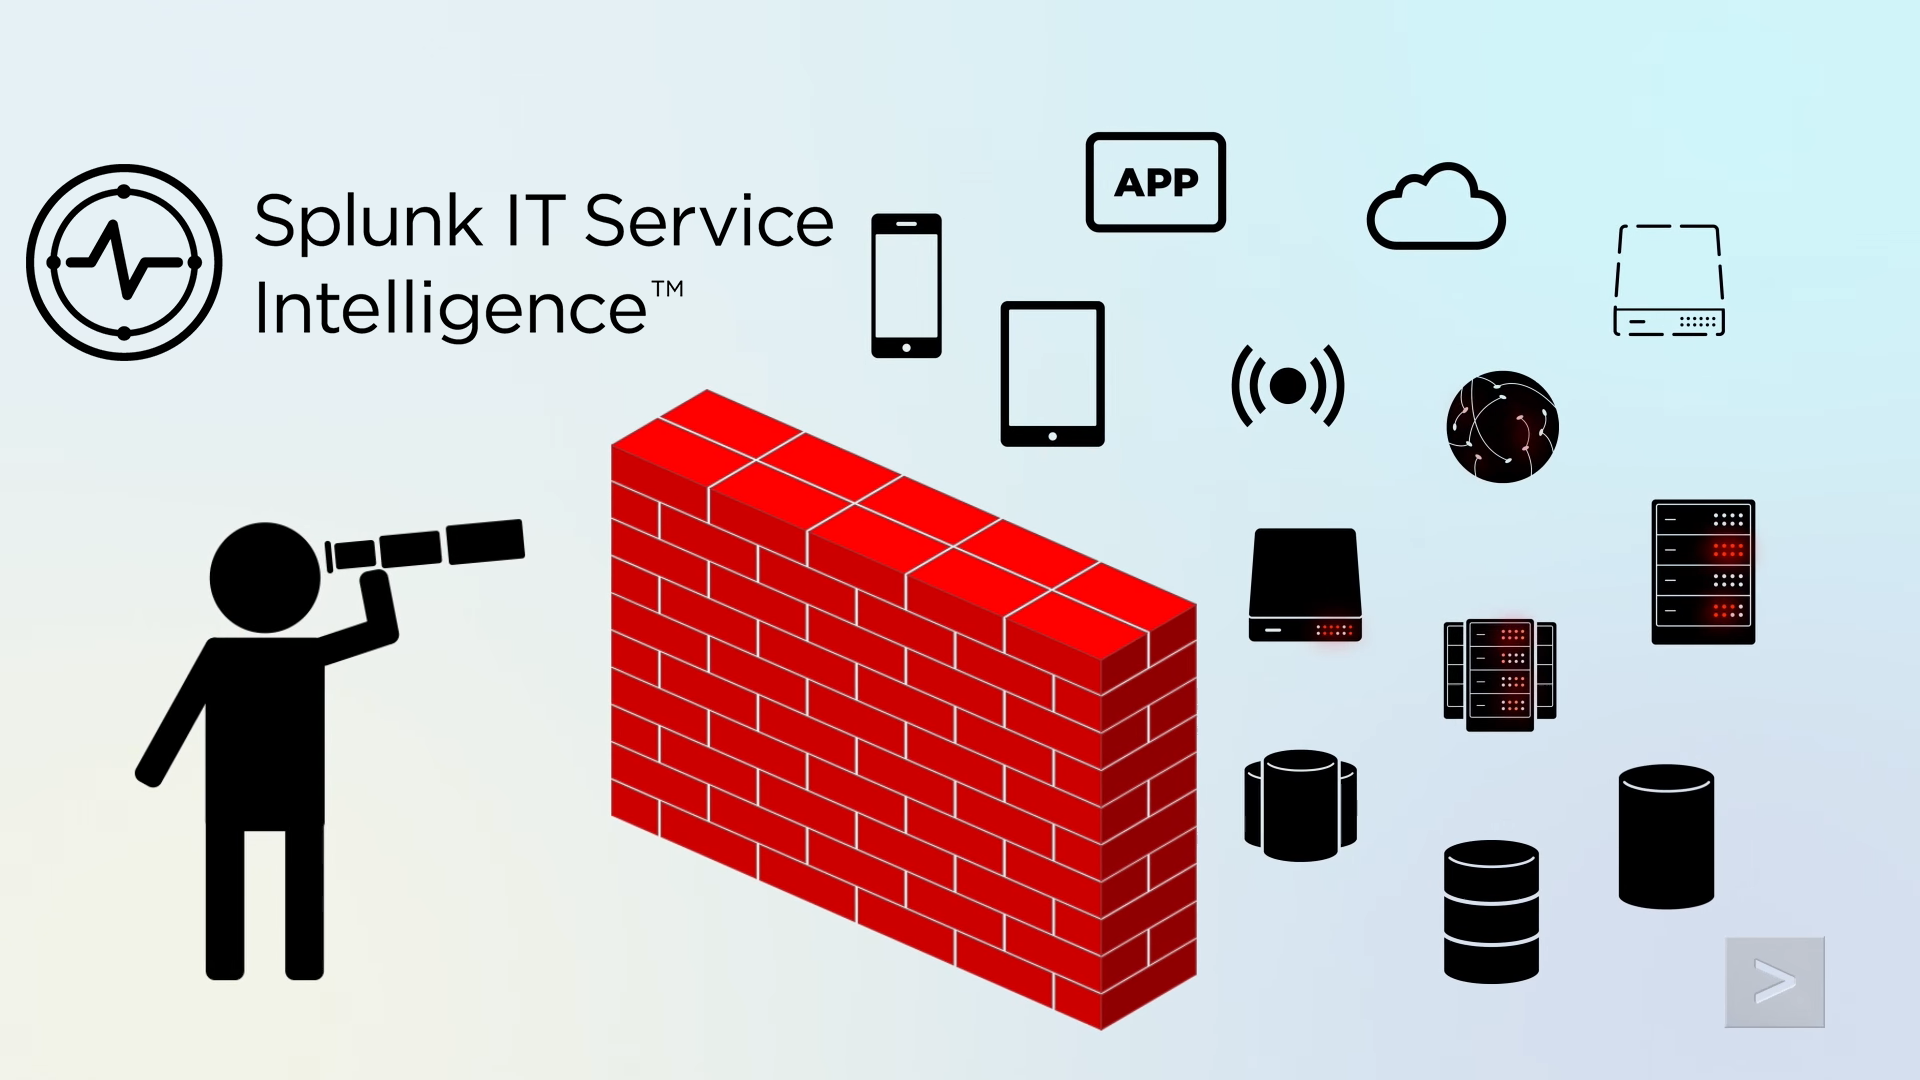
Do you know how efficiently the elements of your IT infrastructure work? How do they affect each other? Maybe some element worsens the system as a whole? How to understand what this element is?
In our article, we want to talk about a solution that can help in analyzing and monitoring the performance of each individual element, as well as the entire IT system as a whole, determining dependencies between services, alerts when performance indicators change below or above the threshold level.
It's about Splunk IT Service Intelligence (ITSI) . This is a tool for monitoring and analyzing the operation of IT infrastructure, working on the operational analytics platform Splunk, which we talked about earlier .
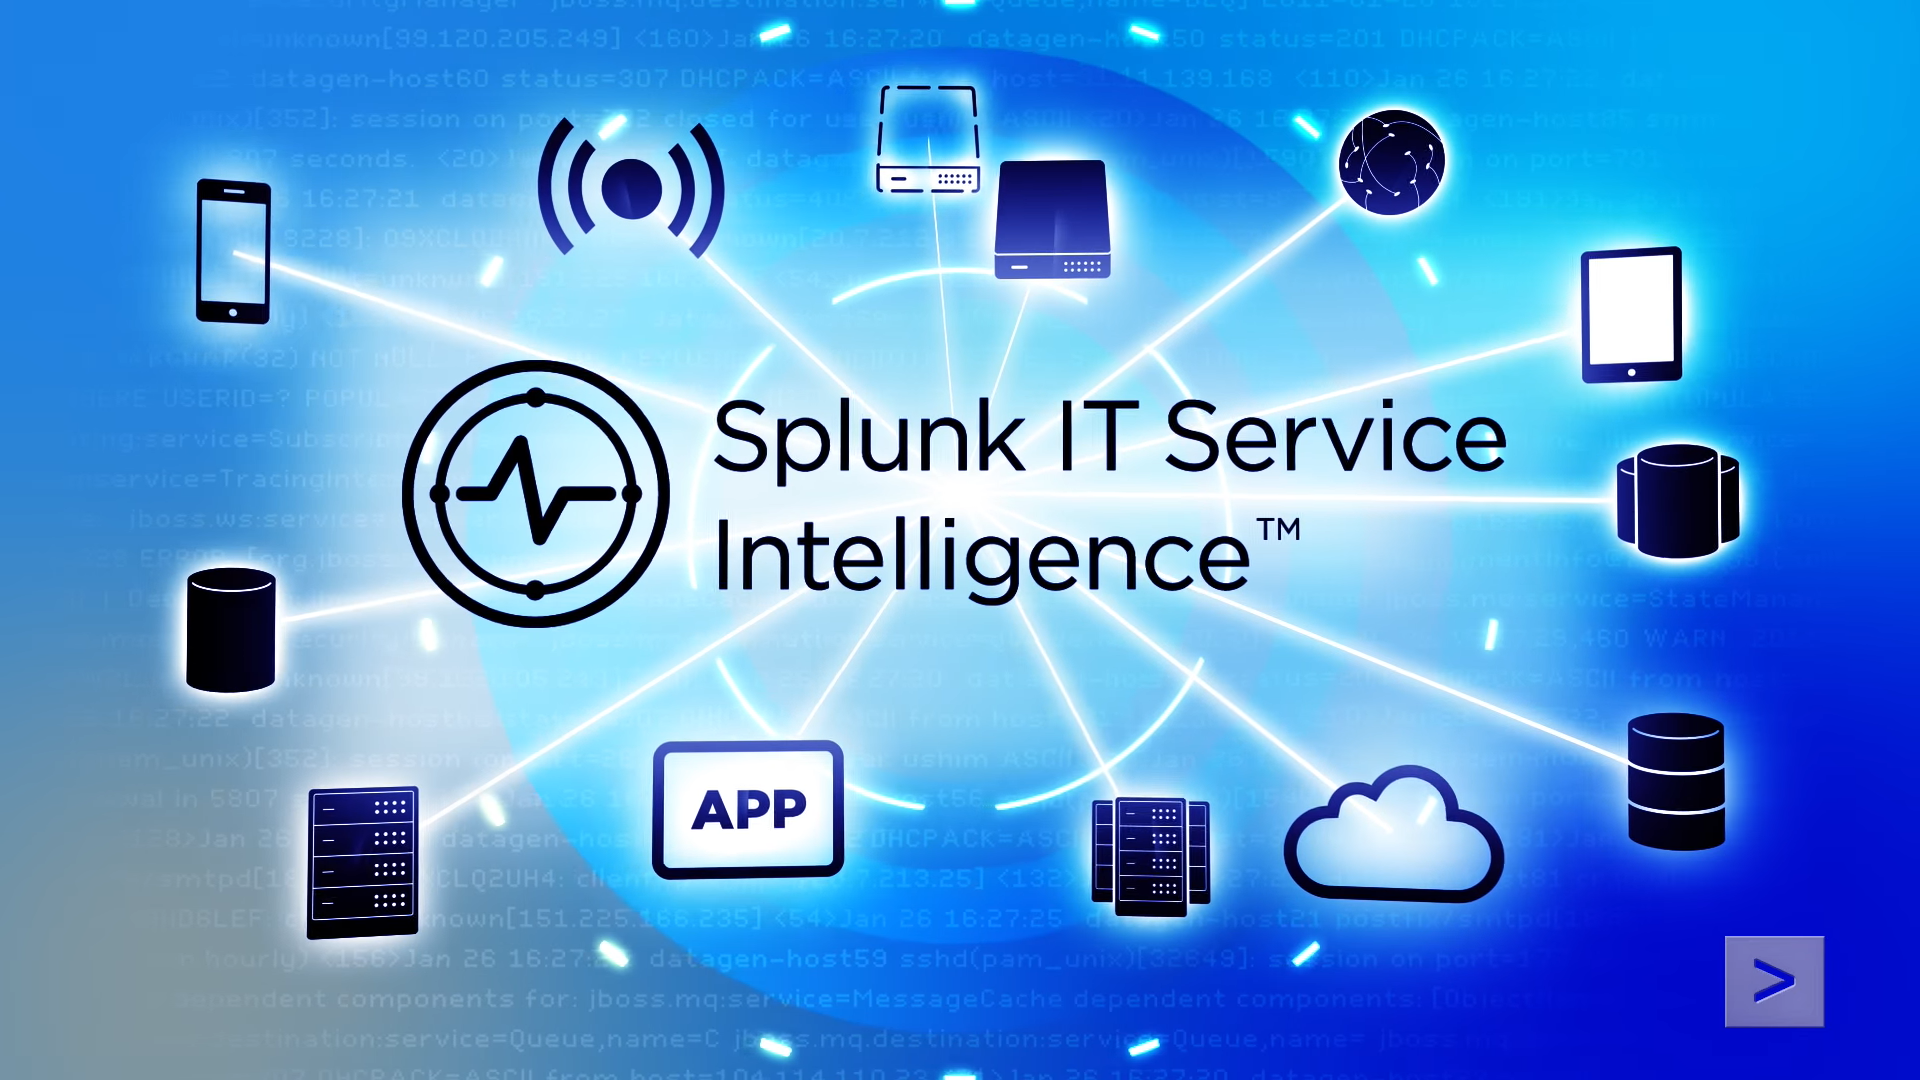
The platform allows you to collect, monitor data from various devices, systems and applications. The ITSI operation process ensures the visibility of the performance indicators of system elements, the main KPIs, as well as the behavior of critical IT and business services and related supporting services.
With the help of one tool, it is possible to solve many problems in the field of IT, including the analysis of events, metrics, and magazines, which allows identifying and fixing the most important problems in the operation of elements of the IT infrastructure.
Let's look at the main elements of Splunk IT Service Intelligence , and why they are needed:
It is obvious that everyone wants to get the most important information as quickly and easily as possible. This is exactly what the ITSI start page - Service Analyzer is for. Entering the application, you can at a glance evaluate the overall level of the entire IT system.
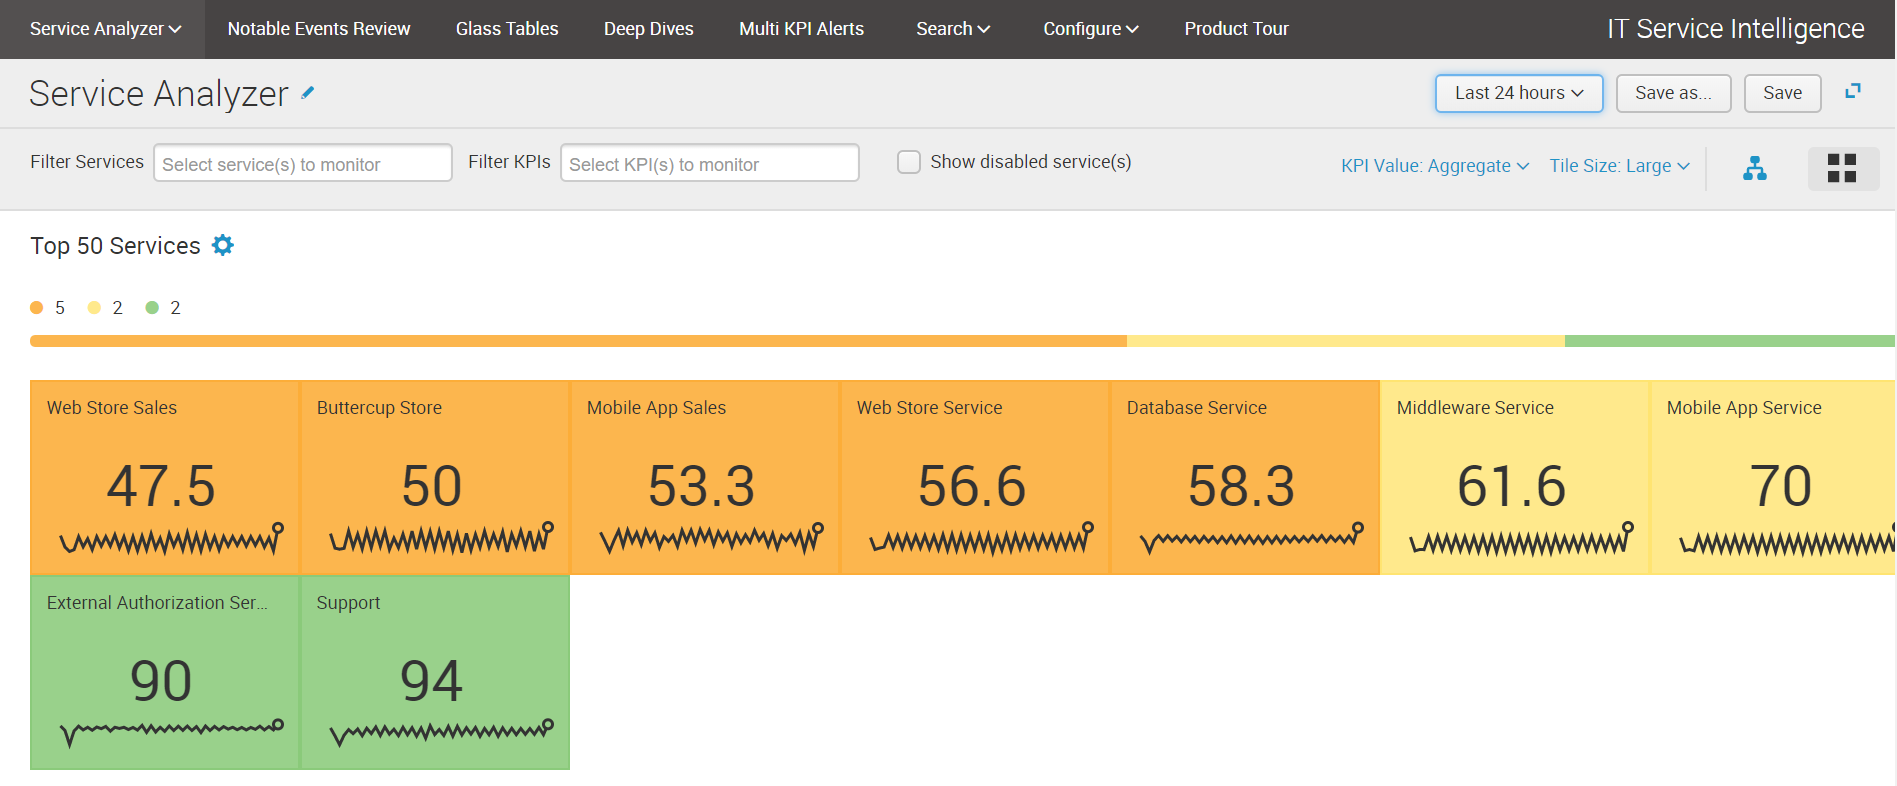
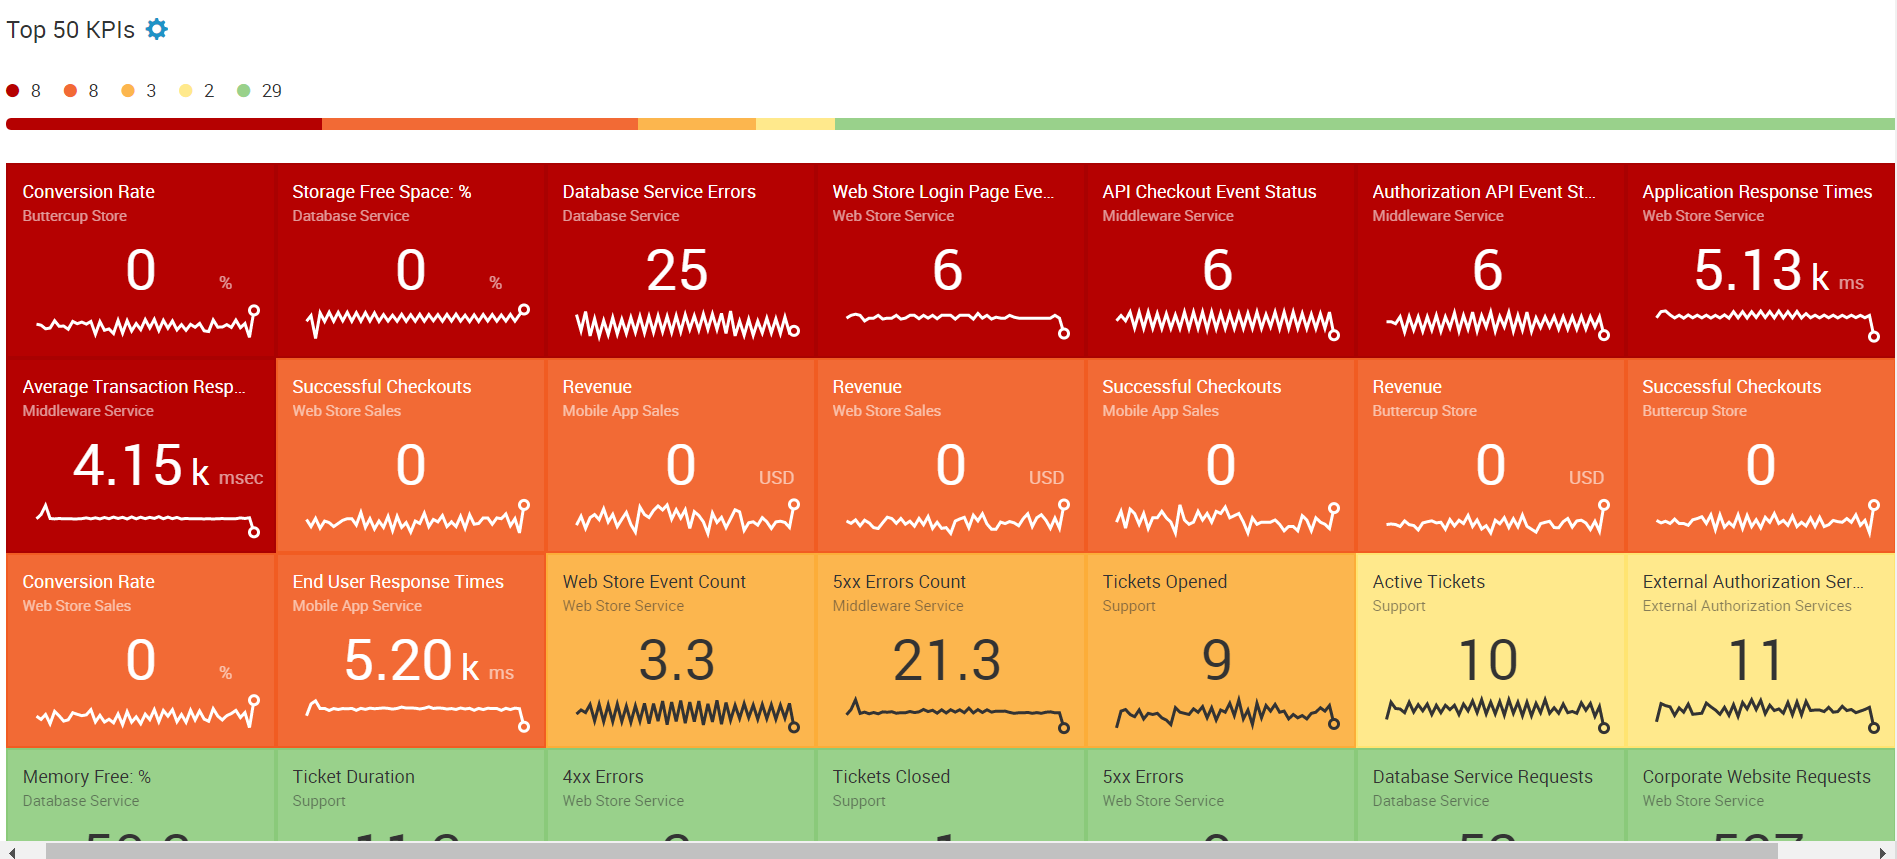
There are two views of Service Analyzer: the tile view and the tree structure, which allows you to see how some services affect others.
The performance indicators and the main KPIs associated with them, having a color indicator and sorted by the current state level, are presented in the form of tiles.
The tree view displays all services in the form of a graph in which the nodes show the level of health of the node. Each node can be opened and see associated performance indicators.
In the example below, the Buttercup store service is dependent on web store sales, mobile application sales, web store services, mobile application services, and support services. The mobile application service depends on the middleware service and the external authorization service, which depends on the database.

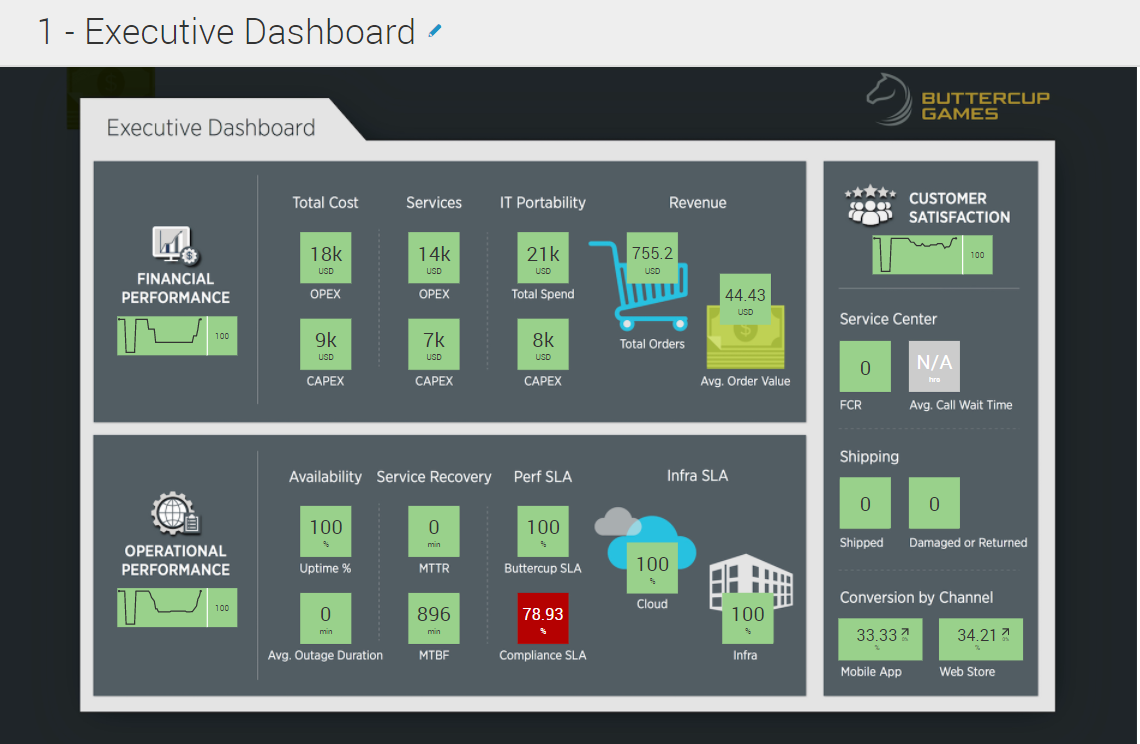
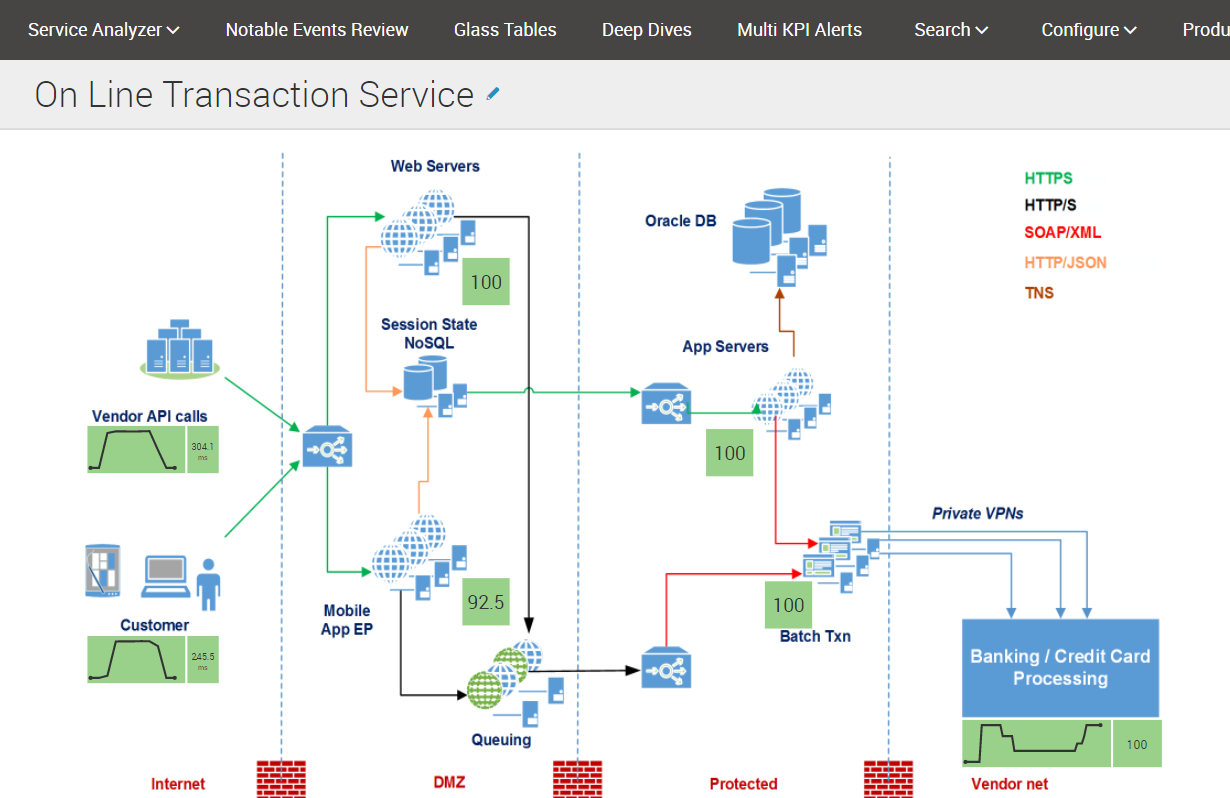
Not all users are comfortable, understandable, and it is just necessary to understand the structure of the entire system to obtain useful information. Glass Tables is a visual and convenient visualization that will be understandable to almost any user. “Tables” allow you to learn about the status of services and the values of performance indicators in the interface of work schemes or business processes. For convenience, you can use various widgets and icons to display KPI performance indicators.
After we learned how the services work, I want to know why they work like that, what events affect their work and somehow affect them. There is a Notable Events Review panel for this.
The “noticeable events” dashboard is used to see warnings about problems that are currently affecting services or could potentially affect services. The panel displays noticeable warning events generated by Multi KPI Alerts, correlation searches and anomaly detection algorithms.
By “notable event” may be meant:

For ease of presentation, all events are grouped using machine learning algorithms that determine similar events. The information panel displays information about each group of events, such as the number of events in the group, the time range of events in the group, owner, severity, status and description. By clicking on a group, you can get detailed information about events within the group.
We can manage events, set certain actions and scripts for the implementation of the event, for example, send notifications to e-mail or to external systems.
Of course, seeing only the state of the system at the moment, we see only the tip of the iceberg. Therefore, it is very useful to be able to monitor conditions over time. How long does the decline in performance last? Now everything is fine, but were there problems an hour or two or a day ago? Why?
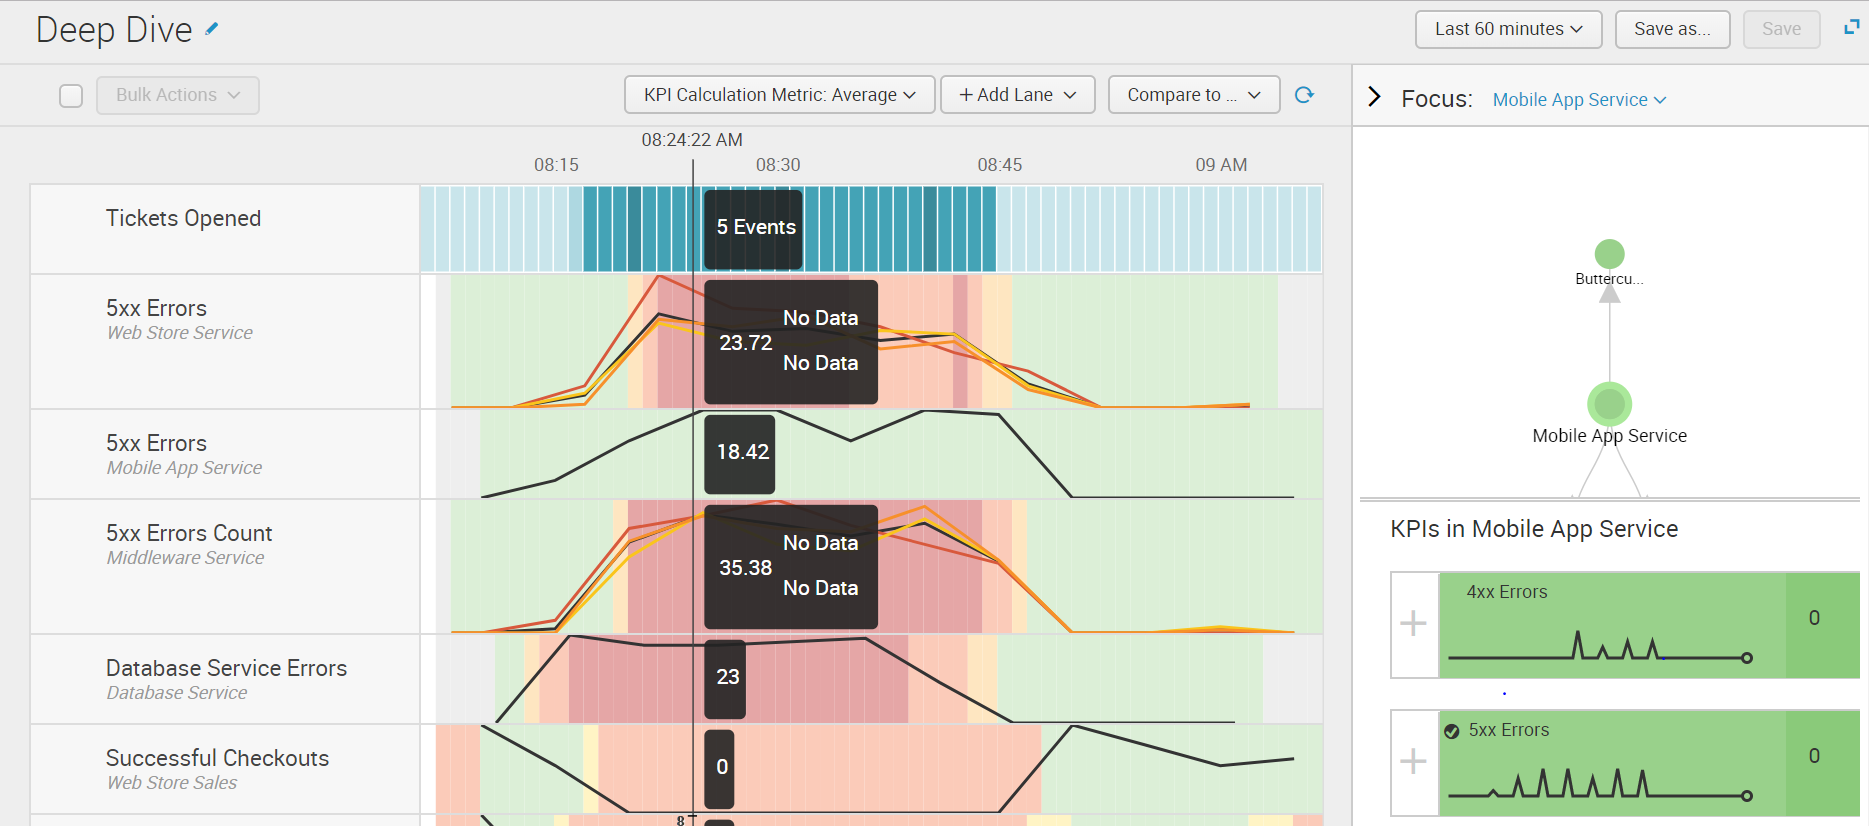
In the Deep Dives section, a history of KPI indicators is added, that is, we can see the status of the system not only now, but several hours ago and compare the results of various elements of the system at the same time or compare the results of one service with what it was a day, a week or a month ago.
Often, only a combination of factors can tell us about a problem; therefore, it is necessary to be able to trigger warnings based on several KPIs or depending on how long the indicator has reached a certain value.
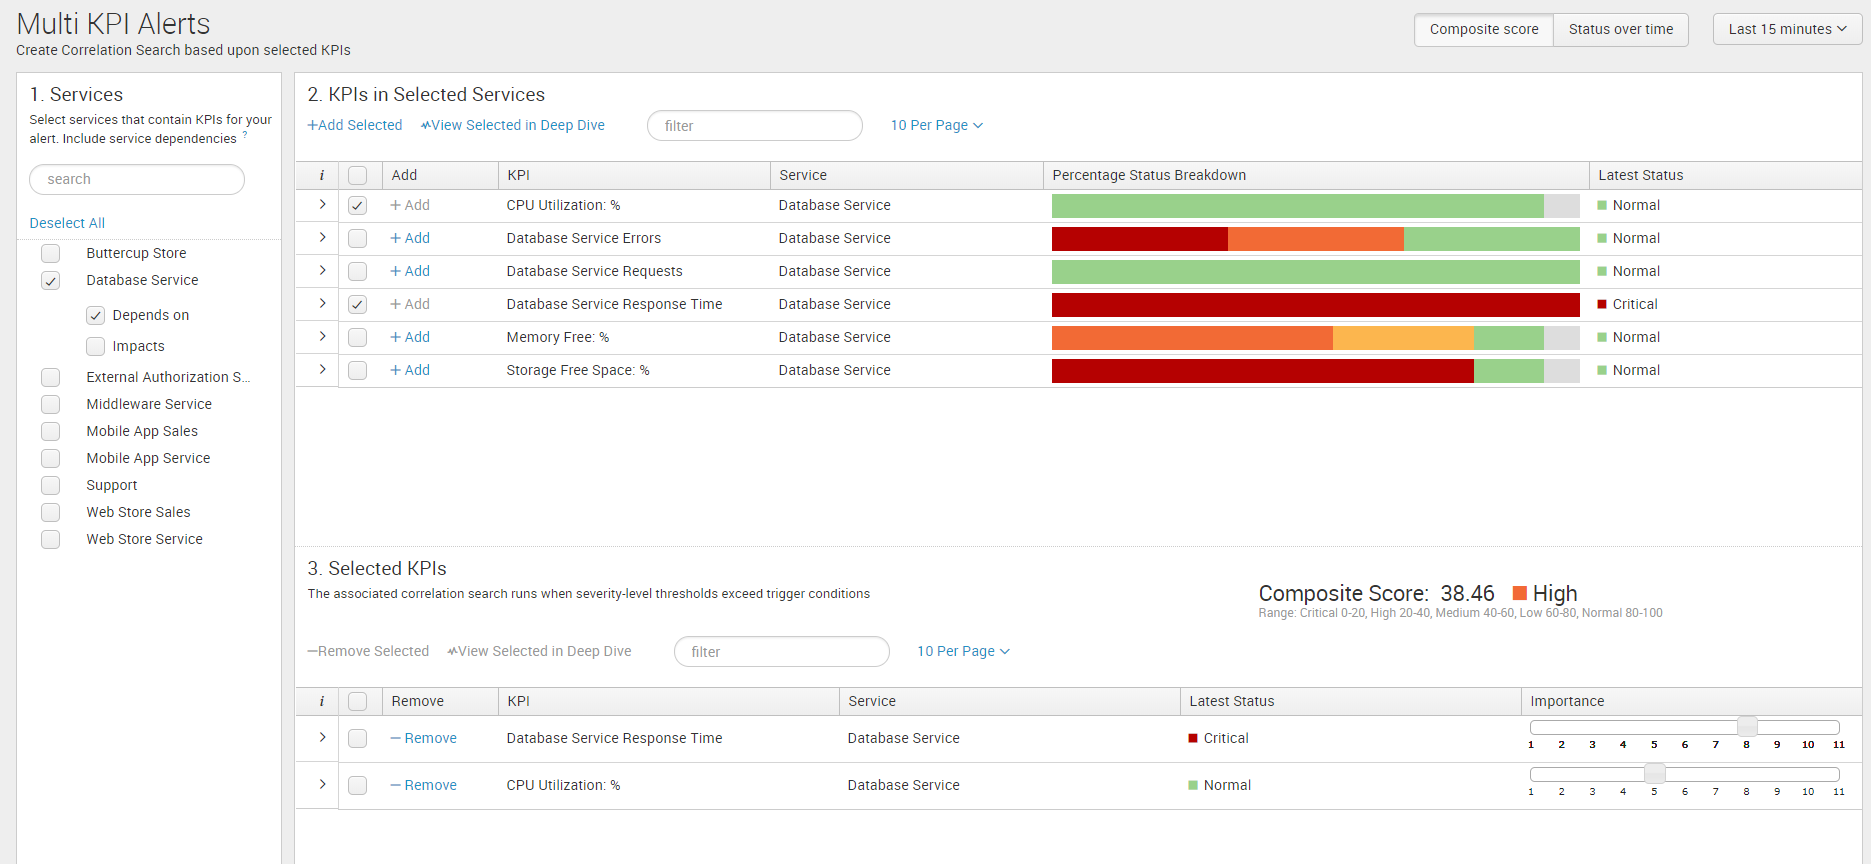
In the Multi KPI Alerts section, it is possible to create such composite performance indicators in which you can take into account the weight of the influence of each factor on the overall problem.
Summarizing the above:
The examples described above do not cover 100% of the entire functionality of the system, but in general, companies with wide IT landscapes can solve the main problems. You can definitely say that ITSI is simply necessary for those who want to keep their IT infrastructure under control.
We are happy to answer all your questions and comments on this topic. Also, if you are interested in something specifically in this area, or in the field of machine data analysis in general, we are ready to modify the existing solutions for you, for your specific task. To do this, you can write about it in the comments or simply send us a request through the form on our website .
Do you know how efficiently the elements of your IT infrastructure work? How do they affect each other? Maybe some element worsens the system as a whole? How to understand what this element is?
In our article, we want to talk about a solution that can help in analyzing and monitoring the performance of each individual element, as well as the entire IT system as a whole, determining dependencies between services, alerts when performance indicators change below or above the threshold level.
It's about Splunk IT Service Intelligence (ITSI) . This is a tool for monitoring and analyzing the operation of IT infrastructure, working on the operational analytics platform Splunk, which we talked about earlier .
The platform allows you to collect, monitor data from various devices, systems and applications. The ITSI operation process ensures the visibility of the performance indicators of system elements, the main KPIs, as well as the behavior of critical IT and business services and related supporting services.
With the help of one tool, it is possible to solve many problems in the field of IT, including the analysis of events, metrics, and magazines, which allows identifying and fixing the most important problems in the operation of elements of the IT infrastructure.
Let's look at the main elements of Splunk IT Service Intelligence , and why they are needed:
Service analyzer
It is obvious that everyone wants to get the most important information as quickly and easily as possible. This is exactly what the ITSI start page - Service Analyzer is for. Entering the application, you can at a glance evaluate the overall level of the entire IT system.
There are two views of Service Analyzer: the tile view and the tree structure, which allows you to see how some services affect others.
The performance indicators and the main KPIs associated with them, having a color indicator and sorted by the current state level, are presented in the form of tiles.
The tree view displays all services in the form of a graph in which the nodes show the level of health of the node. Each node can be opened and see associated performance indicators.
In the example below, the Buttercup store service is dependent on web store sales, mobile application sales, web store services, mobile application services, and support services. The mobile application service depends on the middleware service and the external authorization service, which depends on the database.
Glass tables
Not all users are comfortable, understandable, and it is just necessary to understand the structure of the entire system to obtain useful information. Glass Tables is a visual and convenient visualization that will be understandable to almost any user. “Tables” allow you to learn about the status of services and the values of performance indicators in the interface of work schemes or business processes. For convenience, you can use various widgets and icons to display KPI performance indicators.
Notable Events Review
After we learned how the services work, I want to know why they work like that, what events affect their work and somehow affect them. There is a Notable Events Review panel for this.
The “noticeable events” dashboard is used to see warnings about problems that are currently affecting services or could potentially affect services. The panel displays noticeable warning events generated by Multi KPI Alerts, correlation searches and anomaly detection algorithms.
By “notable event” may be meant:
- One of the KPIs if it exceeds a predetermined threshold;
- The result of Multi KPI Alerts, which generates a warning based on the status of several KPIs;
- The result of a correlation search that searches for relationships between data points.
For ease of presentation, all events are grouped using machine learning algorithms that determine similar events. The information panel displays information about each group of events, such as the number of events in the group, the time range of events in the group, owner, severity, status and description. By clicking on a group, you can get detailed information about events within the group.
We can manage events, set certain actions and scripts for the implementation of the event, for example, send notifications to e-mail or to external systems.
Deep dives
Of course, seeing only the state of the system at the moment, we see only the tip of the iceberg. Therefore, it is very useful to be able to monitor conditions over time. How long does the decline in performance last? Now everything is fine, but were there problems an hour or two or a day ago? Why?
In the Deep Dives section, a history of KPI indicators is added, that is, we can see the status of the system not only now, but several hours ago and compare the results of various elements of the system at the same time or compare the results of one service with what it was a day, a week or a month ago.
Multi KPI Alerts
Often, only a combination of factors can tell us about a problem; therefore, it is necessary to be able to trigger warnings based on several KPIs or depending on how long the indicator has reached a certain value.
In the Multi KPI Alerts section, it is possible to create such composite performance indicators in which you can take into account the weight of the influence of each factor on the overall problem.
Conclusion
Summarizing the above:
- Services and KPIs show which services are currently working fine and which have deviations.
- Glass Tables allow you to group indicators by specific groups and visualize them.
- Deep Dives allows you to compare the status of indicators over time and determine from which source this or that problem started.
- Multu-KPI Alerts and Notable Events identify any specific important events and allow you to manage them.
The examples described above do not cover 100% of the entire functionality of the system, but in general, companies with wide IT landscapes can solve the main problems. You can definitely say that ITSI is simply necessary for those who want to keep their IT infrastructure under control.
We are happy to answer all your questions and comments on this topic. Also, if you are interested in something specifically in this area, or in the field of machine data analysis in general, we are ready to modify the existing solutions for you, for your specific task. To do this, you can write about it in the comments or simply send us a request through the form on our website .