How I parcel Habr, part 1: trends
When the New Year Olivier was finished, I had nothing to do, and I decided to download all the articles from Habrahabr (and related platforms) onto my computer and investigate.
It turned out some interesting stories. The first of these is the development of the format and subject matter of articles over the 12 years of the site's existence. For example, the dynamics of some topics are quite indicative. Continuation - under the cut.

Parsing process
To understand how Habr was developing, it was necessary to go around all of his articles and extract meta-information (for example, dates) from them. Bypassing was easy, because links to all articles are of the form "habrahabr.ru/post/337722/", and the numbers are given strictly in order. Knowing that the last post has a number slightly less than 350 thousand, I just went through all the possible id documents with a loop (Python code):
import numpy as np
from multiprocessing import Pool
with Pool(100) as p:
    docs = p.map(download_document, np.arange(350000))
The function download_documenttries to load the page with the corresponding id and tries to pull out the informative information from the html structure.
import requests
from bs4 import BeautifulSoup
def get_doc_by_id(pid):
    """ Download and process a Habr document and its comments """
    # выгрузка документа
    r = requests.get('https://habrahabr.ru/post/' +str(pid) + '/')
    # парсинг документа
    soup = BeautifulSoup(r.text, 'html5lib') # instead of html.parser
    doc = {}
    doc['id'] = pid
    if not soup.find("span", {"class": "post__title-text"}):
        # такое бывает, если статья не существовала или удалена
        doc['status'] = 'title_not_found'
    else:
        doc['status'] = 'ok'
        doc['title'] = soup.find("span", {"class": "post__title-text"}).text
        doc['text'] = soup.find("div", {"class": "post__text"}).text
        doc['time'] = soup.find("span", {"class": "post__time"}).text
        # create other fields: hubs, tags, views, comments, votes, etc.
        # ...
    # сохранение результата в отдельный файл
    fname = r'files/' + str(pid) + '.pkl'
    with open(fname, 'wb') as f:
        pickle.dump(doc, f)
In the process of parsing, I discovered several new points.
First, they say that creating more processes than cores in a processor is useless. But in my case, it turned out that the limiting resource is not a processor, but a network, and 100 processes execute faster than 4 or, say, 20.
Secondly, in some posts there were combinations of special characters - for example, euphemisms like "% & # @". It turned out that html.parserwhich I used first reacts &#painfully to the combination , considering it the beginning of an html entity. I was about to do black magic, but the forum suggested that you can just change the parser.
Thirdly, I managed to unload all publications, except for three. Documents numbered 65927, 162075, and 275987 instantly deleted my antivirus. These are articles, respectively, about a javascript chain that downloads a malicious pdf, an SMS ransomware in the form of a set of plug-ins for browsers, and the site CrashSafari.com, which sends iPhones to reboot. Antivirus discovered another article later, during a system scan: post 338586 about scripts on the pet store’s website that use the user's processor to mine cryptocurrency. So, the operation of the antivirus can be considered quite adequate.
Only half of the potential maximum of 166307 pieces of live articles turned out to be. About the rest Habr gives options "the page is out of date, was deleted or did not exist at all." Well, anything can happen.
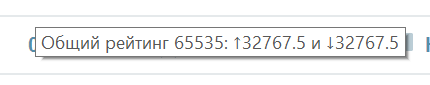
Technical work followed the unloading of articles: for example, the publication dates had to be transferred from the format “December 21, 2006 at 10:47” to standard datetime, and “12.8k” views to 12800. At this point, several more incidents appeared. The funniest is connected with the counting of votes and data types: in some old posts, there was an overflow of int, and they received 65,535 votes.
As a result, the texts of articles (without pictures) took me 1.5 gigabytes, comments with meta-information - 3 more, and about a hundred megabytes - meta-information about articles. This can be completely kept in RAM, which was a pleasant surprise for me.
I started the analysis of articles not from the texts themselves, but from the meta-information: dates, tags, hubs, views and “likes”. It turned out that she can tell a lot.
Habrahabr development trends
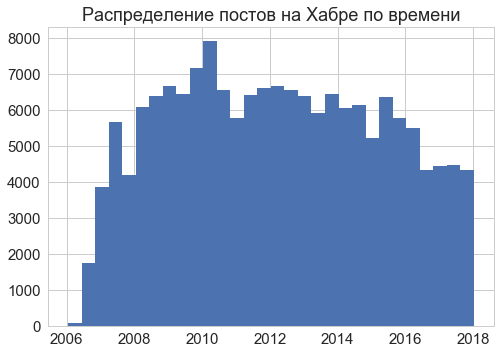
Articles on the site have been published since 2006; most intensively - in 2008-2016.
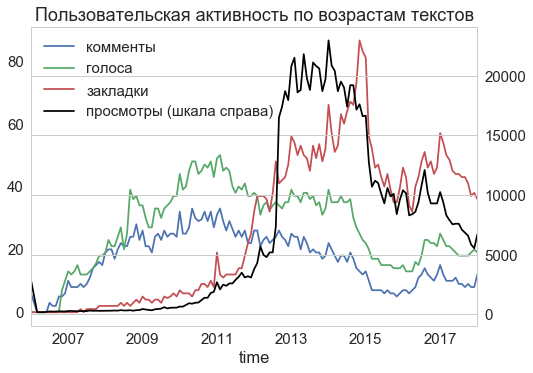
How actively these articles were read at different times is not so easy to evaluate. Texts of 2012 and younger commented and rated more actively, but newer texts have more views and bookmarks. These metrics behaved the same way (halved) only once, in 2015. Perhaps, in a situation of economic and political crisis, readers' attention has shifted from IT blogs to more painful issues.
In addition to the articles themselves, I deflated more comments on them. 6 million comments turned out, however, 240 thousand of them turned out to be banned ("the UFO flew in and published this inscription here"). A useful feature of comments is that they are time stamped. Studying the time of comments, you can roughly understand and when articles are generally read.
It turned out that most of the articles are written and commented somewhere from 10 to 20 hours, i.e. on a typical Moscow working day. This may mean that Habr is read for professional purposes, and that this is a good way of procrastination at work. By the way, this distribution of time of day is stable from the very foundation of Habrir to the present day.

However, the main benefit of the comment timestamp is not the time of day, but the term of the "active life" of the article. I calculated how the time is allocated from the publication of the article to its comment. It turned out that now the median comment (green line) comes in about 20 hours, i.e. on the first day after publication, on average, leave a little more than half of all comments on the article. And in two days they leave 75% of all comments. Moreover, earlier articles were read even faster - so, in 2010, half of the comments came in the first 6 hours.

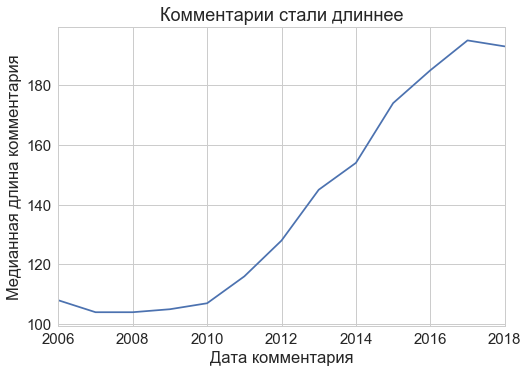
It came as a surprise to me that the comments lengthened: the average number of characters in a comment almost doubled during the existence of Habr!
More simple feedback than comments is voices. Unlike many other resources, on Habré you can put not only pluses, but also minuses. However, readers use the last opportunity not so often: the current share of dislikes is about 15% of all votes cast. Previously, there were more, but over time, readers matched.

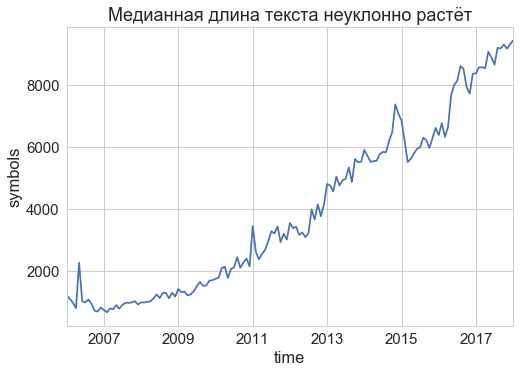
The texts themselves changed over time. For example, the typical length of the text does not stop steadily growing from the very start of the site, despite the crises. In a decade, texts have become almost ten times longer!
The stylistics of the texts (to a first approximation) also changed. For the first years of the existence of Habr, for example, the proportion of code and numbers in texts has grown:

Having sorted out the general dynamics of the site, I decided to measure how the popularity of various topics changed. Topics can be selected from texts automatically, but for starters you can not reinvent the wheel, but use ready-made tags affixed by the authors of each article. I deduced four typical trends on the chart. The Google theme initially dominated (perhaps mainly due to SEO optimization), but lost weight every year. Javascript was a popular topic and continues gradually, but machine learning began to rapidly gain popularity only in recent years. Linux has remained equally relevant throughout the decade.

Of course, I wondered which topics attracted more readership. I calculated the median number of views, votes and comments in each topic. Here's what happened:
- Most viewed topics: arduino, web design, web development, digest, links, css, html, html5, nginx, algorithms.
- The most "likeable" topics: VKontakte, humor, jquery, opera, c, html, web development, html5, css, web design.
- The most discussed topics: opera, skype, freelance, VKontakte, ubuntu, work, nokia, nginx, arduino, firefox.
By the way, since I am comparing topics, you can make their rating by frequency (and compare the results with a similar article from 2013 ).
- For all the years of Habr's existence, the most popular tags (in descending order) have become google, android, javascript, microsoft, linux, php, apple, java, python, programming, startups, development, ios, startup, social networks
- In 2017, the most popular were javascript, python, java, android, development, linux, c ++, programming, php, c #, ios, machine learning, information security, microsoft, react
When comparing these ratings, you can pay attention, for example, to the victorious march of Python and the extinction of php, or to the "sunset" of startup topics and the rise of machine learning.
Not all tags on Habré have such obvious thematic coloring. Here, for example, a dozen tags that occurred only once, but just seemed funny to me. So: “idea is the engine of progress”, “loading from the image of a diskette”, “Iowa state”, “dramaturgy”, “superalesha”, “steam engine”, “what to do on Saturday”, “I have a fox in a meat grinder”, “and it turned out as always "," we couldn’t come up with funny tags. " To determine the topics of such articles, tags are not enough - you have to carry out thematic modeling on the texts of articles.
A more detailed analysis of the content of articles will be in the next post. Firstly, I’m going to build a model that predicts the number of times an article is viewed depending on its content. Secondly, I want to teach the neural network to generate texts in the same style as the authors of Habr. So subscribe :)