Non-HTTP Load Testing Part 1 JMeter
In the monolith, method calls were made within the same application - now, in the microservice architecture, all interaction is carried out through the network. Accordingly, the exchange rate of information between applications decreases regardless of the exchange protocol used.
In this article, we’ll show you how to write code for stress testing “non-HTTP” protocols using Apache Thrift as an example using tools like JMeter and Gatling ( Part 2 ). We will test the microservice, which should cope with 50K RPS. With one load machine we’ll try to achieve the performance stated in this tweet:
We take Thrift as a basis, but this does not play a special role, with small adjustments you can test gRPC , Avro and other protocols. The approaches in the article are general, and it will only be necessary to replace the client.
Formally, the described protocols are the RPC framework and / or data serialization system , but even the developers themselves use the word protocol .
Why JMeter and Gatling
One reason is the opensource origin. You can look into the code and try to understand what and how is implemented in the tool. And no need to pay.
On the open spaces of GitHub there are tools sharpened for specific protocols. For example, for Thrift, this is Iago from Twitter developers or Bender from Pinterest guys. But working with such frameworks dramatically increases the entry threshold and bus factor . In contrast, Gatling and even more so JMeter are widespread and have a large community, which you can always ask for advice or find a description of the problem.
Well, for us, as fans to write code in any incomprehensible situation, both tools are great.
The next question: why not take one of the two tools? At first glance, we have a parity between them and we want to understand everything in detail: which one works best, who has what problems. In addition, it is interesting to compare approaches - Threads vs Actors .
Jmeter
Although JMeter is a GUI-oriented means of loading, you can write code for it. This approach improves readability, allows you to store data in an adequate form in VCS and conduct code review without eye pain. In addition, to write a client for any protocol, the code is not only sufficient, but also a necessary condition. Finally, with the code it’s easy to turn to the development for help without telling them about a specific tool, and thereby again lower the bus factor.
Let's see what JMeter offers for loading custom protocols:
- The non-HTTP plugin. The option is, of course, good, but not implemented for our protocol and slightly modifiable.
- Writing code inside JMeter. The idea is so-so - it's hard to work with dependencies and there may be a performance problem. According to the BeanShell article, Sampler is very slow and you need to write there on the shell - let's drop it right away. JSR223 Sampler at first glance shows a decent performance - we will leave it for further testing.
- Writing code in the IDE is always nicer and more convenient. JMeter offers two sampler for this: Java and Junit.
Sampler Performance Comparison
To understand which sampler to use, we will conduct a comparative analysis. For testing, we will write a simple script that concatenates the lines in a loop and set VALUE to small (10) and larger (100).
import java.security.SecureRandom;
for (int i = 0; i < VALUE; i++) {
    new StringBuilder().append(
        new SecureRandom().nextInt());
}
All tests were conducted on JMeter 3.3:

It can be seen that JSR223 is slower, which means it crashes. Java and Junit have similar performance, in order to understand which is more convenient, you will have to disassemble both.
Java Request Sampler
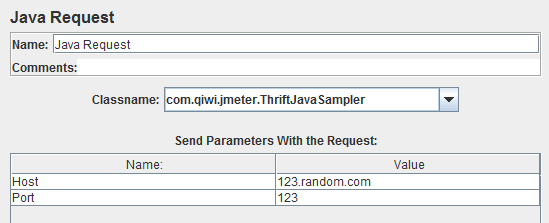
Java Sampler has only two settings: selecting a test for the load and parameters for passing to the test. You can specify a set of default parameters in the code - they will appear in the JMeter GUI. But keep in mind that after adding a new parameter directly from the GUI and saving the test plan, the parameters you just added will be reset.
The Java Sampler test extends the standard AbstractJavaSamplerClient from the JMeter library (which we connect with any build tool convenient for you, for example, Gradle). Actually, a test class can consist of the test itself, pre- and postconditions, and default parameters.
public class ThriftJavaSampler extends AbstractJavaSamplerClient {
    @Override
    public SampleResult runTest(JavaSamplerContext javaSamplerContext) {
        SampleResult sampleResult = new SampleResult();
        sampleResult.sampleStart();
        boolean result = Utility.getScenario();
        sampleResult.sampleEnd();
        sampleResult.setSuccessful(result);
        return sampleResult;
    }
}
The test method takes a JMeter context from which to take parameters, and returns SampleResult, which, in turn, contains a set of methods that help you configure the test run and evaluate the results. For our purposes, the 3 given methods are important: the start and end time of the request, as well as the result.
Junit Request Sampler
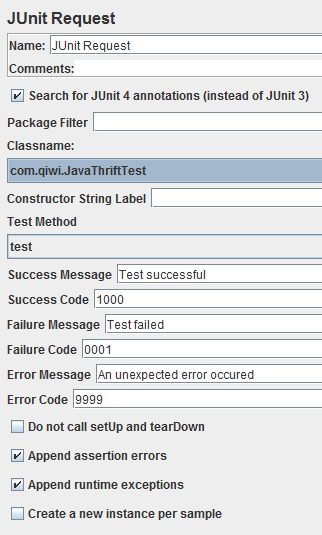
Junit Sampler also has a test selection for the load, and here you can write several methods in one class. The default parameters are thrown into the code through the User Defined Variables element. All other settings are clear from the description: do not call pre- and postconditions, add assert-s and runtime errors to the output. You should not include creating a test instance for each new request, as this will significantly slow down the performance.
The Junit Request Sampler is similar to a regular Junit test, but it works a little differently. JMeter never calls @BeforeClass and @AfterClass, so you need to use a separate test to configure the global precondition. It is also worth noting that the code from Before and After is not taken into account in the test run time.
@BeforeClass
public static void setUpClass() {assert false;}
@Before
public void setUp() {}
@Test
public void test() {}
@After
public void cleanUp() {}
@AfterClass
public static void cleanUpTest() {assert false;}
JMeter developers themselves say that the GUI mode should be used only for debugging. But here you must be careful with statics and singleton . For example, after restarting the test, everything that is declared inside the singleton will not be initialized. At the same time, without using a singleton, all objects will be reinitialized before each test, which will adversely affect performance. Static variables will forever remember their values after running the test and will not change even if they are redefined from the GUI.
Comparing both sampler, we eventually settled on the Junit Request Sampler for its simplicity and, at the same time, ease of modification.
Writing a Thrift Client
When writing a client, you should consider the whole variety of Thrift protocol settings. The main rule: the client and server must work with the same transport and protocol, have one version of artifacts.
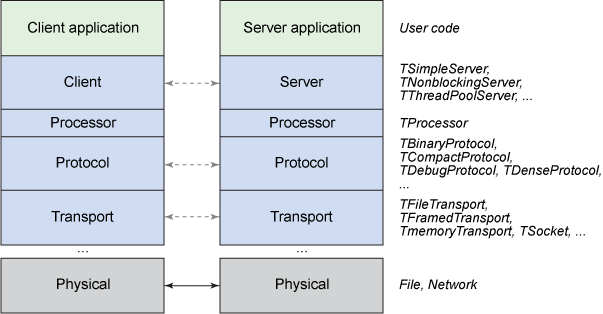
In order not to waste time creating a client in each test and not to exhaust the ports of the machine with which we generate the load, we will immediately write the client pool. For the pool, you can specify the number of clients, it will keep the required number of connections, it will only be necessary to take the client from the pool before use and return after.
asyncClientPool = new ThriftClientPool<>(() ->
    new PaymentsCreate.AsyncClient(
          (TProtocolFactory) tTransport ->
                new TMultiplexedProtocol(new TBinaryProtocol(tTransport), SERVICE),
                new TAsyncClientManager(),
                new TNonblockingSocket(host, port, TIMEOUT)),
    PoolConfig.get());
This is how we created the pool and the client. The main thing is that in this example the pool does not know anything about the implementation, and is configured at creation. This is the most basic pool written in GenericObjectPool, on the basis of which our developers made a self-regulating pool with logging and a single protocol / transport.
We wrote the code, put it in jar files and put it next to JMeter:
$JMETER_DIR/lib/junit
$JMETER_DIR/lib/ext
$JMETER_DIR/lib
You should not forget about third-party libraries and their uniqueness. Without them, the test may not even appear in the list of available ones or get a version conflict when the load starts.
JMeter without jmx
An article about writing code for JMeter will be incomplete unless we discuss how to get rid of cumbersome test plans for hundreds of XML lines in jmx files.
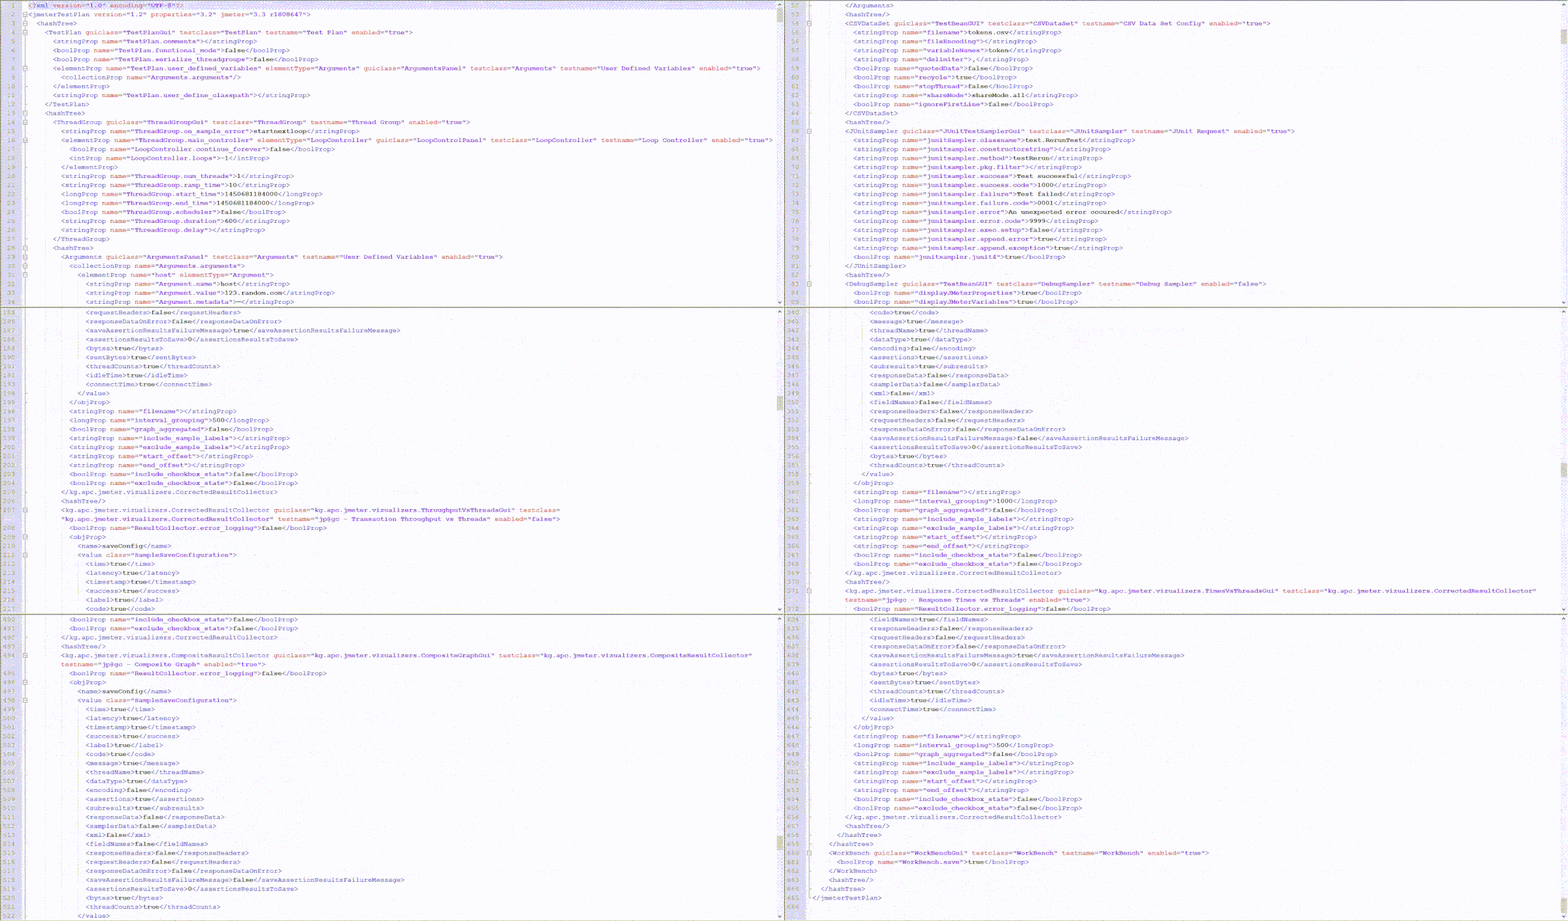
We will write the application using the JMeter libraries and go through the main points in order.
Before starting the application, you must specify where the settings for JMeter live. At the same time, it is not necessary to install JMeter locally:
final String JMETER_HOME = Utility.getJMeterHome();
JMeterUtils.loadJMeterProperties(JMETER_HOME + "jmeter.properties");
JMeterUtils.initLogging();
JMeterUtils.setLocale(Locale.ENGLISH);
JMeterUtils.setJMeterHome(JMETER_HOME);
Let's name our test plan and indicate the protocol:
TestPlan testPlan = new TestPlan("Thrift test");
TestElement sampler = Utility.getSampler();
LoopController and ThreadGroup are responsible for the load generator - how and how much we will load. Everything is standard here:
LoopController controller = new LoopController();
controller.setLoops(10);
controller.setContinueForever(false);
ThreadGroup threadGroup = new ThreadGroup();
threadGroup.setNumThreads(10);
threadGroup.setRampUp(0);
threadGroup.setDuration(30);
threadGroup.setSamplerController(controller);
Результаты в сжатом виде можно видеть в течении нагрузки (благодаря summariser), а затем сохранить их для последующей обработки (за это отвечает resultCollector):
Summariser summariser = new Summariser();
SampleSaveConfiguration saveConfiguration = new SampleSaveConfiguration(true);
ResultCollector resultCollector = new ResultCollector(summariser);
resultCollector.setFilename(JMETER_HOME + "report.jtl");
resultCollector.setSuccessOnlyLogging(true);
resultCollector.setSaveConfig(saveConfiguration);
Все элементы объединены в специальное JMeter дерево. Похоже на то, как мы это делаем в GUI моде:
HashTree config = new HashTree();
config.add(testPlan)
      .add(threadGroup)
      .add(sampler)
      .add(resultCollector);
Конфигурируем и запускаем нагрузку:
StandardJMeterEngine jMeterEngine = new StandardJMeterEngine();
jMeterEngine.configure(config);
jMeterEngine.runTest();
Все, можно забыть об XML. Ура!
Предельная нагрузка
Посмотрим, сколько сможет выдать наш генератор с одной нагрузочной машины. Естественно, все настройки системы для нагрузочного тестирования произведены, мы уже поколдовали с настройками сети и увеличили лимиты на открытые дескрипторы. После прогона получаем не очень ровный график нагрузки, согласно которому мы можем сделать около 30K RPS:
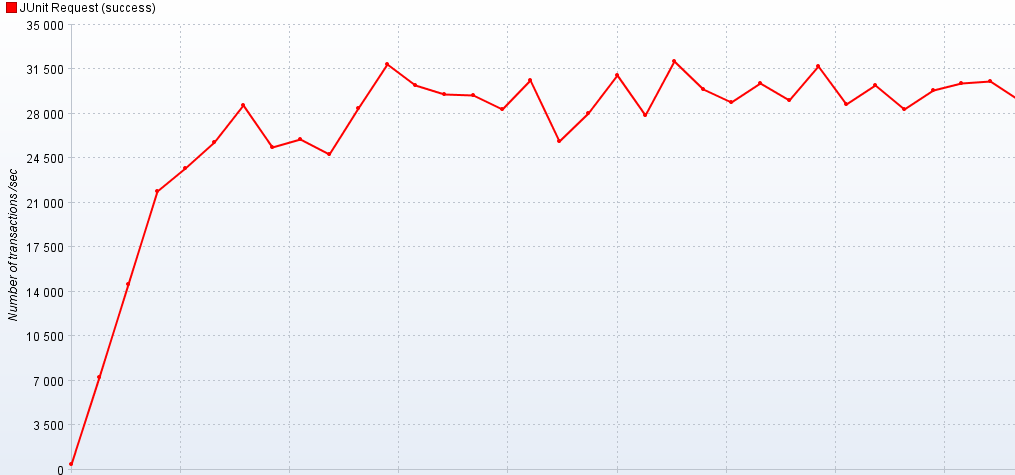

Естественно встает вопрос, это предел клиентской или серверной части? Мы поставили рядом еще один JMeter в кластере и убедились, что сервис может выдать целевые 50 тысяч RPS.
P.S.
In the next part, we will analyze the “non-HTTP” load using Gatling and tell how we managed to increase its performance tenfold.