Analysis of 2018 Kaggle ML & DS Survey Results

Kaggle is a well-known platform for holding machine learning competitions where the number of registered users exceeded 2.5 million. Thousands of data scientists from different countries participate in the competitions, and Kaggle became interested in what the audience is. In October 2018, the second survey was already organized and 23,859 people from 147 countries responded to it.
In the survey there were several dozen questions on a variety of topics: gender and age, education and work, experience and skills, programming languages used and software, and much more.
But Kaggle is not just a competition site, it’s also possible to publish data research or competition solutions (they are called kernels and look like Jupyter Notebook), so the results of the survey were made publicly available and a competition was organized for the best research of these data. I also took part and did not receive a cash prize, but my kernel took the sixth place in terms of votes. I would like to share the results of my analysis.
There is a lot of data and it can be viewed from different sides. I was interested in the differences between people from different countries, so most of the research will compare people from Russia (since we live here), America (as the most advanced country in terms of DS), India (as a poor country with a large number of DS) and other countries.
Most of the graphs and analysis are taken from my kernel (anyone can see the Python code there), but there are also new ideas.
general review
Immediately, I note that those who answered the questions are not quite a representative sample of data scientists. Not everyone is interested in spending time on competitions, someone just did not hear about this platform, finally, ~ 24 thousand respondents - only a small part of all Kaggle participants. Nevertheless, we only have these data, so in the future I will assume that the available information is enough to draw conclusions on the countries and in general.
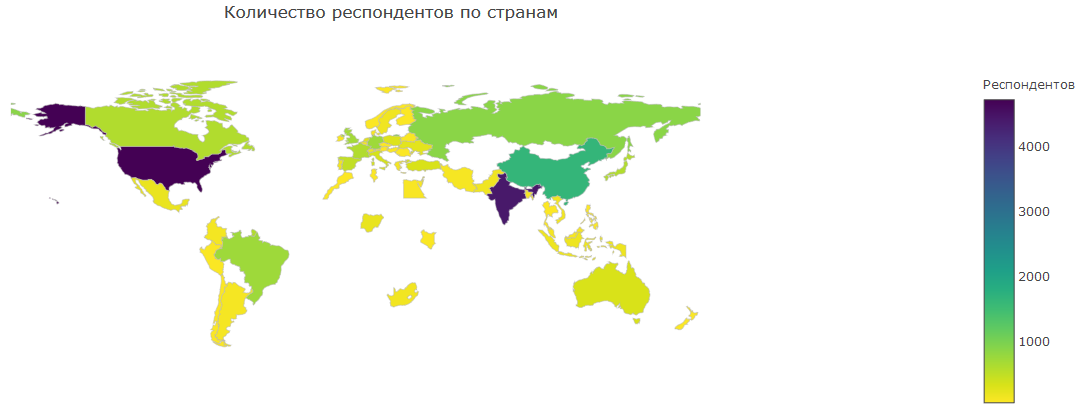
On this map you can see the number of respondents in different countries. The bulk of - America and India. At present, America, perhaps, can be called a leader in DS, plus this area has become popular there before, which explains so many people. India is a country with a huge population that has long begun to pay attention to IT. Thanks to the courses from Siraj, Raval DS is gaining popularity and attracting a large number of Indians. China lags far behind, but I assume that this is due to the closeness of their Internet.
There are also quite a lot of DS in Russia, Canada, Brazil and Europe, but in these countries the population is much smaller, so they cannot compete in the number of participants.
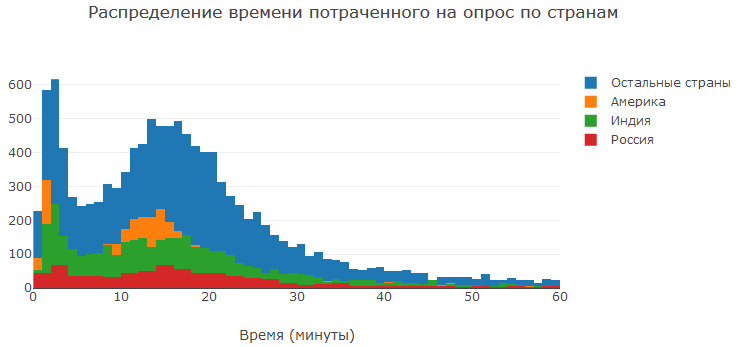
Let's see how much time people spent on the survey. As you can see, many people spent 10-20 minutes on the survey, which is quite enough for a thoughtful answer to the questions. Those who answered the questions in less than a couple of minutes, apparently, simply closed the survey immediately or almost immediately. Someone might not like the survey, someone might be too lazy to answer, someone did not want to answer the question about his field (more on this below). Generally speaking, there were still people who spent dozens of hours polling. Probably, they just forgot about the open tab :)
Age and Age Structure
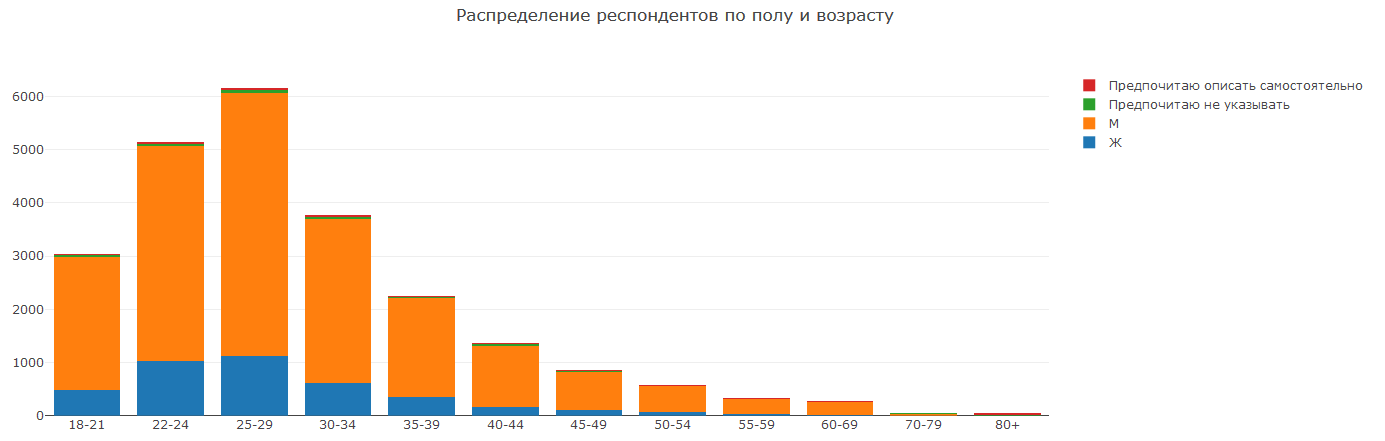
In general, the picture is not surprising. Most of all young people of 22-29 years old or even 18-34 participate in Kaggle. These are schoolchildren, students and recent graduates. Most likely, all of them either seek to acquire knowledge or achieve impressive results in order to gain an advantage when looking for a job. There are more men than women. In general, this is not surprising, given that our field unites IT, mathematics and other areas in which gender imbalance has long been observed. Do I need to do something actively to correct this imbalance? I prefer not to discuss this article.
It is worth noting that you could also not specify the floor or specify it yourself. Let's look at the most popular options:
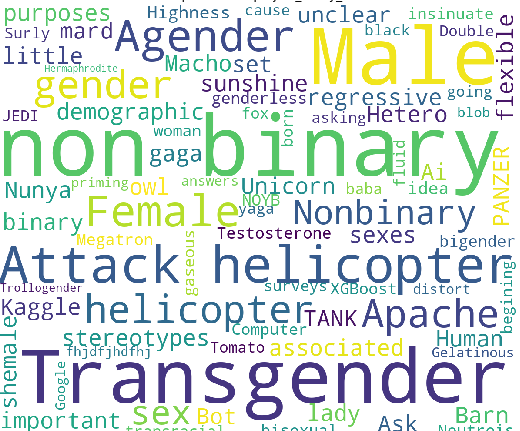
Among the answers in free form:
- non-binary (adequate)
- Attack helicopter (cool! Really would like to look at the parents)
- Male (why not just choose this option?)
- Who are you to insinuate? I have a gender? (well, because you're a man?)
- Kaggle (well, at least not Kagglosexual)
- Your Highness (didn't you confuse this question with others?)
- A little sunshine. :) (it's so cute!)
- Double male (straight macho!)
- Male and female are not gender. Gender is a regressive set of stereotypes associated with our sex. Ask what sex we are for demographic purposes, if that is what is important. (SWJ detected!)
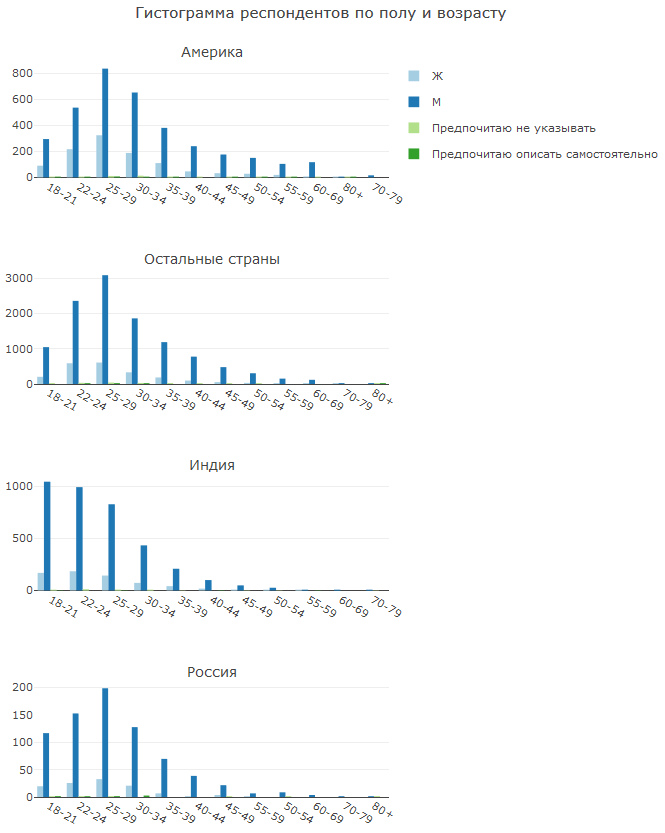
It is quite interesting to look at the differences in the age and sex structure of different countries.
In America, the proportion of women is higher than in other countries. This is explained by the fact that in the past few years there has been an active struggle against "gender inequality". Whether she needs it or not is a question, but the results are visible.
India is distinguished by a large number of young DS. It seems that the guys think in advance about the future and pump over their skills since childhood. Later we will see that the education system in India leaves much to be desired.
Russia is generally similar to other countries.
Education

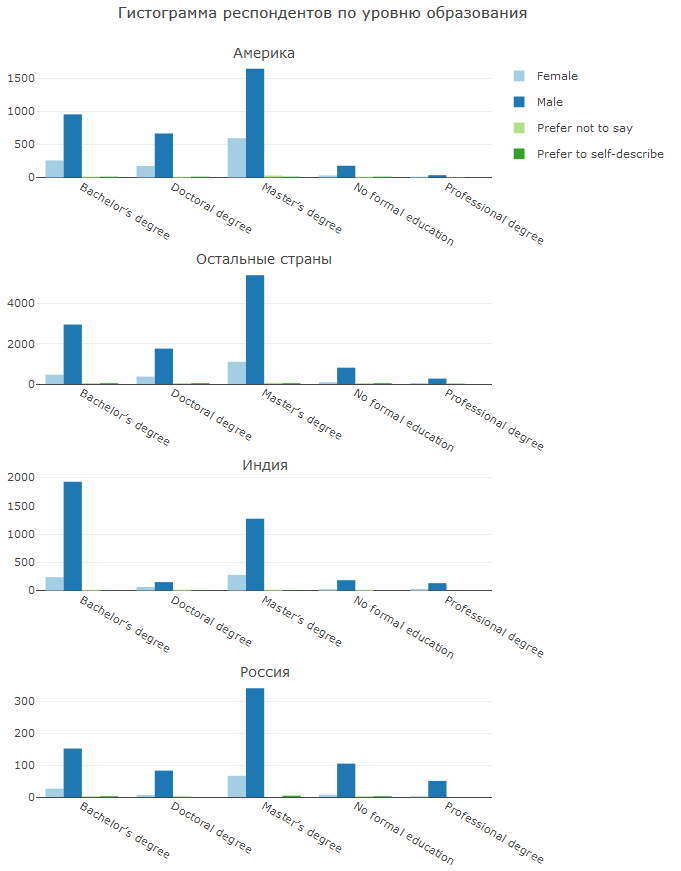

As noted earlier, in India there is a high proportion of students or bachelors, but there are practically no PhD holders. Russia stands out for the fact that many DS have no formal education (or they did not want to answer). In general, this is impressive - apparently they were able, with their work and persistence, to enter the sphere of DS.
It is interesting to look at how in different countries DS appear from different directions. CS, IT and mathematics / statistics are prevalent in all countries, but in India there is a technical bias, in America, business disciplines (including economics) are more important, and in Russia there is also physics.
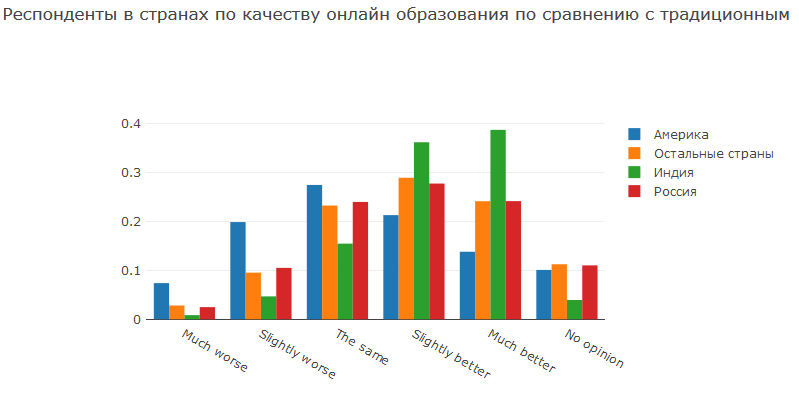
In this question, people were asked their opinion on whether the quality of courses on online platforms is better or worse than on traditional education. And here is the difference between countries. Education in India leaves much to be desired. Maybe there are just not enough teachers, maybe the quality of education is rather low, in any case, most Indians prefer online courses. America also has a developed education system, as a result, almost a third of people believe that education in universities is of higher quality. In Russia and the rest of the world, the quality of traditional education is not bad and is almost as good as its competitors.
Position
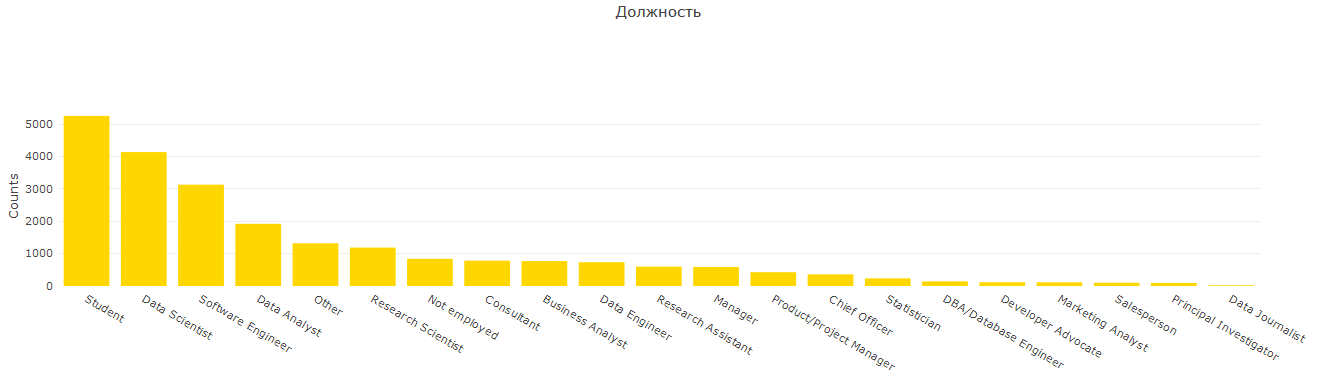
As part of one of the questions asked to indicate the position, it seems to me that for the tasks of this report so many options are simply not necessary. After some reflection, I formed 7 groups and I got this picture:
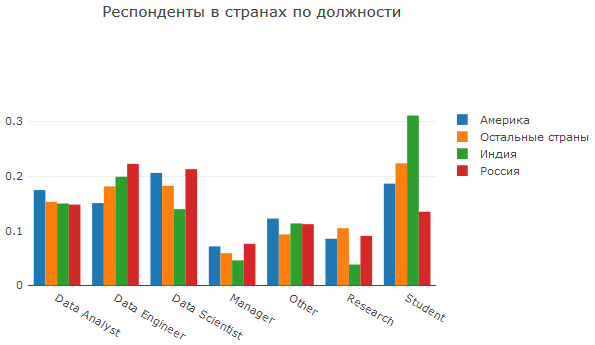
Here we see another confirmation that many Indians on Kaggle are students and / or representatives of more technical directions. America stands out for its focus on analytics, and Russia for its application areas.
But let's look at a more detailed picture:
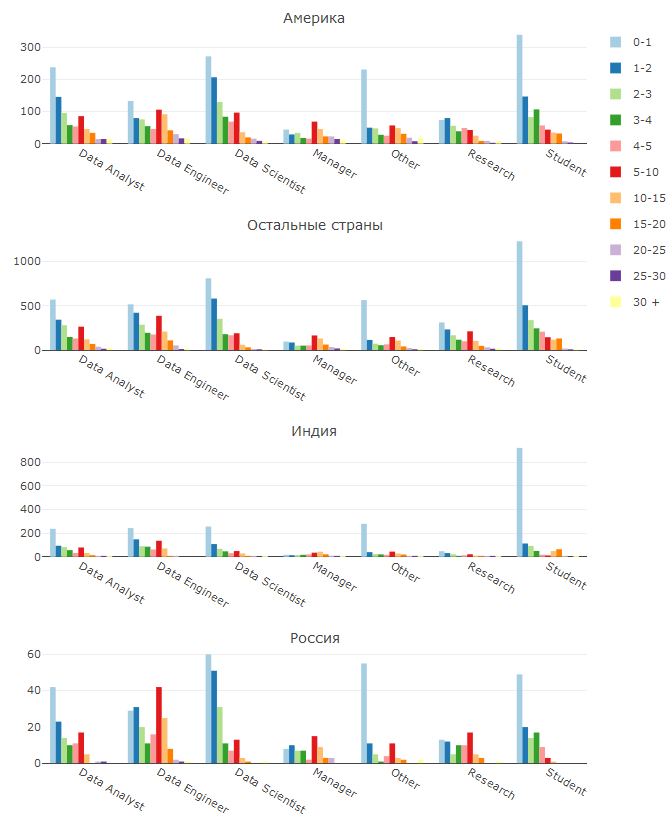
Here we see how long a person has worked in a current position.
The first thing that catches your eye is the overwhelming number of people in all positions are beginners. I see 2 explanations for this fact: either university graduates or those who have changed the scope of work. The DS / ML hyip has started recently and, as it seems to me, is only getting stronger, as a result, more and more people want to join a new direction and create their own Artificial Intelligence (because people outside DS rarely realize that there is no AI in the coming years).
Another interesting phenomenon is a fairly large proportion of experienced data engineers. I suppose that a lot of experienced programmers decided to roll into DS, but DE was closer to them - most of the existing skills are suitable for outputting ML solutions to production. Interestingly, in Russia the share of DE from 5-10 and 10-15 years of experience is quite high, apparently these are senior Java developers and other languages that are highly in demand for high-load systems. Personally, I am particularly surprised by the high proportion of experienced researchers in Russia, until I understood the reasons for this.
America stands out among other countries with a high proportion of analysts. There are many reasons for this: the fact that in America DS is often taken for analytical positions, and the fact that in a number of large companies the data analyst in fact does DS work, and the fact that these may be re-qualified statistics.
Since we are talking about work, one cannot but touch upon the question of wages.
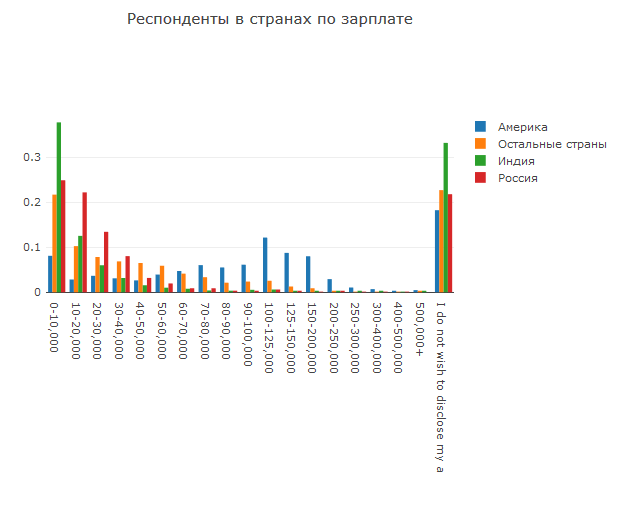
Everything is quite expected here: wages in India are lower than anything, in Russia a little higher, and American wages are the highest.
Self-confidence

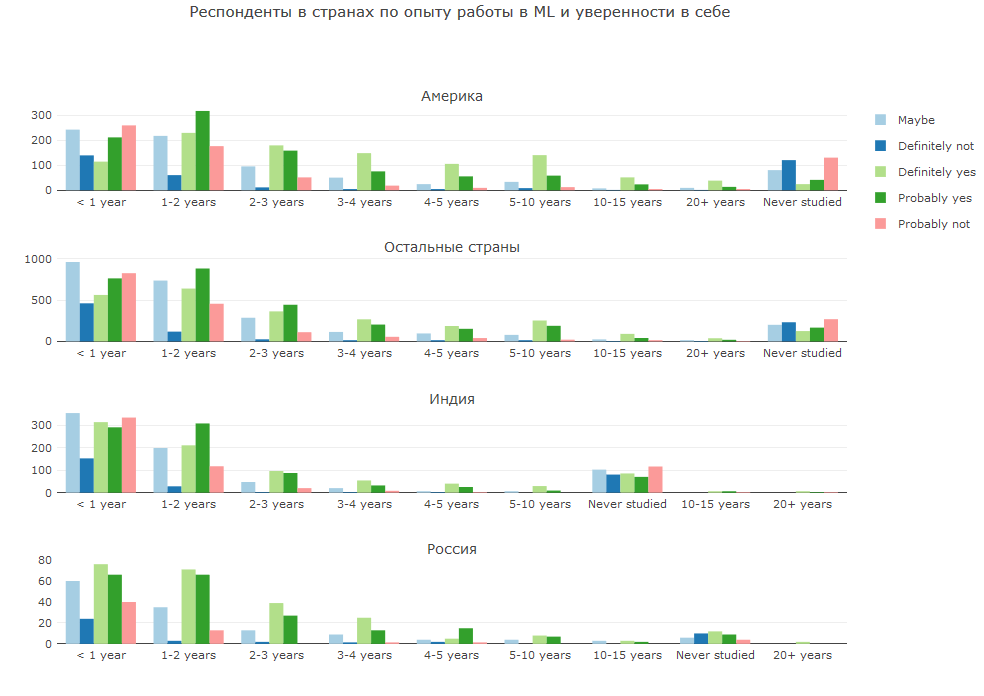
The combination of answers to 2 questions seemed to me very interesting. The first question is experience in ML, the second is whether you consider yourself to be DS. Here you can observe either the difference in worldview and self-perception, or a different understanding of the issues.
In most countries, newcomers with work experience of less than two years have a mixed opinion - someone is already self-confident, someone strongly doubts. As experience grows, self-confidence grows. In Russia, the overwhelming majority of beginners consider themselves to be DS, but with as they gain experience, confidence in this drops.
Then there will be questions, where it was possible to indicate several answers, so that the summation of shares may well give more than 100%
Visited resources
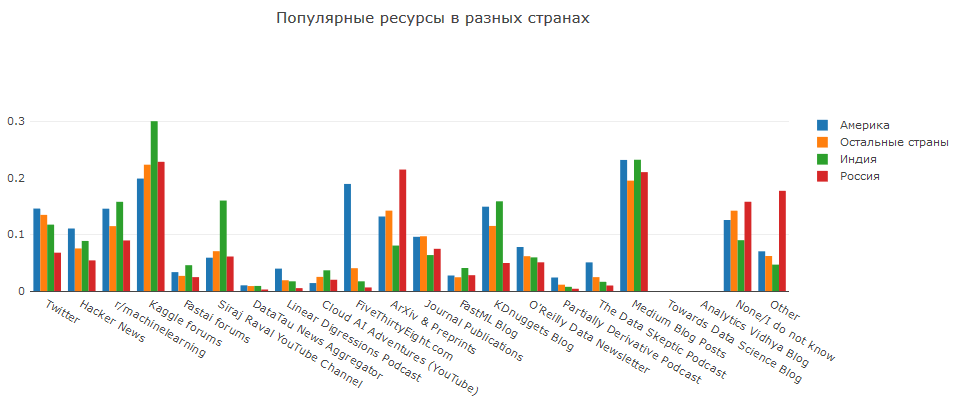
Kaggle and Medium respect everyone. In Russia, they like to read articles on ArXiV, in America they prefer https://fivethirtyeight.com (and in other countries they practically do not visit it), and in India they are fan of Siraj.
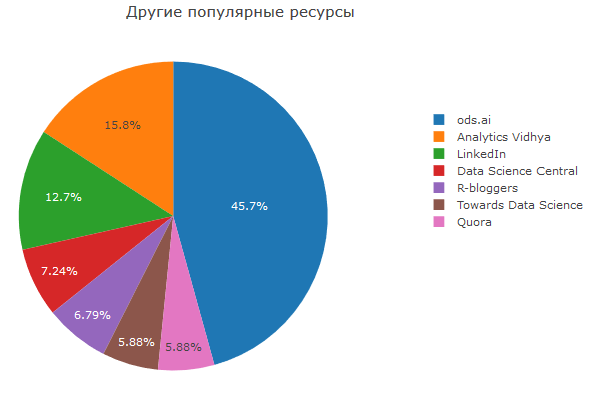
Separately, I would like to mention ods.ai, which turned out to be the most popular resource, among those that people indicated manually. Who is not yet in our community, join :)
IDE and programming languages

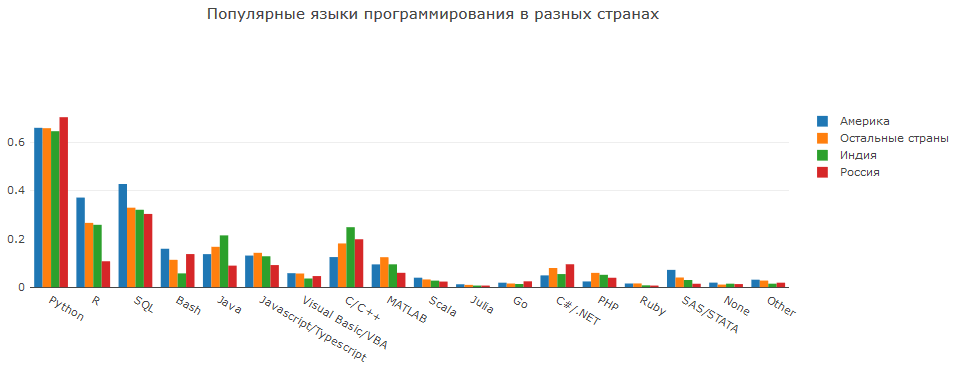
In terms of using IDE, people can be divided into 2 main groups: using IDE with built-in visualization (Jupyter Notebook, RStudio, Spyder) and using classical IDE (VS Code, Vim).
America stands out for a high proportion of analysts using R and, as a result, RStudio. However, ide such as Vim or Atom are also famous. In Russia, Pycharm is popular not only among DS, but also among programmers in general, so the number of people using it is not surprising.
SQl, Java, Bash, C / C ++ are also important languages for the DS domain.
Frameworks
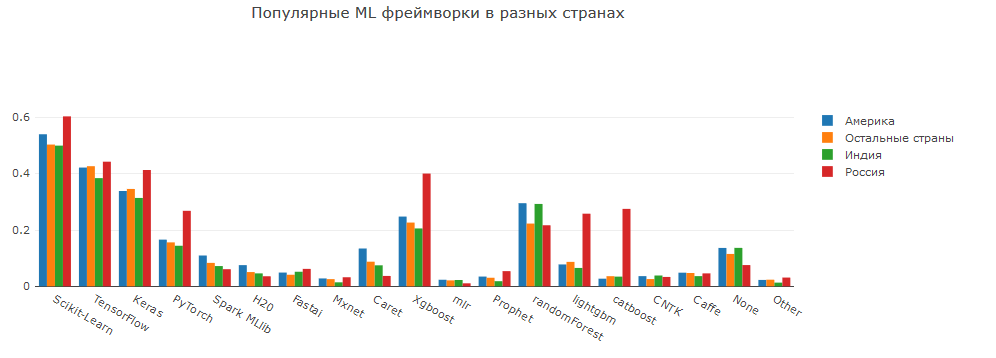
For me, it is somewhat surprising that the proportion of using DL frameworks is not much less than the proportion of those using sklearn. Perhaps many people are attracted to neural networks, and they want to study them from the very beginning; maybe business is starting to use neurons in its tasks; Or maybe it’s just that many Kaggle participants try to compete in pictures and texts with great interest.
Separately, I would like to note the high proportion of using Pytorch and the library of gradient boosting in Russia. LGB / XGB / catboost are the most well-known implementations of gradient boosting, and they show high quality in tabular data. Pytorch appeared quite a long time, but began to acquire high popularity in the last 1-2 years.
Visualization
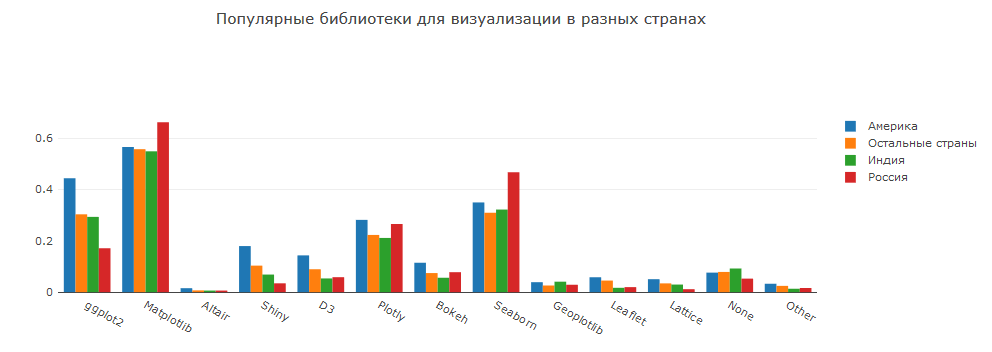
What kind of data analysis without visualizations! In general, the picture is not surprising. R is ggplot2 and shiny. Python is matplotlib + seaborn, plotly / bokeh.
D3 allows you to create cool visualization, but it is quite difficult to work with.
Altair is a library on Vega-Lite, I have hopes that in the future it will gain popularity due to interesting interactive visualizations available in it.
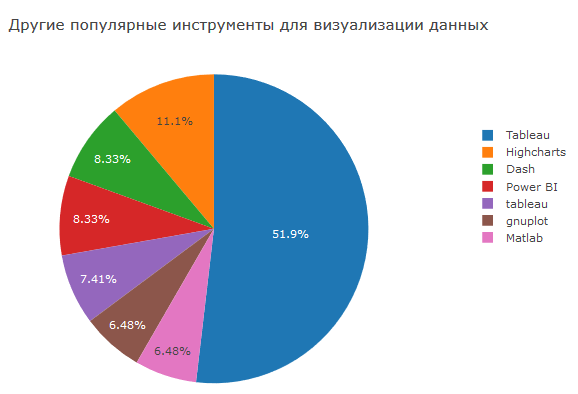
Tableau and other BI software continue to remain popular, which is not surprising - these are high-quality solutions that are supported and can integrate a lot with what.
Online Education Platforms
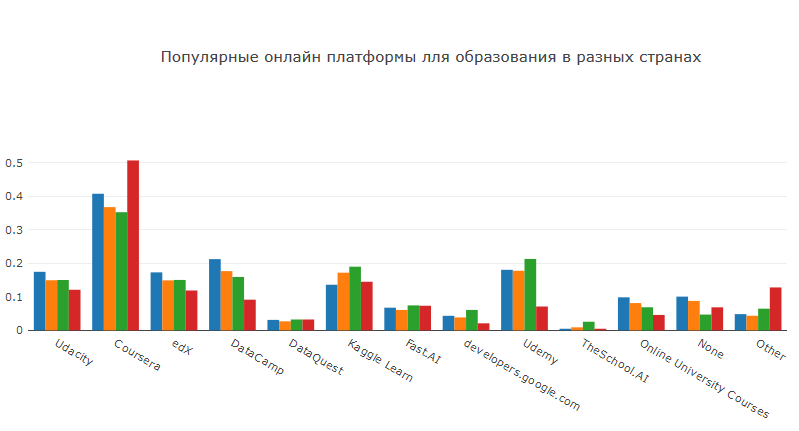
Coursera is the market leader in online education courses. There you can find courses on almost any topic and level. An important factor is also the fact that you can apply for financial assistance and take courses completely free of charge. Udacity, Udemy and edX are less popular, but nevertheless, they can also find a large number of interesting courses. Kaggle launched its own educational initiative some time ago. The nice thing is that the courses are made in the form of kernels, which gives practice in using the possibilities of Kaggle. Courses from DataCamp have a unique format that allows you to give a point practice on certain topics, but this platform is unlikely to provide in-depth knowledge.
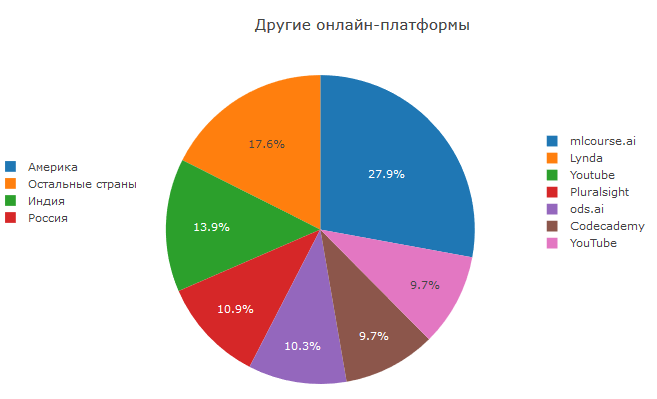
Separately, it is worth noting that mlcourse.ai from ods.ai is the most popular of the options specified by users. Recently, the fourth session of the course ended in which more than 7.5 thousand people were registered. Due to the fact that the main communication takes place in Slak, the course ends with an impressive proportion of people - significantly higher than other free ML courses. This course provides not only theoretical knowledge and complex homework, but also the practice of participating in competitions at Kaggle.
Interpretation tools
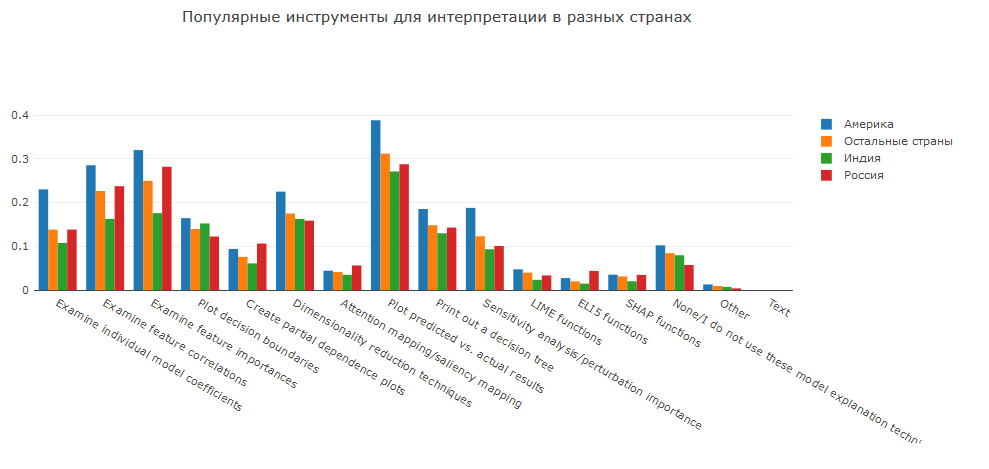
Finally, let's see how different people analyze the results of the models.
The analysis of the predictions themselves and the comparison of their distribution with the distribution of the target variable is a basic, but qualitative, way of analysis. Studying the coefficients of linear models or the importance of features in wooden models allows us to find features that most affect predictions.
In addition, special frameworks for model analysis have become popular recently: SHAP, LIME and ELI5. They provide an explanation not only for simple models, but even for some of those that are considered black boxes.
Results
We looked at the differences between DS in different countries of the world, and also found out what brings them together. This analysis does not cover all the available data, but shows those that seemed most interesting to me. Those interested can conduct their research on this data :)
Thanks for attention!