R, Asterisk and wardrobe
It is a continuation of previous publications . The main purpose of publications is to demonstrate the capabilities of R in solving various "routine" data processing tasks that arise in business. The main emphasis is on creating a complete solution for the end user, and not on the fundamental solution of a particular problem by a set of commands in the console. The schematic prototype and the product off the assembly line have more differences than similarities.
In the fine mechanics of R there are a huge number of specialized blogs, books, as well as github. But they usually turn to them only after they see that solving the problem by means of R is possible and very elegant.
How it all started
In general, the initial situation is very typical for companies that have at least some semblance of a call center serving the requests of external users. There is PBX (in our case, several geographically dispersed Asterisk instances, version 13LTS). There is an information system / system in which operators contribute what they heard from users. And there is a pile of automated business processes for processing user requests.
There is still a vertical of leadership from the head of the call center to top management, as well as related units, for example, marketing, which for strategic management require a summary of “how people live,” how KPI behave and “where business is moving.” And here each other's desires and opportunities find themselves very weakly.
If there was already some report generator in the service desk part, then Asterisk initially had nothing but logs and cdr.
Step # 1
We tried to follow the standard path, looked at the existing tools for Asterisk. As a first approximation, we settled on free versions of programs:
It got a little better. Responsible employees were finally able to prepare the required analytical summary. However, the quality of this reporting was severely lame for several reasons:
- The processing scripts in asterisk were very complex and written through macros. Regularly CDR files are generated with an emphasis on minimizing the number of records. Therefore, in the resulting CDR during the “collapse” of internal transfers and the unification of the shoulders, a number of important data was lost. Both A numbers (due to macros) and B numbers (when combining shoulders initiated by the operator).
- Queues also contain incomplete information. There are no records on IVR, no information on transfer to the outside. And there’s a lot more.
- The programs themselves can and produce generally accepted statistics on call centers, but in relation to our tasks, more than half of the output was not very useful for business, because they did not answer the right questions.
- Free versions are cut down by functionality + I had to “finish” php with my hands, so that at least it would not fall. I neglect incorrect duration calculations, for their insignificance (~ 10%). For simplicity, I attribute this to our specific asterisk settings.
- Data from external directories and systems cannot be attached. All just hands in excel. For example, to present a report not by numbers, but by the name of the operator, taking into account the shift schedule.
- There is no graphical representation, and those offered in paid versions are far from what is required.
- Different systems almost always gave different numerical results. Sometimes the difference reached hundreds of percent. Obviously, this was due to the complexity of the calls, as well as differences in the calculation algorithms embedded in the programs.
Step number 2
We took up an independent analysis of cdr and log files. R. Several thousand calls to ChNN result in 1-2 GB of records in packed form for a year of work. For modern laptops - this is complete nonsense, not to mention server hardware.
And then interesting things began. Even the most cursory glance of various data slices caused a lot of technical issues that led to asterisk tuning.
- Why macros do not provide the necessary information for certain types of conversations?
- Why are identifiers sometimes lost, allowing you to bind tripartite sessions in which the operator is an intermediary?
- Why do time metrics in cdr not always coincide with real time events? Time in IVR is not always and not in full must be considered (depends on the logic), and IVRs are different.
- Why are there not a number of required parameters in the queues?
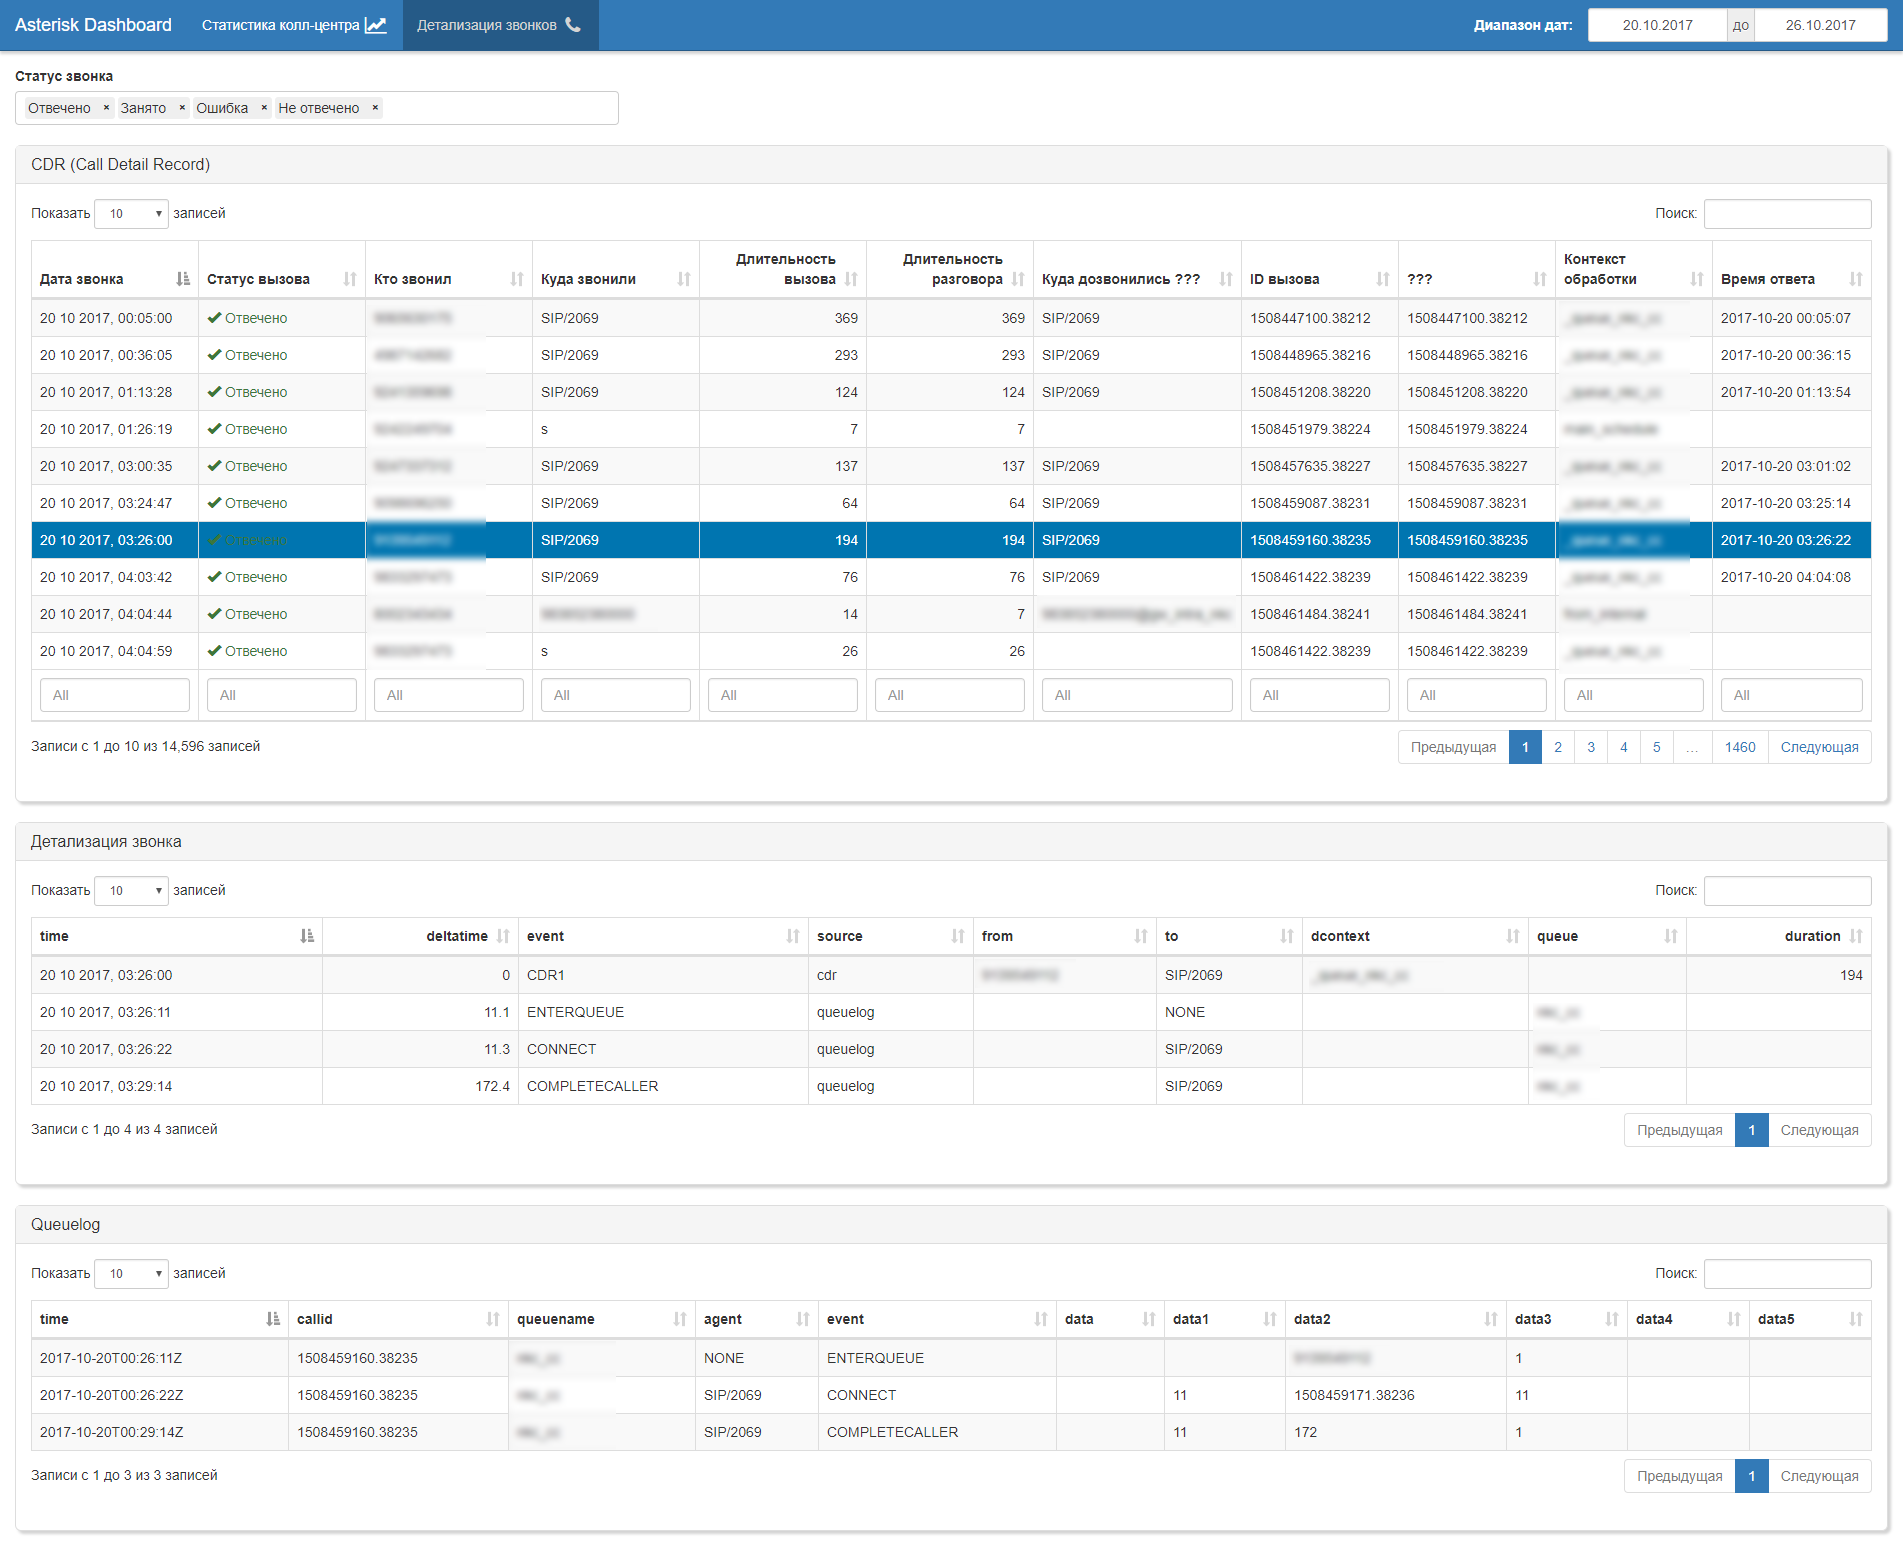
But this is only the technical side of the issue. After a careful study of the data, it was decided to abandon the use of cdr (too incomplete and inaccurate data was written there, and no one was optimistic to radically refine the logic of cdr formation on the product. Therefore, we switched to a call-flow analysis model based on the data obtained from the log queues (queue log) with the following logic:
- we reconstruct all events within the framework of call flow using the identifiers of the primary session and linked sessions;
- we conduct event thinning based on the business logic of calculating kpi (multiple RING NO ANSWER; multiple ENTER QUEUE in the same queue or in another; ATTENDENT TRANSFER \ BLIND TRANSFER to external numbers, etc. ...);
- based on the arranged cleaned call flow, we recalculate the actual durations of all events based on their time stamps;
- we enrich call-flow with data from external sources, in particular, from the schedule of duty shifts of operators, in order to get the name from the operator number;
- we get a "clean" set of "raw" data for which we are already building all the necessary reporting.
In general, automatic generation of a regular set of business artifacts follows: dashboards, reports, uploads (xls, pdf, csv, doc, ppt, ...)
The workstation itself for the head of the call center is built on Shiny.

It is important that after such a “cleaning” of the data, you could sit down at the table with the business and discuss the metrics (KPI) and the methodology for calculating them. Is the time spent by the subscriber in the internal IVR to consider the duration of the call or not? Whether to consider CONNECT the subsequent instant return to queue as the answer of the operator or not? How to decompose KPI operators and queues for a subscriber to stay in several queues? How to correlate the average waiting time in the queue with the time of day and the number of operators in the shift? What are some typical “optimization” scenarios for operators? And a ton of other questions. The best part is that all questions can be given a clear and unambiguous answer.
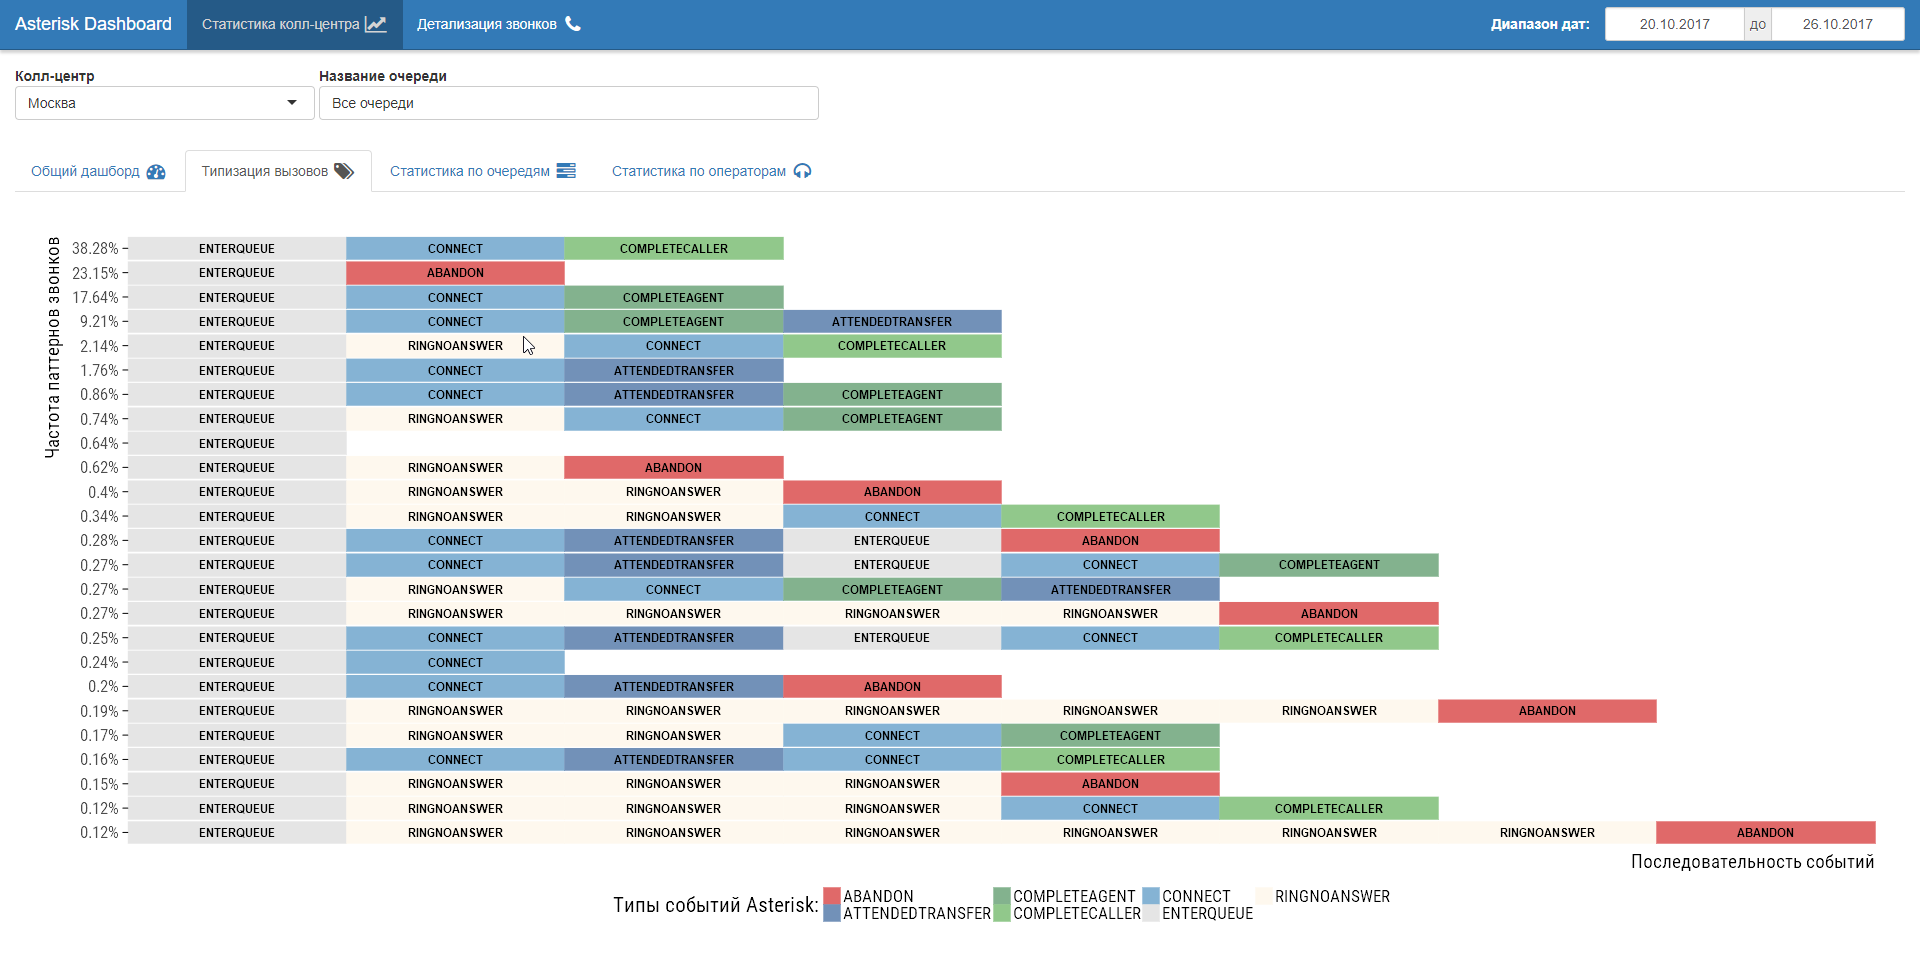
An additional plus to the transition to event analysis of call-flow is the ability to study scenarios of the call center (process mining). In fact, reverse engineering of business processes in their wake in call center logs. Curious things show up!
Step number 3
Transition to the analysis of AMI events. In general, this is the most universal way, but it requires a little more computing power. After minor adjustment of the queue logs, for a particular asterisk, the acuity in the AMI analysis disappeared, but storing them in the context of the historical work of the asterisk (Troubleshooting) remains useful. Also, working with AMI ensures independence from the private settings of an individual asterisk, which will be relevant when connecting the following. To ensure the speed of working with AMI, we dump all 151 types of events with 619 possible fields in ClickHouse.
Afterword
As many may note, the task is very private, the amount of data is small. But from this, the significance of this task for business does not decrease in any way. The use of R made it possible to quickly and elegantly solve it, while creating convenient workstations for ordinary business users. And from the point of view of industrial programming, everything is ok too: packaging, documenting functions using roxygen tools, autotests, logging, everything that can be overlaid with online checks and assertions.
Now that you have a solid foundation, you can safely move on to forecasting and operational analytics.
The answer to the question “what does the wardrobe have to do with it?”, Alas, is very prosaic. Because skeletons rained down from him, which were carefully hidden by the call center operators. And R + Shiny served as a key for its opening.
Previous post: Do you already use R in business?