What is DFD (Data Flow Chart)
 In the comments on one of my previous articles on IDEF0, one of the users asked me to tell you more about what DFD is. This is a somewhat confusing concept; many of my clients also ask questions about data streams and charting standards. So I decided to devote this article to DFD.
DFD is a common abbreviation for English. data flow diagrams - data flow diagrams. This is the name of the graphical structural analysis methodology, which describes sources and destinations of data external to the system, logical functions, data streams, and data warehouses that are accessed. The data flow diagram (DFD) is one of the main tools for structural analysis and design of information systems that existed before the widespread use of UML. Wikipedia
In my opinion, the definition from the Russian-language Wikipedia is somewhat overloaded with information and, as a result, is unnecessarily difficult to understand. In addition, I personally think that DFD and UML are different tools, and therefore it is incorrect to say that DFD is just the predecessor of UML.
For myself, I deduced the following wording:
DFD is a notation designed to model information systems in terms of data storage, processing and transmission.
Why DFD Notation?
Historically, the syntax of this notation is applied in two versions - Jordan (Yourdon) and Heine-Sarson (Gane-Sarson). The differences between them are in the table below:
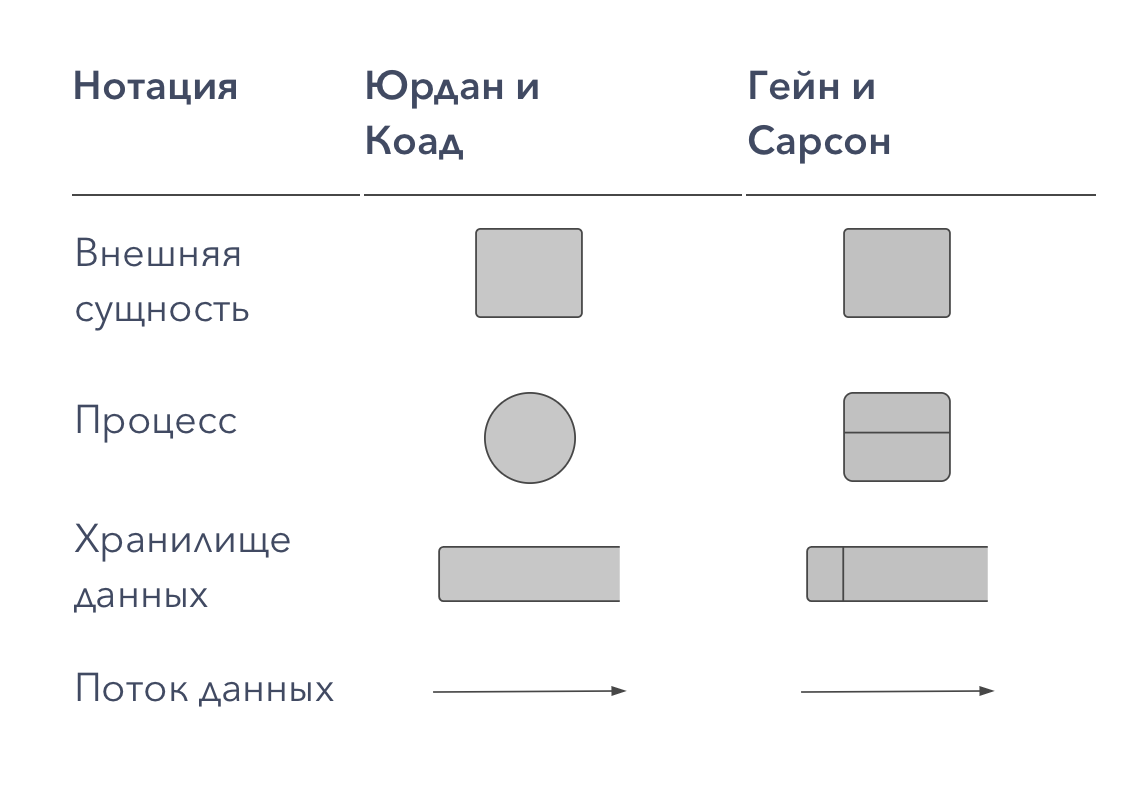
I myself use only one of the options, according to Hein and Sarson. But when I studied the material before writing this article, I saw this comparison table. I believe that it is important not so much for choosing a syntax option, it will depend more on the choice of software for creating notations and your personal preferences, but as a clear illustration of the fact that there is no hard syntax in DFD, as, for example, in BPMN. Here you can use different options, the main thing is that they are understandable to you and your customers. DFD notations are a convenient tool for creating ad hoc charts that can be done quickly and with maximum freedom.
This type of notation is used when a description of the system as a data warehouse is required. Those. the notation should clearly answer the questions:
- What does an information system consist of?
- What does it take to process information?
Directly DFD notation consists of the following elements:
- Process (Eng. Process) , i.e. The function or sequence of actions that must be taken in order for the data to be processed. This may be creating an order, registering a customer, etc. Verbs are used in process names, i.e. “Create a customer” (not “create a customer”) or “process an order” (not “order execution”). There is no strict system of requirements, as, for example, in IDEF0 or BPMN, where notations have strictly defined syntax, since they can be executable. But still, certain rules should be followed so as not to confuse others when reading DFDs.
- External Entities. These are any objects that are not included in the system itself, but are for it a source of information or recipients of any information from the system after data processing. It can be a person, an external system, any storage media and data storage.
- Data store . Internal data storage for processes in the system. The data received before processing and the result after processing, as well as intermediate values should be stored somewhere. This is a database, table, or any other option for organizing and storing data. This will store customer data, customer requests, invoices and any other data that has entered the system or is the result of processing processes.
- Data flow . The notation is displayed in the form of arrows that show which information comes in and which comes from a particular block in the diagram.
DFD notation can describe any actions, including the process of selling or shipping goods, working with applications from customers or purchasing materials, in terms of describing the system. This notation helps to understand what the system should consist of, what is needed to automate the business process. But DFD is not a direct description of a business process. Here, for example, there is no such important parameter as time. Also, in this notation, the conditions and the “fork” are not provided. In DFD, we look at where the data comes from, what data is needed, its processing, and where the results are sent. Those. This notation describes not so much the process itself as the movement of data streams. To work with processes, I recommend using BPMN or IDEF3 (I'll talk about it another time).
How to create DFD notations
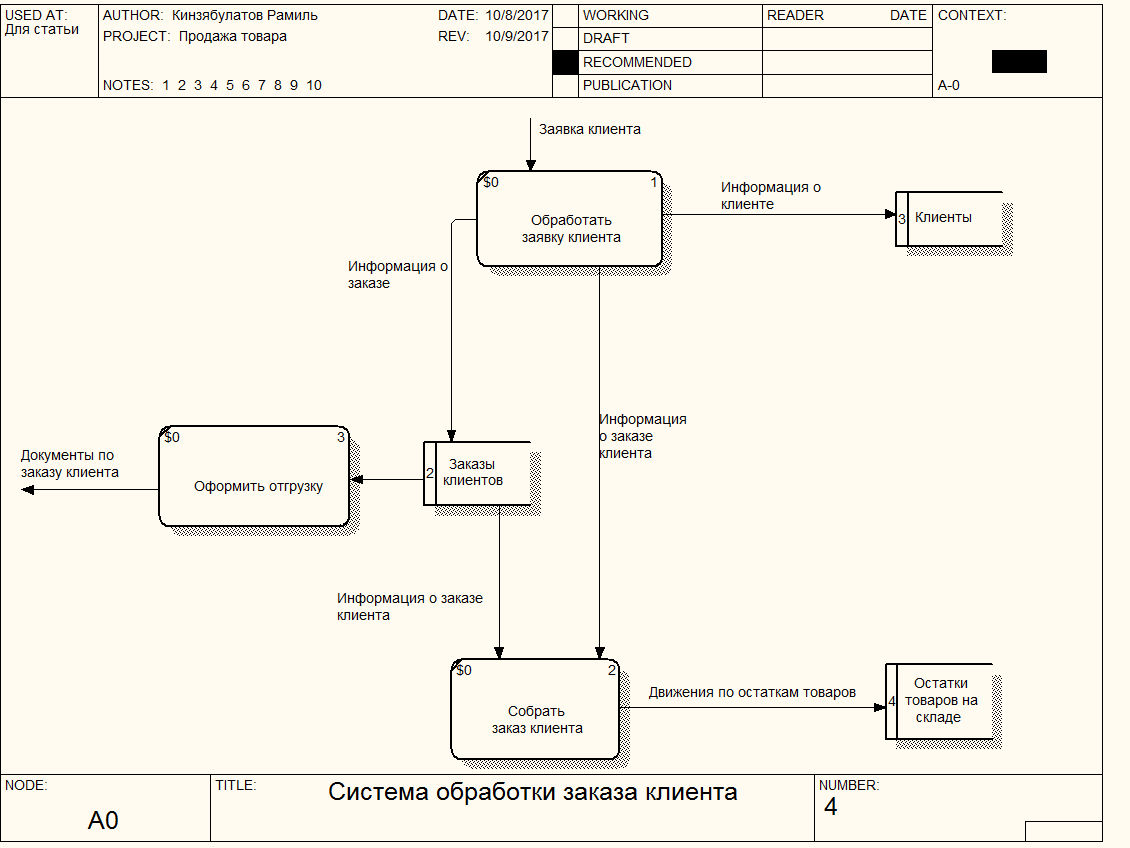
Let’s take an example of sales automation notation. Suppose we have a client who makes an application through the site or by phone. There is a manager who registers this application. Thus, data appears in the system - the client and his order. The warehouse employee must see this and make the shipment of goods with the execution of all necessary documents and transfer the documents to the client.
The sequence is as follows:
- The client provides his data and application.
- The manager checks and enters the received data into the system.
- The warehouse employee generates documents, for example, an invoice, and ships the goods.
- The client receives the goods and a package of documents to him.
We need to see this sequence of actions in terms of data storage and working with them in an IT system.
From the point of view of DFD, we have:
- A customer is an external entity that is a source of data and a result.
- The order processing process (confirmation and posting of data in the system by the manager).
- Collecting an order at the warehouse (after receiving the application).
- Registration of shipment (creation of necessary documents).
What rules you need to know to create a DFD diagram:
- Each process must have at least one input and one output. The meaning of the processes here is to process the data, and therefore the process should receive the data (incoming arrow) and give it somewhere after processing (outgoing arrow);
- The data processing process must have an external incoming arrow (data from an external entity). In order for any such process to start working, it is not enough to use data from the repository, new information must be received for subsequent processing;
- Arrows cannot directly bind data stores; all communications go through processes. It makes no sense to simply move data from one place to another, and this is how the direct connection between the two storages is read by the arrow. The data comes in so that some actions are performed, in our example, the sales process was carried out. And this is possible only through processing (process);
- All processes must be connected either with other processes or with other data warehouses. Processes do not exist on their own, and therefore the result must be transmitted somewhere;
- Decomposition. DFD diagrams provide the ability to create large processes and decompose them into subprocesses with a detailed description of the actions. For example, we can create the process of “creating an application”, which is then decomposed into a sequence of actions, for example, to receive an application, separately — checking and receiving customer data, if the goods in an online store are sold under an order, then you also need to obtain data when generating an application from the supplier about the availability of the necessary items, etc. And then in the upper diagram we will have a block “processing an application”, and when decomposing we will get a diagram with a detailed sequence of actions at this stage. Moreover, at no stage will we have conditions and branching. There will be a process and its decomposition up to 3-4 levels deep.
What the diagram will look like (without decomposition, top level):
And the decomposition of the main element of our diagram:
Where DFD Notations Are Used
DFD diagrams are actively used in software development. Wherein:
- data warehouses are spreadsheets and databases,
- external entities - clients or other databases, including from other programs (integration and data exchange),
- processes are the functions and modules in the system.
DFD notations are also convenient for analysis when the system is considered from the point of view of workflow. At the same time, you can clearly see where the data is stored, how documentation is exchanged, where business process organization errors were made in this process, etc. But here the use of DFD diagrams requires special care. Nevertheless, this is not a description of the business process as such, but rather a diagram of data movement during the implementation of business processes. But as an auxiliary option, including, to clearly demonstrate to the client the existing problems and methods of optimization, this kind of notation is quite suitable.
For example, to identify document flow problems, duplication of documents, or, conversely, missing documentation or electronic data in the system, it is very convenient to create a separate description of the business process, and then a DFD notation to it. Or vice versa, a DFD notation is created in advance to understand the basics of business and the features of the implementation of workflow. It helps to identify, for example, the absence in the automation system of important documents that are actually created (on paper), but are not displayed in the system. And then an optimized business process is already being built taking into account the identified nuances of the workflow.
DFD Notations - It's Easy!
I believe that DFD notation is really a lot easier than it seems at first glance. The main thing is to clearly understand the limitations of constructing this type of diagram (lack of conditions, time, etc.) and apply them where exactly this approach will be more convenient. You may find your own DFD applications that I have not described above. In my list there are only those options that I use in practice.
Which is especially convenient in DFD notations, it is not necessary to adhere to strict rules and syntax, as, for example, in BPMN. These notations will not be feasible, they are needed to understand the features of the workflow, structure and subsequent work with data. And therefore, if your diagram is clear to both you and the customer, some deviations from the DFD standards are quite acceptable.
You can draw DFD diagrams, in principle, where and how you prefer. But if you want to work with decomposition, to build a system at different levels of detail, then you will have to forget the "drawers" (Visio, Paint, etc.). You will need specialized software for modeling.
Personally, I use the ERwin program and recommend it to everyone. One of the reasons for my choice is the features of decomposition. In ERwin, as in some other similar systems, there is the possibility of decomposing DFD processes in IDEF3 format, i.e. the main diagram will be in DFD format, and at the most general level you will see the main data flows and the “nodes” of their processing. And when decomposing, you can use the already process approach, which is also very convenient for developing large systems or working with different business divisions.
Questions and answers
What is the difference between DFD and UML?
There is a language for creating UML notations, which also positions itself as data-based notations. But at the same time, UML is already a programming language, there is a hard syntax, requirements, but there are also much more possibilities for describing various functions. DFDs are notations that are used more freely, are more suitable for planning, exploring possible solutions, discussing with the customer, etc.
If you are a developer and you know UML, it’s possible that even some preliminary solutions will be more convenient for you to create in this notation. And for a business consultant, DFD will always be more convenient as a tool, since a business consultant does not need a detailed description of functions from the point of view of automation, this is the task of technical specialists. But time and energy DFD saves a lot.
You should not consider DFD as a simplified version of UML. Despite the similarities in approach, these are different tools designed for different purposes.
How many elements can be used in DFD?
Unlike systems with strict syntax and rules, DFD has no limit on the number of elements that can be in one diagram. For comparison: in IDEF0 the number of such elements, then only detail (decomposition) or different notations.
On the one hand, this is a big plus, since the absence of restrictions gives maximum freedom and comfort when compiling a notation. On the other hand, this freedom is not recommended to be abused. Remember, the more elements you have on the chart, the more difficult it is to read.
Can I use DFD notations to work with clients?
In principle, no one can prohibit this. Moreover, in limited quantities, as an illustration to some of your explanations, such notations are perfect for discussing the features of the project with the client. But still, customers are usually poorly versed in automation issues, data storage structure, processing capabilities, etc. This is all the responsibility of the developers. And DFD notations are built taking into account the peculiarities of working with data, so I still recommend using them mainly when discussing a project with specialists, when creating a technical description and assigning it to developers, in order to increase the understanding of the essence and features of the project by developers. It can be difficult for an untrained customer to even explain the features of DFD notations.