October 19, 2017 at 12:20
VPC Statistics Service

In this article we will talk about what components are used to collect, process and store virtual machine metrics, and give examples of how to use these components in a VPC project.
For receiving metrics and their initial processing, the OpenStack Ceilometer component is responsible .
For a long time, it was the only OpenStack component that provided all the basic telemetry capabilities.
Subsequently, the developers divided Ceilometer functions between several products:
- Aodh - alert service;
- Gnocchi - storage service for aggregated measurements;
- Panko - service for storing information about events;
- Ceilometer is a measurement collection service.
Aodh and Panko will remain outside the scope of this article.
Measurement Collection - OpenStack Ceilometer
Ceilometer can collect measurements about the use of CPU, RAM, network interfaces, disks, temperature values from various sources:
- directly from hypervisors ( KVM , Hyper-V , XEN , VMware );
- from the message queue ( RabbitMQ , ZeroMQ , Kafka );
- By polling other OpenStack components through the REST API
- By polling equipment using SNMP or IPMI.
Ceilometer also previously provided an API for working with collected dimensions, metrics, and resources. But starting with the release of OpenStack Ocata, the corresponding functionality was removed from this component, since the main backend for Ceilometer was Gnocchi , which has its own fully-functional API for working with all these objects.
We tried using the Ceilometer from the OpenStack Juno release a few years ago.
Our first version of billing for the VPC project sent reports to it, where they were available to both utility programs and users authorized using the standard OpenStack Keystone token .
The main backends for Ceilometer in those days were SQL database and MongoDB . Unfortunately, both options after six months of use ceased to cope with the load. This was due to the fact that the structure of the data collected was too loose, non-indexable and overly detailed.
Each dimension was stored in its original form, without any aggregations and changes. On large volumes of data, simple operations of sampling measurements for a given time period began to take a very long time and it became impossible to use the service.
To overcome architectural problems in 2014, a team of telemetry services developers for OpenStack launched a new project called Gnocchi. A detailed description of the reasons and the chosen method of solution can be found in the review note on the blog of the main Gnocchi developer - Julien Danjou: OpenStack Ceilometer and the Gnocchi experiment .
Ceilometer Architecture
The Ceilometer architecture is clearly shown in the diagram:
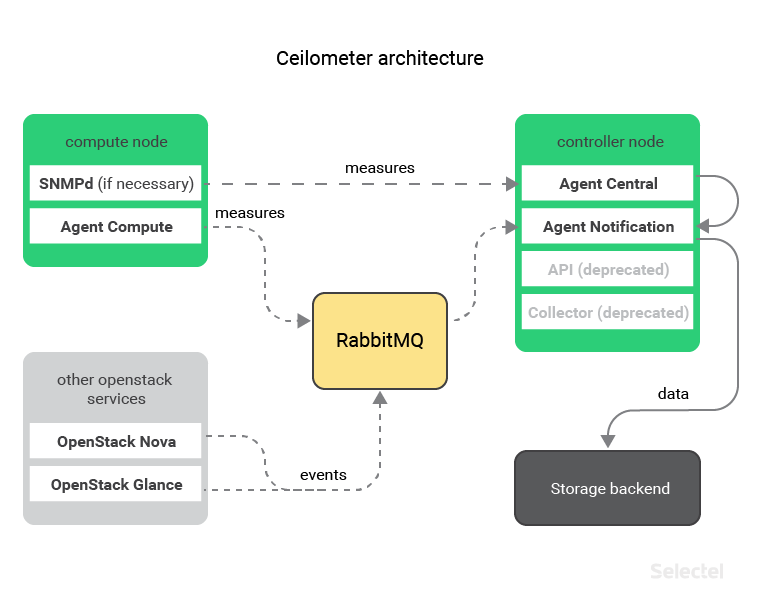
On each host where the hypervisor is installed, there is a Ceilometer Agent Compute component that collects data from virtual machines. The data collected in this case is transmitted to the central agent Ceilometer Agent Notification through a message queue.
If you need to collect data on the loading of physical hosts, then you can install and use an SNMP agent on them. In this case, the data collection will be carried out by the central agent Ceilometer Agent Central .
After processing, this data will be transferred to the Ceilometer Agent Notification, which will send it to the selected backend for storage.
The central Ceilometer Agent Notification can also collect events about other OpenStack components by listening to the message queue. This can be useful if you want to track and save information about creating, changing, or deleting servers, disks, or ports.
Until recently (and more precisely, before the release of OpenStack Ocata , which took place in February this year), along with the Ceilometer Agent Notification and Ceilometer Agent Central, it was required to install one more component on the control hosts - Ceilometer Collector.
This component is no longer in use. All of its functions are performed by Ceilometer Agent Notification.
Ceilometer Setup
The main Ceilometer configuration files are:
- ceilometer.conf - a file that describes all the basic Ceilometer parameters (logging, use of the message queue, authentication, coordination of Ceilometer processes, etc.);
- pipeline.yaml - a file that describes what information and where to collect;
- gnocchi_resources.yaml - description of the correspondence of Ceilometer and Gnocchi objects (we will talk about this later).
The ceilometer.conf file template with all available options can be downloaded or generated using the official documentation: Ceilometer Configuration Options .
The pipeline.yaml file must be completed independently.
Example:
---
sources:                        #Источники данных
  - interval: 600               # Интервал получения данных (секунды)
    meters:                     # Список метрик
      - memory.usage            # Используемая память внутри виртуальной машины (МБ)
      - memory.resident         # Память, используемая виртуальной машиной на хосте (МБ)
    name: memory_meters         # Имя источника измерений
    sinks:                      # Список получателей данных
 - memory.sink                  # Имя получателя данных
  - interval: 600               # Интервал получения данных (секунды)
    meters:                     # Список метрик
      - disk.device.read.bytes  # Суммарное количество прочитанных байт на диске
      - disk.device.write.bytes # Суммарное количество записанных байт на диске
    name: disk_meters           # Имя источника измерений
    sinks:                      # Список потребителей измерений
      - disk_sink               # Имя потребителя измерений
sinks:                          # Потребители измерений
  - name: memory_sink           # Имя получателя данных  (используется источником "memory_meters")
    publishers:                 # Список бэкендов хранения, в которые будут записаны измерения
      - gnocchi://              # Используется только бэкенд Gnocchi
  - name: disk_sink             # Имя получателя данных (используется источником "memory_meters")
    publishers:                 # Список бэкендов для хранения измерений
      - gnocchi://              # Используется только бэкенд Gnocchi (об этом речь пойдёт ниже)
In this file, we can additionally specify transformations for the collected data. For example, we can convert all the obtained values of the memory.usage and memory.resident metrics from megabytes to kilobytes. At the same time, rename these metrics and add units of measure to them.
To do this, we need to edit the memory_sink consumer in this way:
sinks:
  - name: memory_sink
    transformers:
      - name: "unit_conversion"                 # Используем встроенный метод unit_conversion
        parameters:
          source:
            map_from:
              name: "memory\\.(usage|resident)" # Что переименовать
          target:
            map_to:
              name: "memory.\\1.kilobytes"      # Как переименовать
            scale: "volume * 1024.0"            # Как преобразовать значения
            unit: "KB"                          # Добавление единицы измерения
    publishers:
      - gnocchi://
Detailed information about the format of this file and the application of other transformations can be found in the official documentation: Data processing and pipelines .
Next, we will consider the Gnocchi project, which allows you to store collected measurements in an aggregated form and provides an API for working with them.
Data Storage - Gnocchi
The Gnocchi project is a time-series database.
It should be noted that, in early May 2017, Gnocchi developers decided to withdraw this project from the OpenStack infrastructure.
The code base has been ported to GitHub , and the GitHub Issues mechanism is used as a bug tracker . One of the main reasons is the desire to position Gnocchi not only as a backend to Ceilometer, but as a more universal product suitable for other solutions. For example, the Gnocchi repository already has a plugin for saving data from Collectd and a plugin for graphing in Grafana .
Consider the device and the features of Gnocchi in more detail.
Gnocchi Architecture
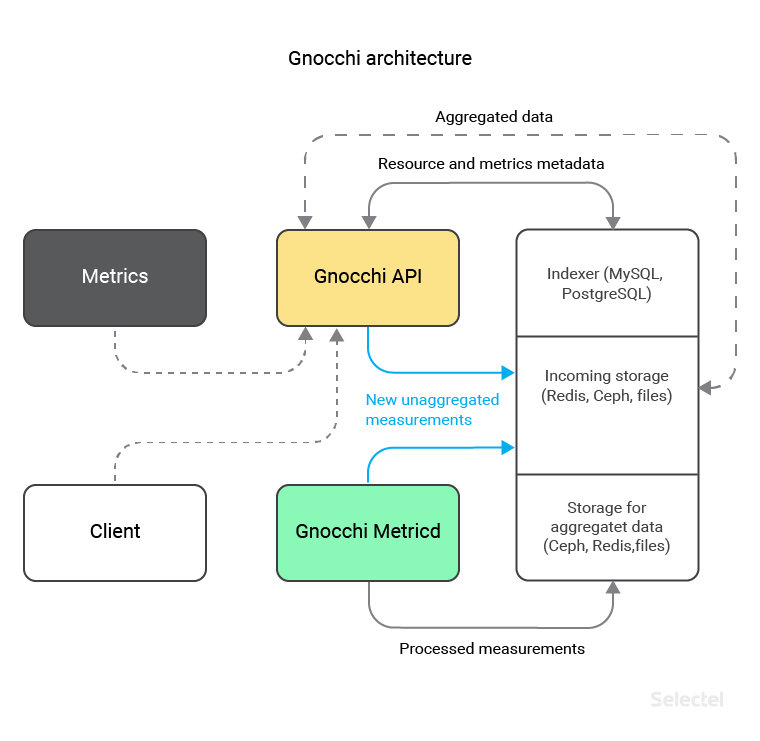
Gnocchi consists of 2 main components:
- API through which data is saved and updated (for example, from Ceilometer, or manually), as well as receiving aggregated data;
- Metricd is a daemon that processes data that has just been received and has not yet been sorted, and saves it in the right form to the selected storage ( Ceph , Redis , OpenStack Swift, or to the local file system).
Starting with version 3.1, Gnocchi introduced support for various types of storages for processed and raw data. This separation allows you to place “hot” non-aggregated data on fast storage (for example, Redis, whose support appeared in Gnocchi version 4.0), and to store the data in aggregated form in a more reliable, scalable backend (for example, Ceph, whose support was still in the first version of Gnocchi).
In addition to direct data storage, Gnocchi also requires an SQL database where metric indices and their metadata are stored. You can use MySQL or PostgreSQL for this. Gnocchi uses its own approach to saving measurements, since all of the listed technologies do not provide the ability to store data in the form of time series.
Saving Data in Gnocchi
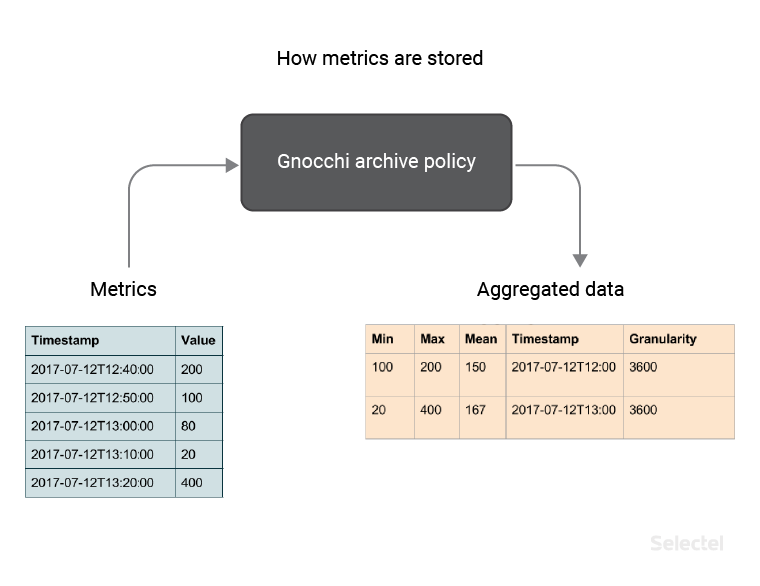
When new data is received, the values are not saved in their original form. Instead, they are aggregated using user-selected methods (in our example, the minimum, maximum, average methods) and stored with the specified accuracy (in our example, 3600 seconds), in accordance with the created archive policy.
We can create archive policies using the python-gnocchiclient console client . For example, create a policy called memory_policy , which contains 3 aggregation methods - minimum, maximum and average, and 2 definitions of how the data will be stored. The first definition says that we will store data with an accuracy of 1 hour for 7 days. The second says that we will store data with an accuracy of 1 day for 1 year.
In addition, we indicate the value of back window equal to 72, which will allow us to save not only the metrics created now, but also the old, for some reason, hung metrics, for a period of no more than 72 days.
controller:~# gnocchi archive-policy create memory_policy \
> -b 72 \
> -m min -m max -m mean \
> -d 'granularity:1h,timespan:7d' \
> -d 'granularity:1d,timespan:365d'
In response, we will get a description of the created policy:
+---------------------+-------------------------------------------------------------------------+
| Field               | Value                                                                   |
+---------------------+-------------------------------------------------------------------------+
| aggregation_methods | max, min, mean                                                          |
| back_window         | 72                                                                      |
| definition          | - points: 168, granularity: 1:00:00, timespan: 7 days, 0:00:00          |
|                     | - points: 365, granularity: 1 day, 0:00:00, timespan: 365 days, 0:00:00 |
| name                | memory_policy                                                           |
+---------------------+-------------------------------------------------------------------------+
Note that points were also automatically calculated for the definitions. This value is calculated by the formula:
Points = Timespan / Granularity
It is required to calculate the place that the values of the stored metrics will occupy.
Gnocchi developers suggest using the following formula to calculate the required space:
Size (in bytes) = 8 * points * aggregation methods
This formula is the worst-case location calculation, since the information is always stored in a compressed form. Using this formula, we can calculate the amount of space for the memory_policy archive policy. For the first determination (accuracy 1 hour for 7 days) we get 4032 bytes:
4032 (bytes) = 8 * 168 * 3
And for the second definition (accuracy 1 day throughout the year) we get 8760 bytes:
8760 (bytes) = 8 * 365 * 3
The values obtained reflect the used space for one metric stored according to the memory_policy policy .
If, for example, we start collecting 2 metrics - memory.usage and memory.resident for 2000 virtual machines, then we need:
2000 * 2 * 4032 (bytes) = 16.128 MB (for 7 days)
2000 * 2 * 8760 (bytes ) = 35.04 MB (for 1 year)
Gnocchi Resources
All metrics stored in Gnocchi refer to some resources. A resource is an abstract object that can contain several metrics and can also have additional fields described in the type of this resource.
The relationship between the metric objects - the resource - the type of resource looks like this:
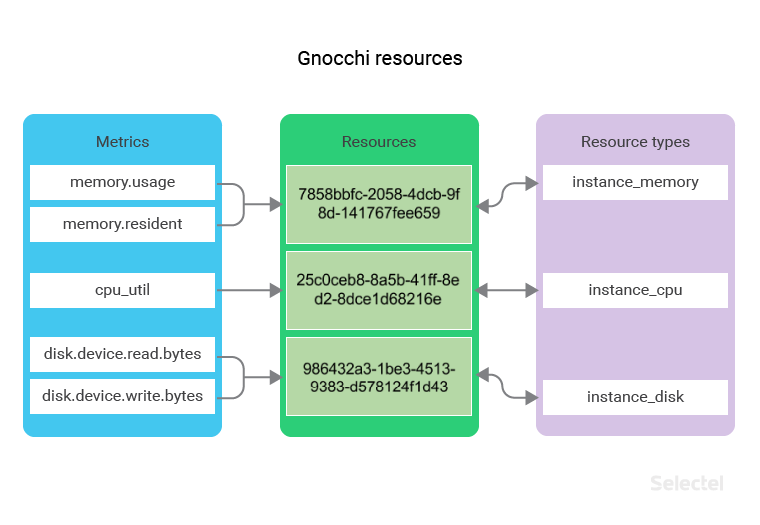
For example, we have a set of resources of type instance_memory . Each resource of this type will contain memory.usage and memory.resident metrics .
If we collect metrics from 2000 virtual machines, then the number of instance_memory resources will also be 2000.
For such resources, it may be useful to store additional information, for example, the host name of the hypervisor on which the virtual machine is running or the identifier of the operating system image (stored in the OpenStack Glance service ) from which the virtual machine was created.
Create an instance_memory resource type using the console command. Specify the described additional host , image_ref fields to store the host name and image identifier, and make the host field mandatory:
controller:~# gnocchi resource-type create instance_memory \
> -a host:string:true:min_length=0:max_length=255 \
> -a image_ref:string:false:min_length=0:max_length=255
In response, we will get a description of the created resource type:
+----------------------+-----------------------------------------------------------+
| Field                | Value                                                     |
+----------------------+-----------------------------------------------------------+
| attributes/host      | max_length=255, min_length=0, required=True, type=string  |
| attributes/image_ref | max_length=255, min_length=0, required=False, type=string |
| name                 | instance_memory                                           |
| state                | active                                                    |
+----------------------+-----------------------------------------------------------+
In the same way, create instance_cpu and instance_disk resource types . The first will have the same additional fields as instance_memory , and the second will have an instance_id field indicating the identifier of the server to which the disk is connected:
controller:~# gnocchi resource-type create instance_cpu \
> -a host:string:true:min_length=0:max_length=255 \
> -a image_ref:string:false:min_length=0:max_length=255
+----------------------+-----------------------------------------------------------+
| Field                | Value                                                     |
+----------------------+-----------------------------------------------------------+
| attributes/host      | max_length=255, min_length=0, required=True, type=string  |
| attributes/image_ref | max_length=255, min_length=0, required=False, type=string |
| name                 | instance_cpu                                              |
| state                | active                                                    |
+----------------------+-----------------------------------------------------------+
controller:~# gnocchi resource-type create instance_disk \
> -a instance_id:uuid:true
+------------------------+--------------------------+
| Field                  | Value                    |
+------------------------+--------------------------+
| attributes/instance_id | required=True, type=uuid |
| name                   | instance_disk            |
| state                  | active                   |
+------------------------+--------------------------+
Now let's figure out how we can start saving Ceilometer metrics to Gnocchi using the created resource types.
Ceilometer + Gnocchi Configuration
To Ceilometer started using Gnocchi as a backend, you must:
1. Add option meter_dispatchers file ceilometer.conf :
[DEFAULT]
meter_dispatchers = gnocchi
2. Create a gnocchi_resources.yaml file that describes the correspondence between Ceilometer metrics and Gnocchi resource types, and also indicates additional fields of resource types:
---
resources:
  - resource_type: instance_memory           # Тип ресурса для выбранных метрик
    metrics:
      - 'memory.usage'                       # Метрика используемой памяти внутри виртуальной машины
      - 'memory.resident'                    # Метрика используемой памяти виртуальной машиной на хосте
    attributes:
      host: resource_metadata.instance_host  # Метаданные о хосте виртуальной машины
      image_ref: resource_metadata.image_ref # Метаданные об образе виртуальной машины
  - resource_type: instance_disk             # Тип ресурса для выбранных метрик
    metrics:
      - 'disk.device.read.bytes'             # Метрика суммарного количества прочитанных байт на диске
      - 'disk.device.write.bytes'            # Метрика суммарного количества записанных байт на диске
    attributes:
      instance_id: resource_metadata.instance_id      # Метаданные с id виртуальной машины
  - resource_type: instance_cpu              # Тип ресурса для выбранной метрики
    metrics:
      - 'cpu_util'                           # Метрика утилизации процессора внутри виртуальной машины
    attributes:
      host: resource_metadata.instance_host  # Метаданные о хосте виртуальной машины
      image_ref: resource_metadata.image_ref # Метаданные об образе виртуальной машины
After starting Ceilometer, data collection and sending to Gnocchi will begin (provided that it has been configured according to the documentation ).
You can monitor the processing status of new data and save it in an aggregated form to the selected storage using the command:
controller:~# gnocchi status
+-----------------------------------------------------+-------+
| Field                                               | Value |
+-----------------------------------------------------+-------+
| storage/number of metric having measures to process | 93    |
| storage/total number of measures to process         | 93    |
+-----------------------------------------------------+-------+
In the above conclusion, you can see that now Gnocchi-metricd processes 93 measurements distributed over 93 metrics.
Using this command, you can monitor whether the Gnocchi-metricd component handles incoming metrics.
Processing speed will directly depend on the number of Gnocchi-metricd processes and the performance of the selected data warehouse.
Display aggregated information
After the received measurements are processed and saved, it will be possible to get access to resources and measurements of Gnocchi.
We derive resources with the instance_memory type , limit the output to three resources, and display only 4 columns — the identifier of the resource itself, its type, the host name of the virtual machine and the identifier of its image:
controller:~# gnocchi resource list --type instance_memory --limit 3 --column id --column type --column host --column image_ref
+--------------------------------------+-----------------+-----------+--------------------------------------+
| id                                   | type            | host      | image_ref                            |
+--------------------------------------+-----------------+-----------+--------------------------------------+
| 945ad3cc-2617-4b19-a681-5a1cb96d71e1 | instance_memory | compute00 | 3456e843-b7fe-42be-8c4c-0c7d1c2d09c7 |
| e33c895f-e38a-4f8e-be07-8fe0d7c8275f | instance_memory | compute02 | 27bbfeb7-0706-4d11-bb59-f98d6b08dc1c |
| 023fed66-3fdd-43b6-b02e-325da55b62cc | instance_memory | compute04 | f0f5e0aa-4615-462e-8340-b8258aae90e2 |
+--------------------------------------+-----------------+-----------+--------------------------------------+
We will display columns with metrics and type for the resource 945ad3cc-2617-4b19-a681-5a1cb96d71e1 :
controller:~# gnocchi resource show --column metrics --column type 945ad3cc-2617-4b19-a681-5a1cb96d71e1
+---------+-------------------------------------------------------+
| Field   | Value                                                 |
+---------+-------------------------------------------------------+
| metrics | memory.resident: f56b76ad-5ce8-49fe-975f-6e5da412df31 |
|         | memory.usage: aa757f46-52b9-40de-898c-524dfe29b7bc    |
| type    | sel_instance                                          |
+---------+-------------------------------------------------------+
Let's look at the average values for measuring the metric aa757f46-52b9-40de-898c-524dfe29b7bc , in the interval 12:00 - 18:00 for the date 08/25/2017, and with an accuracy of one hour:
controller:~# gnocchi measures show --aggregation mean --granularity 3600 --start 2017-08-25T12:00 --stop 2017-08-25T18:00 aa757f46-52b9-40de-898c-524dfe29b7bc
+---------------------------+-------------+---------------+
| timestamp | granularity   | value       |               |
+---------------------------+-------------+---------------+
| 2017-08-25T12:00:00+00:00 | 3600.0      | 2231.75       |
| 2017-08-25T13:00:00+00:00 | 3600.0      | 2238.66666667 |
| 2017-08-25T14:00:00+00:00 | 3600.0      | 2248.58333333 |
| 2017-08-25T15:00:00+00:00 | 3600.0      | 2259.08333333 |
| 2017-08-25T16:00:00+00:00 | 3600.0      | 2240.41666667 |
| 2017-08-25T17:00:00+00:00 | 3600.0      | 2249.66666667 |
+---------------------------+-------------+---------------+
Aggregated information can be obtained not only using the console utility, but also through the REST API. Let's look at a few examples:
Getting the values of the memory.usage metric for a resource of type instance_memory , with an accuracy of 24 hours, starting from the date 08/28/2017:
controller:~# curl -XGET \
> -H 'Content-Type: application/json' \
> -H 'X-Auth-Token: KEYSTONE_TOKEN' \
> 'controller:8041/v1/resource/instance_memory/684f5b56-2c06-485a-ae1a-66ab5c4175fb/metric/memory.usage/measures?start=2017-08-28&granularity=86400' \
> | python -m json.tool
[
    [
        "2017-08-28T00:00:00+00:00",
        86400.0,
        2645.9444444444443
    ],
    [
        "2017-08-29T00:00:00+00:00",
        86400.0,
        2671.625
    ],
    [
        "2017-08-30T00:00:00+00:00",
        86400.0,
        2681.5438596491226
    ]
]
Search for a resource with the instance_memory type created after 08/29/2017 with the value "compute19" in the host field :
controller:~# curl -XPOST \
> -H 'Content-Type: application/json' \
> -H 'X-Auth-Token: KEYSTONE_TOKEN' \
> 'controller:8041/v1/search/resource/instance_memory \
> -d '{
>   "and": [
>     {
>       "=": {
>         "host": "compute19"
>       }
>     },
>     {
>       ">": {
>         "started_at": "2017-08-29"
>       }
>     }
>   ]
> }' \
> | python -m json.tool
[
    {
        "created_by_project_id": "99288fd3d178459f808c1e8bc2cf9e49",
        "created_by_user_id": "7dd0582d38aa471bbe8995f63a1293a9",
        "creator": "7dd0582d38aa471bbe8995f63a1293a9:99288fd3d178459f808c1e8bc2cf9e49",
        "ended_at": null,
        "host": "compute19",
        "id": "9052e237-ad17-47be-8aa5-10aacbf6717f",
        "image_ref": "e12ef13d-783c-4030-9251-ad2c8e270453",
        "metrics": {
            "memory.resident": "365db8ce-f4f7-4e59-ac9f-03dcdfe81195",
            "memory.usage": "084157b7-09d3-45e7-a869-fad62062025a"
        },
        "original_resource_id": "9052e237-ad17-47be-8aa5-10aacbf6717f",
        "project_id": "99288fd3d178459f808c1e8bc2cf9e49",
        "revision_end": null,
        "revision_start": "2017-08-30T20:35:19.214598+00:00",
        "started_at": "2017-08-30T20:35:19.214577+00:00",
        "type": "instance_memory",
        "user_id": "7dd0582d38aa471bbe8995f63a1293a9"
    }
]
Getting aggregation by the maximum values of memory.resident metrics with an accuracy of up to one hour for virtual machines running on the compute19 host ; metrics are systematized by project identifiers:
controller:~# curl -XPOST \
> -H 'Content-Type: application/json' \
> -H 'X-Auth-Token: KEYSTONE_TOKEN' \
> 'controller:8041/v1/aggregation/resource/instance_memory/metric/memory.resident&aggregation=max&granularity=3600&groupby=project_id' \
> -d '{
>   "=": {
>     "host": "compute19"
>   }
> }' \
> | python -m json.tool
[
  {
    "group": {
      "project_id": "eef577b17cfe4432b7769d0078dbb625"
    },
    "measures": [
      [
        "2017-08-29T09:00:00+00:00",
        3600,
        735
      ],
      [
        "2017-08-30T11:00:00+00:00",
        3600,
        949
      ]
    ]
  },
  {
    "group": {
      "project_id": "b998dbbb9b02474c9dc49ffc289eae8c"
    },
    "measures": [
      [
        "2017-08-29T09:00:00+00:00",
        3600,
        612
      ],
      [
        "2017-08-30T11:00:00+00:00",
        3600,
        642
      ]
    ]
  }
]
Other examples of using the REST API are available in the official documentation .
Statistics in the VPC service
We are currently using the described components in the VPC service .
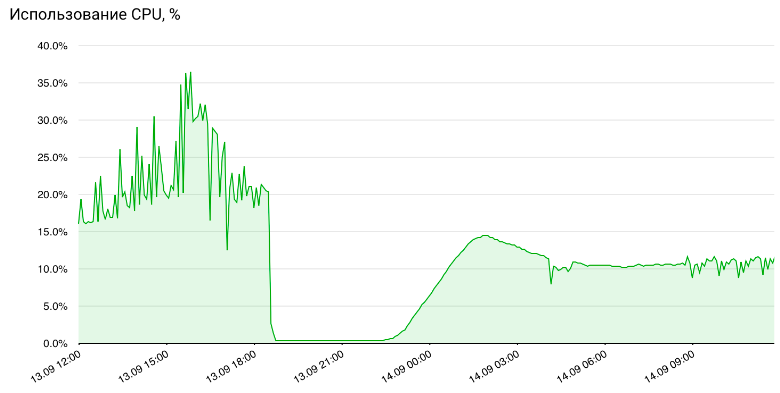
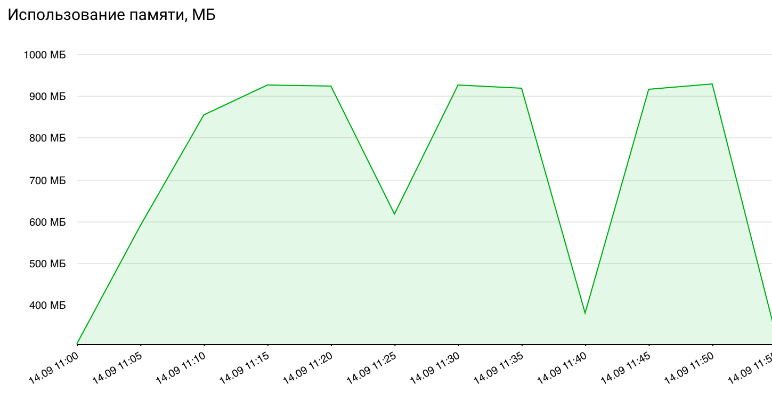
The following metrics for virtual machines are available to users:
- CPU utilization, in% ( cpu_util );
- RAM usage, in MB ( memory.usage ).
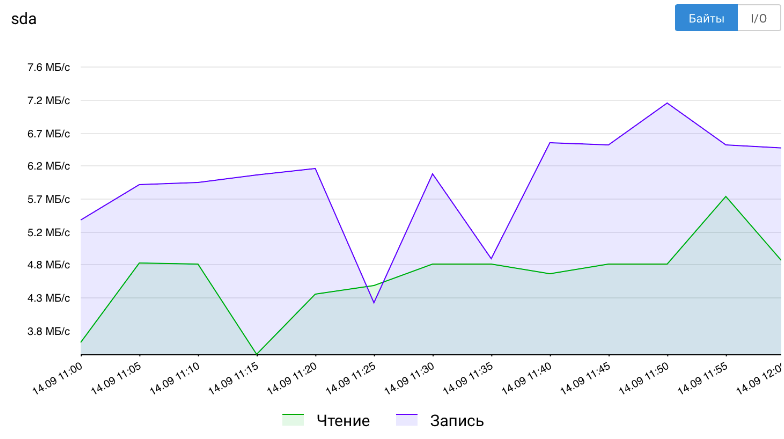
Drive metrics:
- the number of bytes / c for reading and writing ( disk.device.read.bytes , disk.device.write.byte s);
- The number of read and write requests per second ( disk.device.read.requests , disk.device.write.requests ).
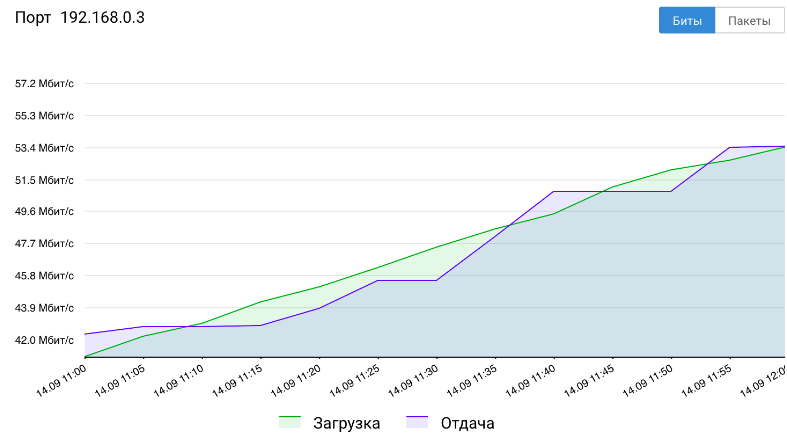
And metrics for network interfaces:
- the number of bits / c of incoming and outgoing traffic ( network.incoming.bits , network.outgoing.bits );
- the number of packets of incoming and outgoing traffic per second ( network.incoming.packets , network.outgoing.packets ).
All data can be received either through the REST API or the Gnocchi console client, or in the form of built-in graphs in the server control panel.
CPU usage graphs
RAM usage graphs
Disk load graphs
Network Interface Load Charts
Conclusion
In this article, we examined two components for collecting, storing, and displaying statistics about OpenStack objects.
If you have any questions, welcome to comment.
If you would be interested to try gnocchi as a service in which you could write your own data - write to us about it.
We will also be glad if you share your own experience using the Ceilometer or Gnocchi.